

Summary
The peroxisome proliferator-activated receptor gamma coactivators (PGC-1) have important roles in mitochondrial biogenesis and metabolic control in a variety of tissues. There are multiple isoforms of PGC-1 including PGC-1α and PGC-1β. Both the PGC-1α and β isoforms promote mitochondrial biogenesis and fatty acid oxidation, but only PGC-1α stimulates gluconeogenesis in the liver. Carnitine palmitoyltransferase I (CPT-I) is a key enzyme regulating mitochondrial fatty acid oxidation. In these studies, we determined that PGC-1β stimulated expression of the “liver” isoform of CPT-I (CPT-Iα) but that PGC-1β did not induce pyruvate dehydrogenase kinase 4 (PDK4) which is a regulator of pyruvate metabolism. The CPT-Iα gene is induced by thyroid hormone. We found that T3 increased the expression of PGC-1β and that PGC-1β enhanced the T3 induction of CPT-Iα. The thyroid hormone receptor interacts with PGC-1β in a ligand dependent manner. Unlike PGC-1α, the interaction of PGC-1β and the T3 receptor does not occur exclusively through the leucine-X-X-leucine-leucine motif in PGC-1β. We have found that PGC-1β is associated with the CPT-Iα gene in vivo. Overall, our results demonstrate that PGC-1β is a coactivator in the T3 induction of CPT-Iα and that PGC-1β has similarities and differences with the PGC-1α isoform.
Keywords: PGC-1, carnitine palmitoyltransferase (CPT-Iα), fatty acid oxidation, thyroid hormone (T3), CREB binding protein (CBP)
Introduction
The primary rate controlling step in the beta oxidation of fatty acids is catalyzed by carnitine palmitoyltransferase I (CPT I) [1]. CPT-I is located in the outer mitochondrial membrane and catalyzes the transfer of acyl moiety of long chain fatty acyl-CoA to carnitine to form acyl-carnitine. Acyl-carnitine is then transported across the mitochondrial inner membrane into the mitochondrial matrix where the acyl-CoA is reformed to enter beta oxidation. This reverse reaction is catalyzed by CPT-II located on the inner mitochondrial membrane. There are three isoforms of CPT-I which include the “liver” isoform (CPT-Iα), the “muscle” isoform (CPT-Iβ) and the “brain” isoform (CPT-Iγ) [1–3]. CPT-Iα is expressed in all tissues except skeletal muscle and adipose tissue.
CPT-Iα is regulated by alterations in enzyme activity and gene expression [2,4–6]. CPT-Iα activity is decreased in hypothyroid animals and following fasting and re-feeding [1,7]. In addition, CPT-Iα is inhibited by malonyl-CoA which is a substrate for fatty acid synthesis [8]. The sensitivity of CPT-Iα to malonyl-CoA inhibition is increased in hypothyroid animals and by insulin administration [5,7]. Transcription of the CPT-Iα gene is regulated by hormones, nuclear receptors and their accessory proteins [4,9,10]. Thyroid hormone (T3) is a crucial regulator of cellular metabolism and growth [11]. We have observed that the expression of the rat CPT-Iα gene and CPT-Iα activity are increased in hyperthyroid states [5,7]. In the liver, there is a 40-fold difference in CPT-Iα mRNA abundance between hypothyroid and hyperthyroid animals [7]. The actions of T3 are mediated through the thyroid hormone receptor (TR) which belongs to the family of nuclear receptors. TR binds to the promoter of target genes at specific recognition sequences known as thyroid hormone response elements (TRE) [12]. Our lab has cloned and characterized the promoter for the rat CPT-Iα gene and identified a TRE at nucleotides −2938/−2923 [4,13,14]. The TR binds to this TRE as a heterodimer with retinoid X receptor (RXR) [4]. A unique feature of the T3 induction of the CPT-Iα gene is that the first intron is crucial for the full induction of CPT-Iα by T3 [4,9]. We have found that T3 induces CPT-Iα gene expression in the liver but not in heart and that sequences in the first intron are responsible for this tissue specific regulation [9,15].
Coactivators play a crucial role in the hormonal regulation of gene expression [16,17]. Several classes of transcriptional coactivators are known to interact with and coactivate TRs including the CREB binding protein and its homologue p300 (CBP/p300), steroid receptor coactivator 1 (SRC1) and thyroid receptor associated proteins (TRAPs) [11]. More recently, a new class of coactivators has been identified that stimulates mitochondrial biogenesis and the metabolic rate. These proteins belong to the peroxisome proliferator activated receptor gamma coactivator-1 (PGC-1) family of transcriptional coactivators [18–21]. The three known members of this family include PGC-1α, PGC-1β and (PGC related coactivator) [22,23]. PGC-1β is expressed in a tissue specific manner being present in large amounts in brown fat and heart and in moderate amounts in skeletal muscle, liver and white adipose tissue [20]. PGC-1α and PGC-1β both stimulate fatty acid oxidation and mitochondrial biogenesis [24]. However, PGC-1α induces hepatic glucose production while PGC-1β does not suggesting that these coactivators play different regulatory roles in intermediary metabolism [24]. Unlike PGC-1α, PGC-1β does not stimulate the key gluconeogenic genes phosphoenolpyruvate carboxykinase (PEPCK) or glucose-6-phosphatase (G6Pase) [24]. The PGC-1 isoforms interact with a variety of nuclear receptors and enhance their transcriptional activation function [25]. Often this interaction is through the conserved leucine-X-X-leucine-leucine (LXXLL) motif [11,19]. We have previously shown that PGC-1α stimulates the CPT-Iα and the pyruvate dehydrogenase kinase 4 (PDK4) genes [26,27]. PDK4 will phosphorylate the pyruvate dehydrogenase complex (PDC) and inhibit the oxidation of pyruvate to acetyl-CoA [28]. In the present study, we examined the role of PGC-1β in the regulation of CPT-Iα and PDK4. We demonstrate here that PGC-1β enhances expression of the CPT-Iα gene.
Experimental Procedures
Transient transfections of luciferase vectors
Transfections were performed in HepG2 hepatoma cells using the calcium phosphate method as described previously [26]. Briefly, HepG2 cells were transfected overnight in Dulbecco’s Modified Eagle’s Medium (DMEM) containing 5% calf serum, 5% fetal calf serum and incubated overnight at 37 °C. The following day the cells were washed and the media was changed to serum free media. Cells were harvested after 24 hrs and luciferase assays performed using Promega Dual Luciferase kit (Cat No. E 1960) following the manufacturer’s protocol. Luciferase values were normalized for protein content and renilla luciferase activity to account for cell density and transfection efficiency, respectively.
Construction of the rat promoter CPT-Iα (accession no AF020776) luciferase vectors was described previously [4]. The Gal4 PGC-1β vectors were created by generating fragments of PGC-1β cDNA (accession no NM-133249) by PCR amplification. The forward primers contained an Mlu I restriction site and the reverse primers contained a Hind III site. The forward primer used for Gal4 PGC-1β 1–1014, 1–130, 1–170, 1–80 and 1–50 was cggacgcgtgatggcggggaacgactgcgg. The reverse primers were ctgaagcttatgcaggctctgctgggcct (1–1014), agaaagcttggcaggtgaggctggggtgc (1–130), cagaagcttagagcttgctgttggggagg (1–170), gaaaagcttggagtcatcggggctgtact (1–80) and gtcaagcttactggcgtccagctgggaga (1–50). The forward primer for 171–350 and 171–1014 was agcacgcgttgacgctctgaaggacggggc and the reverse primer was acaaagcttatcttgggccagaagttccc (171–350) or ctgaagcttatgcaggctctgctgggcct (171–1014). The forward primer for 351–1014 was ggcacgcgttatcctctgtgatgttagcaa and the reverse primer was ctgaagcttatgcaggctctgctgggcct. The PCR products were cut with the appropriate restriction enzymes and cloned into the pM-Gal4 expression vector (BD Biosciences). The vectors were all confirmed by DNA sequencing at the University of Tennessee Molecular Resources Center.
Real Time PCR analysis
RNA was extracted from primary rat hepatocytes using RNA-Stat-60 (Tel-Test) [5]. The RNA was initially treated with DNase I (2 units) at 37 °C for 40 min. DNase I was stopped by addition of DNase Inactivation Reagent (Ambion). Equal amounts of DNA-free RNA were used for first-strand cDNA synthesis. RNA was mixed with 1 μl of 10 mM dNTP mix and 1 μl of random hexamers (50 ng/μl). The conditions for the reverse transcription to generate cDNA have been described previously [26,29]. The parameters for real time PCR were as follows: 95 °C for 2.5 min, 95 °C for 8.5 min, 40 cycles of 95 °C 30 s and 60 °C 1 min. A DNA dissociation curve was executed for each sample that consisted of 100 cycles of 10 s each from 60 to 100 °C in 0.4 °C increments. The first derivative of this DNA dissociation curve was plotted to show peaks for each target amplified. The final concentration of primers in each well in the PCR plates was 0.1 μM. The sequence of primers used is provided in Table I. Oligonucleotide standards were synthesized and quantitated by HPLC. These standards were diluted to 10−9, 10−8, 10−7, 10−6, and 10−5 μM and used as templates for each standard curve. A 1:50 dilution of each cDNA as template was used to measure 18S ribosomal RNA (rRNA), and 1 μl of 1:10 or 1:20 dilution of each cDNA was used as a template to assess target genes. The 18S rRNA was used to normalize all results.
Table I.
The following forward (FP) and reverse primers (RP) were used for real time PCR to quantitate mRNA abundance. The conditions for real time PCR are described in “Materials and Methods.”
| PGC-1β FP | CTACCAGAGCCCACCCAGTA |
| PGC-1β RP | CAGGATGAGGAGCCAGAACT |
| PDK4 FP | GGATTACTGACCGCCTCTTTAGTT |
| PDK4 RP | GCATTCCGTGAATTGTCCATC |
| CPT-Iα FP | CGGTTCAAGAATGGCATCATC |
| CPT-Iα RP | TCACACCCACCACCACGAT |
| 18S FP | CGGCTACCACATCCAAGGAA |
| 18S RP | TTTTCGTCACTACCTCCCCG |
Adenoviral Infection
Primary rat hepatocytes were infected with adenovirus expressing PGC-1β (Ad PGC-1β) (kindly provided by Dr. Bruce Spiegelman, Dana Faber Cancer Institute) at an MOI of 50 [24]. Adenovirus expressing green fluorescent protein (Ad-GFP) was used as a control. Hepatocytes were maintained in RPMI 1640 media with 1% penicillin/streptomycin and 1μg/ml fungizone in the absence of serum. Media was changed 16 hrs after infection. After 40 hrs, the cells were harvested and RNA was isolated using RNA Stat 60 (Teltest).
Carnitine palmitoyltransferase activity assay
Primary hepatocytes were isolated and cultured as described previously [30]. For the measurement of CPT activity, the cells were infected with either Ad-GFP or Ad-PGC-1β. After 40 hours, the cells were harvested by scraping from plates with a rubber spatula and used for measurement of CPT activity. The cells were homogenized in mitochondrial isolation medium (20 mM HEPES-KOH pH 7.5, 10 mM KCl, 1.5 mM MgCl2, 1 mM DTT, 1 mM EDTA, 1 mM EGTA and protease inhibitors) with three passes of a Teflon-glass homogenizer before centrifugation at 10,000 × g for 10 min at 4 °C [31]. Approximately 95 ± 6 % of the monoamine oxidase activity, a mitochondrial inner membrane space marker enzyme, was found in this pellet which was used for assay of CPT-I after resuspension in mitochondrial isolation medium using four passes of a Teflon-glass homogenizer. A modified procedure of Bremer described earlier was used to measure CPT activity [32,33]. Final concentrations in a total volume of 1 ml at 37 °C were: 80 mM sucrose, 70 mM KCl, 70 mM imidazole (pH 7.0), 1 mM EGTA, 1 μg of antimycin A, 2 mg of BSA. A 5 min preincubation period was initiated by the addition of 80 μM myristoyl-CoA. The reaction was started with L-carnitine (0.8 mCi/mmol L-[methyl-3H]carnitine) and stopped after 5 min by adding 4 ml of 1.0 M perchloric acid. The extraction and quantitation of the radio labeled acyl-carnitine product was conducted as described previously [33]. Under these conditions, the assay was found to be linear up to 20 minutes with mitochondria from primary cultures of hepatocytes, and the assay was also linear with respect to the protein concentration within the range used for these assays.
GST Pull-down assays
GST fusion proteins were created with the PGC-1β and PGC-1α (accession no NM-008904) cDNAs. The N-terminus amino acids 1–170 and 1–130 of PGC-1β and N-terminus amino acids 1–170 of PGC-1α were created using PCR amplification and cloned into pGEX 4T.1 (Amersham Biosciences) using Eco RI and Xho I restriction sites. The forward primer used for N-terminus PGC-1β constructs was ggcgaattcatggcggggaacgactgcgg and the reverse primers were cagctcgagagagcttgctgttggggagg (1–170) and agactcgagggcaggtgaggctggggtgc (1–130). These plasmids along with a GST control were transformed into BL21 bacterial cells. GST fusion protein expression in bacterial cultures was induced by addition of 1 mM isopropyl β-D-1-thiogalactopyranoside. GST proteins were purified with GST bind resin (Novagen) and eluted with reduced glutathione. Purified proteins were subjected to SDS-PAGE and detected using Coomassie blue staining.
Pull-down assays were performed using GST fusion proteins and histidine tagged TRβ (His-TRβ) [34]. Equal amounts of GST proteins (10 ug) were allowed to bind with 40μl of GST bind resin (50% resin). The GST proteins were then allowed to interact with either 10ug of His-TRβ in a binding buffer (20 mM Hepes pH7.5, 75 mM KCl, 0.1 mM EDTA, 2.5 mM MgCl2, 0.05% NP40, 2 mM DTT and 10% glycerol) overnight at 4°C. The resin was washed 4 times in the binding buffer and the bound proteins were eluted using SDS PAGE sample buffer. The eluted proteins were resolved on 12% SDS PAGE. The proteins were then transferred to 0.45-μm pure nitrocellulose membrane (Bio-Rad). Blots were immunoblotted with primary antibodies (anti-TRβ, Santa Cruz sc-738) in phosphate-buffered saline containing 5% nonfat dry milk powder and incubated with horseradish peroxidase-conjugated anti-mouse secondary antibody (Bio-Rad). Immunoreactive proteins were identified using Super Signal West Femto Chemiluminescence Substrate (Pierce).
S35-methionine TRβ and S35-methionine CBP (amino acids 1800–2430) were generated using Promega coupled Transcription and Translation kit (Catalog No. L1170) and were used in the binding assay with GST fusion proteins. The GST proteins were allowed to bind with 5 μl of S35 labeled proteins in a binding buffer overnight. 40 μl of GST sepharose beads were added and the bound proteins were allowed to collect for 2 hours. The beads were extensively washed and eluted in the sample loading buffer. The eluted proteins were run on a 12% SDS PAGE gel and the gel was fixed and was treated with fluorescence enhancer (Amersham Biosciences). The gel was exposed to film and the S35 labeled TRβ and CBP were detected autoradiographically.
Chromatin Immunoprecipitation (ChIP) assay
Primary rat hepatocytes were treated with 10 μM T3 for 24 hrs. Cells were cross linked using 1% formaldehyde for 15 min at room temperature. The cross linking reaction was stopped using 0.125M glycine for 5 min. Cells were washed twice with ice cold phosphate buffered saline (PBS). PBS was added to the cells and cells were scraped from the plates. PBS was removed by centrifugation and the cell pellet was lysed using cell lysis buffer (50 mM Tris-HCl, pH 8.0, 85 mM KCl, 0.5% Nonidet P-40) on ice. Nuclear pellet was collected by centrifugation at 3200 × g for 5 min and resuspended in SDS lysis buffer (1% SDS, 10 mM EDTA, 50 mM Tris-HCl, pH 8.1) for 10 min in ice. The nuclear lysate was then sheared using 9 cycles of 15secs (Branson 450 sonifier amplitude 56%) at 4°C. The sheared nuclear lysate was then centrifuged at 16100 × g for 10 min at 4°C. The supernatant containing DNA protein complex was diluted 10 fold in ChIP dilution buffer (0.01% SDS, 1.1% Triton X-100, 1.2 mM EDTA, 16.7 mM Tris-HCl, pH 8.1, 167 mM NaCl) with protease inhibitors. The samples were precleared with 80 μl of salmon sperm DNA/protein A-agarose, 50% slurry (16–157, Upstate Biotechnology, Inc.) for 45 min at 4 °C. After a brief centrifugation, the supernatant was transferred to a new tube. The supernatant was incubated with either 5 μg of anti-PGC-1α (Santa Cruz, sc-13067) or anti-CBP antibodies (Santa Cruz, sc-369) at 4 °C overnight. Rabbit IgG (Santa Cruz, sc-2027) was used as the control. To collect the antibody-protein-DNA complex, 60 μl of protein A-agarose slurry was added for 2 h at 4 °C.
The protein A-agarose was washed five times as described previously [26]. The precipitates were eluted with elution buffer (1% SDS, 0.1 M NaHCO3), and 0.3 M NaCl was added to reverse cross-links at 65 °C for overnight. DNA was precipitated with 2.5 volumes of ethanol. The pellet was resuspended in 100 μl of water, 4 μl of Tris, pH 6.8, 2 μl of 0.5 M EDTA, pH 8.0, and 1 μl of 20 mg/ml proteinase K. After incubation at 45 °C for 1 h, genomic DNA fragments were purified using QIAquick spin columns (28104, Qiagen). A total of 3–5 μl of purified sample was used in 35 cycles of PCR. PCR cycling conditions for the CPT-Iα TRE and the first intron were: 94°C for 30sec, 55°C for 30sec and 72°C for 1min. For the upstream primer pairs 57°C was used as the annealing temperature. Primers for regions of the target genes are listed in table II. The PCR products were analyzed on 2% Nusieve 3:1 agarose (Cambrex, 50094) and visualized with MultiImage Light Cabinet with Quantity One software. For ChIP assays with PGC-1β, HepG2 cells were transfected with 4 μg of −4495/+1240 CPT-Iα luc and 4μg of Flag-PGC-1β expression vector using lipofectamine 2000 (Invitrogen) following the manufacturer’s protocol. Forty-eight hours after transfection, cells were cross linked with 1% formaldehyde and the ChIP assay procedures described above were followed. Antibody against Flag (Sigma) was used in the immunoprecipitation.
Table II.
The following forward (FP) and reverse primers (RP) were used to demonstrate the interactions of PGC-1 and CBP with the CPT-Iα gene.
| Rat CPT-Iα TRE primers | ||
| FP: | −3079/−3056 | GACAGGCAGGGTACATTTCACAG |
| RP: | −2802/−2825 | GAAGGCAGTGCTTTTCCCTAC |
| Rat CPT-Iα first intron primers | ||
| FP: | +674/+693 | AGACTGCTCAAGGTCGCGCT |
| RP: | +907/+927 | GAGAGTCCTGAGCCTGATTGT |
| Rat CPT-Iα upstream primers | ||
| FP: | −4478/−4458 | TTGTGAGCAACCACGTGGCG |
| RP: | −4298/−4279 | GGTTCTGAGCTGCTCTGAAT |
siRNA constructs and transfections
siRNA sequences against PGC-1α and PGC-1β were cloned into pSilencer expression vectors (Ambion) that encode shRNA. The short hairpin oligomer used for PGC-1α was gagcaagtatgactctctgtttcaagacagagagtcatacttgctc and for PGC-1β was gatatcctctgtgatgttattcaagagataacatcacagaggttag. Empty pSilencer construct and the scrambled oligonuleotide (pSilencer NC) were used as controls. The pSilencer plasmids were transfected into the McA-RH7777 cells along with CPT-Iα luciferase reporter in the presence or absence of T3. Relative luciferase values were determined as described earlier.
Results
The first experiments were designed to test whether PGC-1β would stimulate CPT-Iα gene expression. To determine if PGC-1β induced the endogenous CPT-Iα gene, we infected rat primary hepatocytes with an adenoviral vector expressing PGC-1β. The adenoviral vector expressing GFP (Ad-GFP) alone was used as the control. Forty hours after infection, RNA was isolated and analyzed for CPT-Iα mRNA abundance by real time PCR. As shown in figure 1A, PGC-1β over-expression increased CPT-Iα gene expression 3.7 ± 0.3 fold as compared to GFP. The CPT-Iα mRNA was increased from 0.019 pmoles per nmol 18S to 0.064 pmoles following PGC-1β infection. These results demonstrate that PGC-1β induces expression of the CPT-Iα gene. As a comparison, we infected hepatocytes with Ad-PGC-1α. PGC-1β and PGC-1α stimulated the CPT-Iα gene expression to a similar extent. Previous studies had shown that PGC-1β does not stimulate genes involved in gluconeogenesis including PEPCK and G6Pase [24]. We tested the ability of PGC-1β to induce PDK4 gene expression. PGC-1β did not increase the mRNA of pyruvate dehydrogenase kinase 4 (PDK4) while the PGC-1α strongly stimulated PDK4 (Fig. 1A). These data highlight differential actions of PGC-1β and PGC-1α on hepatic gene expression. We investigated whether the PGC-1β infection of rat primary hepatocytes would increase CPT-Iα enzyme activity. The mitochondrial fraction isolated from these hepatocytes was tested for CPT-Iα activity using myristoyl-CoA as the substrate. As seen in figure 1B, there was a 1.7 ± 0.3 fold increase in CPT enzyme activity from 2.1 ± 0.3 to 3.7 ± 0.6 nmol/min/mg protein in cells infected with Ad-PGC-1β.
Figure 1. PGC-1β and T3 stimulate CPT-1α.


A, Rat primary hepatocytes were infected with adenovirus vectors expressing either PGC-1β (Ad-PGC-1β), PGC-1α (Ad-PGC-1α) or green fluorescent protein (GFP) (Ad-GFP). After 40 hours, the hepatocytes were harvested and RNA was isolated. The mRNA abundance of CPT-Iα or PDK4 was measured by real-time PCR analysis after normalization with 18S rRNA. Data are expressed as the average fold induction of CPT-Iα or PDK4 mRNA abundance in PGC-1 infected cells relative to GFP infected cells. The p< 0.01 for the PGC-1 induction is indicated by an asterisk. The infections were repeated 4 times in independent hepatocyte preparations. B, Rat primary hepatocytes were infected with Ad-GFP or Ad-PGC-1β. Mitochondria were isolated after 40 hours and the CPT-Iα enzyme activity assay was performed as described in the Experimental Procedures. Enzyme activity is expressed as nmol/min/mg protein of acyl-carnitine formed in cells infected with PGC-1β as compared to GFP. The p< 0.01 for the PGC-1β induction is indicated by the # symbol. Infections were repeated three times in duplicate in independent preparations of hepatocytes. C, HepG2 hepatoma cells were transfected with 2μg CPT-Iα luc or a TREX2 SV40 luc reporter gene containing two copies of an idealized TRE, 1μg of pSV or pSV-PGC-1β, 1μg of RSV-TRβ and 0.5μg of TK-Renilla. The following day cells were treated with 100 nM T3 for 24 hours. Cells were harvested and the luciferase activity was corrected for protein content and renilla luciferase activity. The data are expressed as fold induction of luciferase. Transfections were repeated in duplicate four times and the results shown are average ± SE. A model of CPT-Iα luc genes and TREX2 SV40 luc are shown above the figure.
To identify regions of the CPT-Iα gene responsible for the PGC-1β induction, we co-transfected CPT-Iα luc vectors and an expression vector for PGC-1β into HepG2 hepatoma cells. We tested −4495/+1240 CPT-Iα luc and −4495/+19 CPT-Iα luc which are CPT-Iα luc vectors with or without the CPT-Iα first intron to elucidate the importance of first intron in the stimulation by PGC-1β. As seen in Fig 1C, PGC-1β stimulated −4495/+1240 CPT-Iα luc 3.4 ± 0.6 fold and this induction was lost upon deletion of the first intron in −4495/+19 CPT-Iα luc. In addition, we tested whether PGC-1β enhanced the T3 induction of CPT-Iα. T3 alone induced −4495/+1240 CPT-Iα luc 8.2 ± 0.6 fold. PGC-1β and T3 stimulated −4495/+1240 CPT-Iα-luc 17.3 ± 1.6 fold. Upon deletion of the intron in the −4495/+19 CPT-Iα vector, the PGC-1β induction was lost and the T3 induction was reduced to 3.8 fold. Moreover, the enhancement of the T3 induction by PGC-1β was eliminated upon deletion of the first intron. These data demonstrated that the first intron is critical for the stimulation of CPT-Iα by PGC-1β and T3. We also tested TRE X 2 SV40 luc which has two copies of an idealized TRE ligated in front of the enhancerless SV40 promoter driving the luciferase gene. PGC-1β stimulated this luciferase vector modestly and enhanced the T3 induction (Fig 1C).
We next investigated whether T3 treatment affected PGC-1β gene expression. Rat primary hepatocytes were treated with 100 nM T3 for 24 hours. RNA was isolated and PGC-1β mRNA abundance was measured using real time PCR. As shown in figure 2, there was a 3.0 ± 0.29 fold increase in the PGC-1β mRNA expression following T3 treatment. T3 addition increased the PGC-1β mRNA from 0.0017 pmoles per nmol 18S to 0.0058 pmoles. Previously, we showed that T3 increased CPT-Iα mRNA levels in rat primary hepatocytes indicating that both PGC-1 isoforms are regulated by T3 [7].
Figure 2. Thyroid hormone increases PGC-1β mRNA in hepatocytes.

Primary rat hepatocytes were treated with T3 at a concentration of 100 nM for 24 hrs. RNA was harvested and the abundance of PGC-1β mRNA was measured using real time PCR as described under “materials and methods”. The data are presented as fold induction of PGC-1β mRNA abundance by T3. The control samples were assigned a relative value of 1. The numbers represent the average ± SE from four independent hepatocyte preparations. The p< 0.01 for the T3 induction is indicated by the asterisk.
The next experiments were designed to localize the regions of the PGC-1β protein that are crucial for enhancing the T3 induction of CPT-Iα. The ability of PGC-1β to increase T3 responsiveness was examined in several gene reporter contexts. We constructed a series of mammalian expression vectors expressing different regions of PGC-1β ligated to the Gal4 DNA binding domain. The regions of PGC-1β which we evaluated were amino acids 1–1014, 1–170, 1–130, 1–80, 1–50, 171–1014, 171–350 and 351–1014 (Fig 3A). The constructs Gal4 PGC-1β 1–170 and Gal4 PGC-1β 1–130 were designed to include or exclude the LXXLL motif (amino acids 140–144) respectively. The LXXLL sequence is the most commonly utilized motif for interactions of coactivators with nuclear receptors [17]. First, HepG2 cells were transfected with Gal4X1 TREX1 luc which is a luciferase vector that has a binding site for the Gal4 DNA binding domain and a single T3 response element (TRE). Gal4 PGC-1β expressing different regions of the PGC-1β protein and an expression vector for TRβ were included in the transfection. Cells were treated with 100 nM T3 for 24 hours. In the absence of PGC-1β, T3 was unable to stimulate this vector through the single TRE (Fig 3B). The N-terminus of PGC-1β expressing amino acids 1–170 and 1–130 enhanced the T3 responsiveness 2.3 fold. Other regions of PGC-1β lacked the ability to increase T3 responsiveness. The full length Gal4-PGC-1β did not promote T3 responsiveness. We speculate that this may be due to the inhibitory domain of PGC-1 isoforms found between amino acids 200 to 400 in the protein as well as the low T3 responsiveness of this vector. In contrast, the full length PGC-1β does increase the T3 induction of the −4495/+1240 CPT-Iα-luc (Fig 3C) and the TREX2 SV40-luciferase vector (Fig 1C). These results suggest that the architecture of the TREX1 Gal4X1 vector is responsible for the lack of induction by the full length Gal4-PGC-1β. Significantly, removal of the LXXLL motif in PGC-1β 1–130 did not diminish its ability to enhance the T3 induction suggesting that the LXXLL motif is not crucial for the mediation of T3 responsiveness by PGC-1β. These observations contrast with our previous studies showing that the amino acids 1–140 of PGC-1α which do not contain the LXXLL motif were unable to enhance T3 responsiveness [26].
Figure 3. Amino terminus of PGC-1β mediates the T3 response.
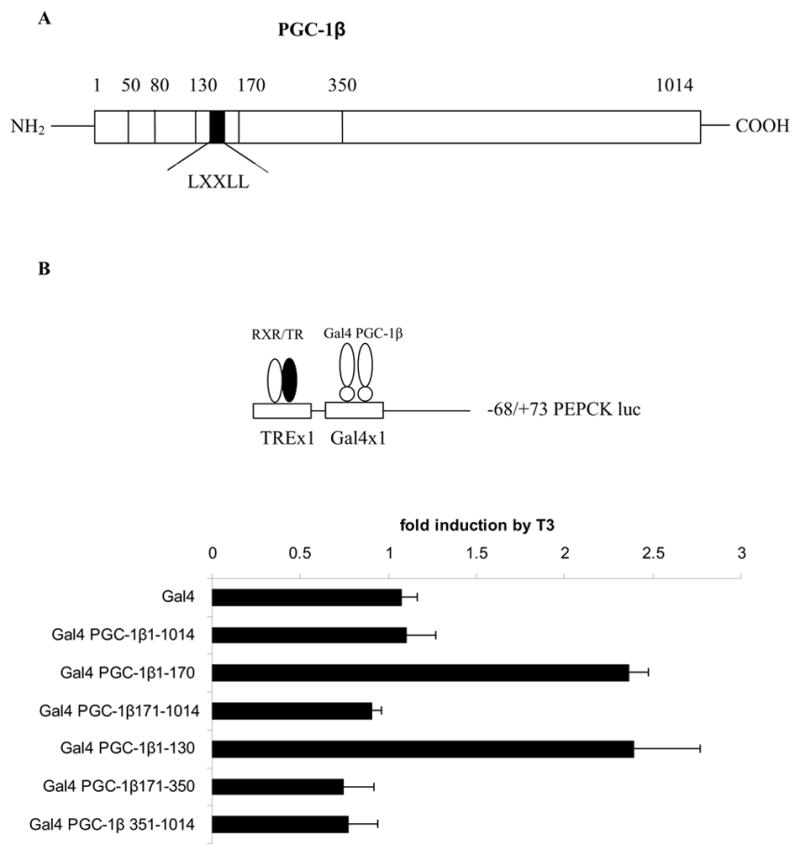

A, A model of the PGC-1β protein showing the relative position of the LXXLL motif is shown. B, HepG2 cells were transfected with TREX1 Gal4X1 PEPCK-luc (2 μg), CMV-TRβ (100 ng), various Gal4 PGC-1β constructs (1 μg) and TK-renilla (0.5 μg). The cells were treated with 100 nM T3 for 24 hrs. Fold induction of luciferase values by T3 was determined as described in the legend to figure 1. C, HepG2 cells were transfected with 2 μg of −4495/+1240 CPT-Iα luc, 1 μg of different Gal4 PGC-1β plasmids, 100 ng of CMV-TRβ and TK-Renilla. T3 was added at a concentration of 100 nM for 24 h. The cells were harvested and assessed for luciferase and Renilla activity. The data are expressed as induction of luciferase by T3 or PGC-1β relative to control. All transfections were performed in duplicate and repeated 4–6 times.
We also tested the PGC-1β vectors in the context of CPT-Iα promoter (Fig 3C). We cotransfected −4495/+1240 CPT-Iα luc along with the PGC-1β expression vectors and TRβ into HepG2 cells and measured T3 induction of luciferase. As seen in figure 3C, PGC-1β constructs 1–1014, 1–170 and 1–130 stimulated basal expression of CPT-Iα luc 4–5 fold. In addition, these vectors enhanced the T3 induction. However, constructs expressing the first 80 amino acids and the first 50 amino acids stimulated CPT-Iα luc weakly and did not enhance the T3 induction of CPT-Iα. These results demonstrated that the LXXLL motif in PGC-1β is not crucial for increasing T3 responsiveness of CPT-Iα. These data also suggest that amino acids between 80 and 130 induce basal CPT-Iα expression and are involved in the T3 responsiveness of CPT-Iα.
The next experiments examined whether PGC-1β and TRβ interacted physically. To conduct these experiments, we expressed GST-PGC-1β fusion proteins in E. coli and prepared S35 methionine labeled TRβ by in vitro translation. GST fusion proteins encoding the first 170 amino acids of PGC-1β and PGC-1α were allowed to interact with S35 TRβ in the presence or absence of T3. As shown in figure 4A, GST PGC-1β 1–170 binds TRβ and this binding is increased by the addition of T3. Similar results were seen for PGC-1α binding to TRβ (Fig 4A). To determine whether the LXXLL motif was essential for the interaction of PGC-1β with TRβ, we created a GST PGC-1β protein (1–130) in which the LXXLL motif was deleted. As shown in figure 4B, GST PGC-1β 1–170 interacts with TRβ and this binding is reduced but not lost with the shorter PGC-1β 1–130 construct. The PGC-1β 1–80 and 1–50 proteins did not interact with TRβ (data not shown). However in case of PGC-1α, the interaction with TRβ is lost with the disruption of the LXXLL motif [35]. Thus the interaction between PGC-1β and TRβ does not occur exclusively through the LXXLL motif whereas this motif is crucial for PGC-1α interaction with TRβ.
Figure 4. TRβ interacts with PGC-1β.

A, GST pulldown assay using equal amounts of GST, GST PGC-1β or GST PGC-1α and S35-methionine TRβ was conducted in the presence or absence of T3 (1 μM). After the pulldown using GST sepharose beads, proteins were run on a 12% SDS PAGE and detected autoradiographically. B, A GST pulldown assay using GST, GST PGC-1β or GST PGC-1α and His-TRβ in the presence of T3 was conducted. After the pulldown and electrophoresis, the TRβ was detected by Western blot analysis. C, Mammalian two hybrid assays were conducted by cotransfecting Gal4-TRβ and PGC-1β-VP16 vectors into HepG2 cells. The Gal4X5 SV40-luciferase was the reporter gene. T3 was added at a concentration of 10 nM. All transfections were repeated in duplicate five times.
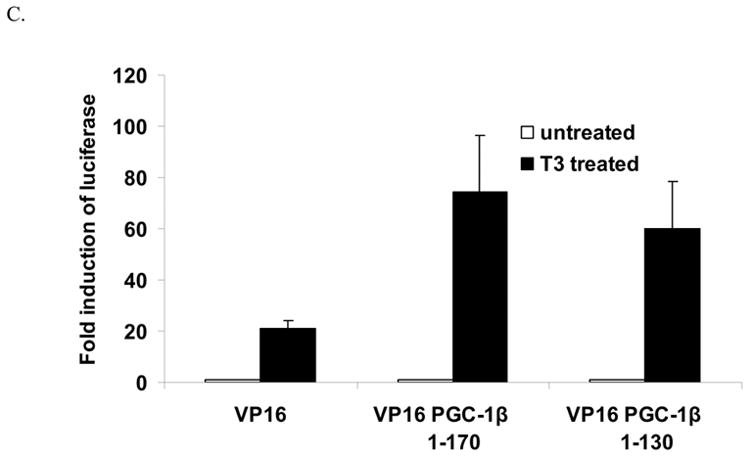
To further investigate the interactions of TRβ with PGC-1β, we utilized the mammalian two hybrid assay. The Gal4-TRβ construct was cotransfected with either VP16 or PGC-1β-VP16 expression vectors. Addition of T3 strongly stimulated the Gal4 reporter. Both the PGC-1β 1–170 and 1–130 enhanced expression of the luciferase gene indicating that the first 130 amino acids could interact with the TRβ (Fig 4C). These results support the in vitro association data.
Next, a chromatin immunoprecipitation (ChIP) assay was conducted to test whether PGC-1β is associated with the CPT-Iα gene in vivo. ChIP assays for PGC-1β were carried out using a transient transfection approach because a suitable PGC-1β antibody was not available. We transfected HepG2 cells with −4495/+1240 CPT-Iα and Flag PGC-1β using lipofectamine 2000. Cells were crosslinked with 1% formaldehyde and the ChIP assay performed. An antibody against the flag peptide was used to pulldown PGC-1β immune complexes. No antibody and normal rabbit IgG were used as controls. Immune complexes were collected using protein A agarose/salmon sperm DNA slurry and the complexes were extensively washed. We used primers to amplify regions of the CPT-Iα gene containing the TRE, the first intron or as a control an upstream promoter region. As can be seen in figure 5, Flag PGC-1β was directly associated with the CPT-Iα gene at both the TRE and the first intron. However, PGC-1β was not associated with the upstream promoter.
Figure 5. PGC-1β is associated with CPT-Iα gene in vivo.

HepG2 cells were transfected with 4 μg CPT-Iα luc and 4 μg of Flag tagged PGC-1β. ChIP assays were performed by crosslinking cells with 1% formaldehyde as described in the “Materials and Methods”. Antibodies against Flag or IgG were used for immunoprecipitations. Primers amplifying regions of the first intron, the CPT-Iα TRE, or the upstream region were used (Table II). The amplified PCR products were resolved on agarose gels.
Previously, we had reported that there was an increase in histone acetylation on the CPT-Iα gene following T3 administration [26]. Since PGC-1 proteins do not contain HAT activity, we wished to determine if other coactivators were associated with the CPT-Iα gene. We tested whether overexpression of CBP could enhance the T3 induction of the −4495/+1240 CPT-Iα luciferase vector. Cotransfection with CBP slightly elevated luciferase activity (1.7 ± 0.3) (Fig 6A). T3 alone induced the reporter 8.0 ± 0.9, while T3 and CBP together stimulated the promoter 14.8 ± 2.6 fold. T3 induced the −4495/+19 CPT-Iα luc reporter 3.6 ± 0.5 while the CBP and T3 elevated −4495/+19 CPT-Iα luc 5.6 ± 1.4 fold. These data suggest that CBP may participate in the regulation of CPT-Iα by T3.
Figure 6. CBP and PGC-1α are associated with the CPT-Iα gene in vivo.


A, HepG2 cells were transfected with CPT-Iα luciferase vectors, RSV-TRβ, TK-renilla and an expression vector for CBP as described in the legend to figure 1. Cells were treated with 100 nM T3 for 24 hours and then harvested as described in the materials and methods. All transfections were conducted four times in duplicate. B, Chromatin immunoprecipitation assays (ChIP) were conducted on primary rat hepatocytes. Hepatocytes were treated with 100 nM thyroid hormone (T3) for 6 hrs and then cross-linked with 1% formaldehyde as described in the materials and methods. Antibodies to PGC-1α, CBP or immunoglobin G (IgG) were used for immunoprecipitations. The amplified PCR products using primers for the first intron, the CPT-Iα TRE and upstream region of the CPT-Iα gene were resolved on an agarose gel. C, The association of PGC-1α and CBP with the CPT-Iα TRE and first intron were quantitated. These data are the average ± standard error of three independent ChIP assays.
To determine if CBP was associated with the CPT-Iα gene, ChIP assays were conducted on primary hepatocytes that had been treated with T3 for 6 hours. The data indicate that both PGC-1α and CBP are associated with the CPT-Iα gene both at the first intron and the TRE (Fig 6B). The association of PGC-1α with the TRE and intron was increased 2.4 and 1.9 fold respectively (Fig 6C). However, association of CBP with the CPT-Iα TRE and intron did not change (Fig 6C). We tested the ability of PGC-1β to interact with the carboxy terminus of CBP as previous studies indicated that the carboxy terminal region of CBP interacted with PGC-1α [25]. PGC-1β interacted with the same region of CBP as PGC-1α (data not shown). Overall, these data indicate that CBP is associated with the CPT-Iα gene and that PGC-1 isoforms may work in collaboration with other coactivators to mediate the T3 response.
Our final experiments examined the effect of PGC-1α or PGC-1β knock-down on CPT-Iα expression. SiRNA oligomers for PGC-1α or PGC-1β were ligated into the pSilencer expression vector. The pSilencer vectors were cotransfected into McA-RH7777 rat hepatoma cells with −4495/+1240 CPT-Iα luciferase and CMV-TRβ. McA-RH7777 cells express both PGC-1 isoforms (data not shown). The pSilencer vectors for PGC-1α and PGC-1β reduced the basal expression of CPT-Iα luciferase by 30% and 15% respectively (Fig 7A). The scrambled oligonucleotide control, pSilencer NC, had no effect on basal expression of CPT-Iα luciferase. The T3 induction of −4495/+1240 CPT-Iα luc was not affected by pSilencer for PGC-1β and was slightly reduced with pSilencer for PGC-1α. These data indicate that T3 can induce CPT-Iα with reduced PGC-1 and suggest that PGC-1 isoforms act to amplify the T3 induction. We did not test the endogenous CPT-Iα gene because the McA-RH7777 cells do not express TRs. To demonstrate that the pSilencer vectors were effective, we cotransfected the pSilencers with expression vectors for PGC-1α or PGC-1β. Both silencers specifically inhibited the expression of the target PGC-1 isoform (Fig 7B).
Figure 7. Knock-down of PGC-1 isoforms alters CPT-Iα luciferase expression.

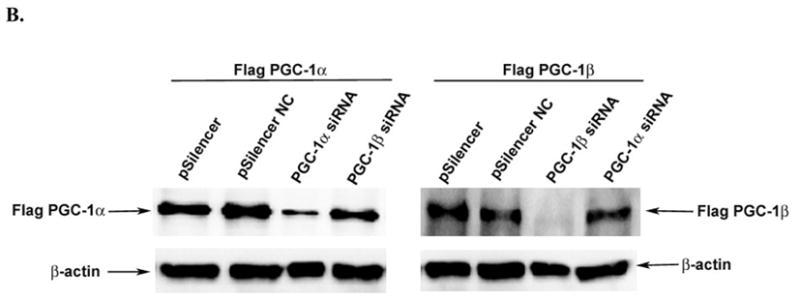
A. McA-RH7777 cells were transfected with 0.5 μg CPT-Iα luc, 100 ng CMV-TRβ and 1 μg of pSilencer, pSilencer with a scrambled control (NC) or pSilencer with siRNA for PGC-1α or PGC-1β essentially as described in Figure 1. All transfections were conducted in duplicate and repeated four times. The data are expressed as the average luciferase activity relative to the controls. The p< 0.01 for the siRNA knock-down is indicated by the asterisk. B. The pSilencer vectors were transfected into HepG2 cells with either Flag-PGC-1α or PGC-1β expression vectors. The expression of PGC-1α or PGC-1β was monitored by Western blot analysis with the Flag antibody (1:1000, Sigma).
Discussion
Thyroid hormone increases CPT-Iα gene expression and enzyme activity in the liver [5,7]. In the present study, we examined the role of PGC-1β in the basal and T3 regulation of CPT-Iα gene expression. We found that PGC-1β stimulates CPT-Iα expression and enhances the T3 responsiveness of the CPT-Iα gene. Previous studies from our laboratory demonstrated that PGC-1α regulates the PDK4 and CPT-Iα genes [26]. Although PGC-1β is similar in action to PGC-1α, we identified differences between the two isoforms with respect to the induction of the PDK4 gene and the mechanisms by which PGC-1β enhances the T3 response.
It has been shown that PGC-1α induces the PEPCK and G6Pase genes which are involved in hepatic gluconeogenesis [36]. PGC-1α interacts with hepatic nuclear factor 4 (HNF-4), the glucocorticoid receptor (GR), forkhead transcription factors (FoxO1) and COUP-TF to induce the PEPCK gene [36–38]. Spiegelman and colleagues found that PGC-1β does not interact with HNF-4 or FoxO1 [24]. It was suggested that their lack of interaction with PGC-1β was the reason that PGC-1β did not induce PEPCK. We have reported that HNF-4 will stimulate PDK4 expression but that HNF-4 does not recruit PGC-1α to the PDK4 gene [26]. The role of FoxO1 in PDK4 expression is controversial as different groups have suggested that FoxO1 has or does not have a role in PDK4 expression [39–41]. At this time, it cannot be determined why PGC-1β fails to induce the PDK4 as the mechanisms by which PGC-1α controls PDK4 expression in the liver are poorly understood. However, our results provide further support to the concept that PGC-1β does not modulate hepatic glucose or pyruvate metabolism.
Using microarray analysis, Weitzel et al found that PGC-1α and PGC-1β are among the few early induced genes in the liver following T3 administration to hypothyroid animals [42,43]. The authors postulated that the PGC-1 isoforms participate in the late-induced gene expression pattern in response to T3 treatment. They suggested that since many T3 responsive genes do not contain a consensus TRE in their promoters that T3 might stimulate these genes via the induction of PGC-1 [44]. Our results here show that T3 increases PGC-1β mRNA levels in rat primary hepatocytes, and previously we found that the PGC-1α isoform is induced by T3 [26]. The CPT-Iα gene has an unusual architecture in that two widely separated regions of CPT-Iα gene participate in the regulation by T3 including a TRE located approximately 3000 bp upstream of transcription start site and elements in the first intron [13]. Although the CPT-Iα gene contains a TRE, CPT-Iα may conform in part to the proposed model of Weitzel et al since there is no functional TRE in the first intron and PGC-1β stimulates through the intron. The transcription factors with which the PGC-1 coactivators interact in the first intron of CPT-Iα remain elusive.
PGC-1 coactivators have the classical LXXLL motifs through which they interact with the AF-2 domain of nuclear receptors [22]. Here, we have identified a significant difference between the PGC-1α and PGC-1β isoforms in their interactions with TRβ. The physical association between PGC-1β and TRβ, although reduced, is not lost upon deletion of the LXXLL motif indicating that LXXLL amino acids not absolutely required for this interaction. The LXXLL motif in PGC-1α is required for the interaction with TRβ [35]. The transient transfection studies in figure 3 demonstrate that the LXXLL motif in PGC-1β is not needed for the induction of CPT-Iα. The data suggest that the region of PGC-1β between amino acids 50 and 130 participates in the T3 effect. This result is markedly different from what is seen for PGC-1α for which LXXLL motif is required for inducing CPT-Iα and enhancing the T3 response [26]. In PGC-1β, there is an amphipathetic helical region leucine rich region between amino acids 92 and 96 that is required for the induction of gene expression [45]. It is possible that this motif is involved in the enhancement of T3 induction by PGC-1β. There are instances in which PGC-1α will interact with nuclear receptors independent of the LXXLL motif. For example, PGC-1α interacts with PPARγ through residues 200–400 of PGC-1α and this physical interaction is ligand independent [18].
Our results show that other coactivators especially CBP is associated with the CPT-Iα gene. We have found that PGC-1β interacts with the C-terminus of CBP (data not shown). PGC-1α also interacts with this region of CBP/p300 [25]. There is increased acetylation of histones on the CPT-Iα gene following T3 administration [26]. Since PGC-1 does not have HAT activity, CBP as well as other coactivators may provide this activity [18,46]. In addition, there are likely to be interactions between PGC-1 and other coactivators including the TRAP complex or SRC-1 [25,47].
Recently, Spiegelman and colleagues reported that short term high fat feeding increased the expression of PGC-1β and members of the sterol regulatory element binding proteins (SREBP) family of transcription factors which are key regulators of lipogenesis [48]. Moreover they demonstrated that PGC-1β is involved in the lipogenic actions of SREBP. These results suggest that PGC-1β promotes lipogenesis at least with short term high fat feeding and illuminate another pathway for regulating PGC-1β levels in the liver in response to external stimuli. Thus it is apparent that under different hormonal and dietary conditions, PGC-1β can promote fatty acid synthesis or fatty acid oxidation. Furthermore it has been recently shown that PGC-1β coactivates forkhead transcription factor Foxa2 in liver thereby stimulating fatty acid oxidation as well as increasing the fatty acid secretion as triacylglycerols [49]. Interestingly, it has been shown that hyperthyroidism is a condition in which both hepatic fatty acid oxidation and synthesis are elevated [50]. Our studies suggest that PGC-1β may provide a link to the induction of both processes in hyperthyroidism.
The overexpression of PGC-1 by adenoviral infection and transient transfection induced the CPT-Iα gene. In addition, the ChIP assays demonstrated that both PGC-1 isoforms are associated with the CPT-Iα gene. Consistent with these observations, the knock-down of either PGC-1 isoforms by siRNA decreased basal expression of CPT-Iα luciferase. Over-expression of PGC-1 also enhanced the T3 induction of CPT-Iα-luciferase. However, PGC-1α knock-down very modestly reduced the induction by T3. It is possible that the PGC-1 isoforms compensate for each other so that PGC-1α can cover for the loss of PGC-1β or visa versa in our knock-down experiments. Another interpretation of our results is that the PGC-1 proteins are amplifiers of the T3 response but that they are not essential for the T3 induction. T3 induces CPT-Iα via the binding of liganded TRβ and the recruitment of multiple coactivators. We have observed increased association of PGC-1α with the CPT-Iα gene in response to T3 administration (Fig. 6) [26]. PGC-1 proteins may function primarily to enhance the transcriptional response. A similar scenario has been proposed for the glucocorticoid induction of the PEPCK gene [51]. H4IIE hepatoma cells do not contain PGC-1α but the PEPCK gene is highly responsive to dexamethasone in these cells. Overexpression of PGC-1α enhanced the stimulation of PEPCK by dexamethasone leading to the suggestion that PGC-1α is a transcriptional amplifier [51]. In summary, we demonstrated that PGC-1 isoforms are induced in response to T3 treatment and that together T3 and PGC-1 stimulate CPT-Iα gene transcription. The T3 stimulation of gene expression in the liver may be mediated in part by stimulating the expression of PGC-1 isoforms.
Acknowledgments
We thank Dr. B. Spiegelman for the adenoviruses expressing PGC-1β and GFP. This work was supported by grants from the NIH DK-059368 (EAP), American Diabetes Association (EAP) and a VA merit award (MBE). Prabodh Sadana was supported by a fellowship from the American Heart Association.
Abbreviations
- CBP
CREB binding protein
- ChIP
chromatin immunoprecipitation assay
- CPT
carnitine palmitoyltransferase
- PGC-1
peroxisome proliferator activated receptor gamma coactivator
- SRC-1
steroid receptor coactivator-1
- SREBP
sterol regulatory element binding protein
- T3
thyroid hormone
- TR
thyroid hormone receptor
- TRAP
thyroid receptor associated proteins
- TRE
thyroid hormone response element
Footnotes
Publisher's Disclaimer: This is a PDF le of an unedited manuscript that has been accepted for publication. As a service to our customers we are providing this early version of the manuscript. The manuscript will undergo copyediting, typesetting, and review of the resulting proof before it is published in its nal citable form. Please note that during the production process errors may be discovered which could affect the content, and all legal disclaimers that apply to the journal pertain.
References
- 1.McGarry JD, Brown NF. The mitochondrial carnitine palmitoyltransferase system. From concept to molecular analysis. Eur J Biochem. 1997;244:1–14. doi: 10.1111/j.1432-1033.1997.00001.x. [DOI] [PubMed] [Google Scholar]
- 2.Cook GA, Park EA. Expression and regulation of carnitine palmitoyltransferase-Ialpha and -Ibeta genes. Am J Med Sci. 1999;318:43–8. doi: 10.1097/00000441-199907000-00007. [DOI] [PubMed] [Google Scholar]
- 3.Price N, van der Leij F, Jackson V, Corstorphine C, Thomson R, Sorensen A, Zammit V. A novel brain-expressed protein related to carnitine palmitoyltransferase I. Genomics. 2002;80:433–42. doi: 10.1006/geno.2002.6845. [DOI] [PubMed] [Google Scholar]
- 4.Jansen MS, Cook GA, Song S, Park EA. Thyroid hormone regulates carnitine palmitoyltransferase Ialpha gene expression through elements in the promoter and first intron. J Biol Chem. 2000;275:34989–97. doi: 10.1074/jbc.M001752200. [DOI] [PubMed] [Google Scholar]
- 5.Park EA, Mynatt RL, Cook GA, Kashfi K. Insulin regulates enzyme activity, malonyl-CoA sensitivity and mRNA abundance of hepatic carnitine palmitoyltransferase-I. Biochem J. 1995;310 (Pt 3):853–8. doi: 10.1042/bj3100853. [DOI] [PMC free article] [PubMed] [Google Scholar]
- 6.Lawrence JW, Li Y, Chen S, DeLuca JG, Berger JP, Umbenhauer DR, Moller DE, Zhou G. Differential gene regulation in human versus rodent hepatocytes by peroxisome proliferator-activated receptor (PPAR) alpha. PPAR alpha fails to induce peroxisome proliferation-associated genes in human cells independently of the level of receptor expresson. J Biol Chem. 2001;276:31521–7. doi: 10.1074/jbc.M103306200. [DOI] [PubMed] [Google Scholar]
- 7.Mynatt RL, Park EA, Thorngate FE, Das HK, Cook GA. Changes in carnitine palmitoyltransferase-I mRNA abundance produced by hyperthyroidism and hypothyroidism parallel changes in activity. Biochem Biophys Res Commun. 1994;201:932–7. doi: 10.1006/bbrc.1994.1791. [DOI] [PubMed] [Google Scholar]
- 8.Murthy MS, Pande SV. Malonyl-CoA binding site and the overt carnitine palmitoyltransferase activity reside on the opposite sides of the outer mitochondrial membrane. Proc Natl Acad Sci U S A. 1987;84:378–82. doi: 10.1073/pnas.84.2.378. [DOI] [PMC free article] [PubMed] [Google Scholar]
- 9.Jackson-Hayes L, Song S, Lavrentyev EN, Jansen MS, Hillgartner FB, Tian L, Wood PA, Cook GA, Park EA. A thyroid hormone response unit formed between the promoter and first intron of the carnitine palmitoyltransferase-Ialpha gene mediates the liver-specific induction by thyroid hormone. J Biol Chem. 2003;278:7964–72. doi: 10.1074/jbc.M211062200. [DOI] [PubMed] [Google Scholar]
- 10.Louet JF, Chatelain F, Decaux JF, Park EA, Kohl C, Pineau T, Girard J, Pegorier JP. Long-chain fatty acids regulate liver carnitine palmitoyltransferase I gene (L-CPT I) expression through a peroxisome-proliferator-activated receptor alpha (PPARalpha)-independent pathway. Biochem J. 2001;354:189–97. doi: 10.1042/0264-6021:3540189. [DOI] [PMC free article] [PubMed] [Google Scholar]
- 11.Zhang J, Lazar MA. The mechanism of action of thyroid hormones. Annu Rev Physiol. 2000;62:439–66. doi: 10.1146/annurev.physiol.62.1.439. [DOI] [PubMed] [Google Scholar]
- 12.Lazar MA. Thyroid hormone action: a binding contract. J Clin Invest. 2003;112:497–9. doi: 10.1172/JCI19479. [DOI] [PMC free article] [PubMed] [Google Scholar]
- 13.Park EA, Steffen ML, Song S, Park VM, Cook GA. Cloning and characterization of the promoter for the liver isoform of the rat carnitine palmitoyltransferase I (L-CPT I) gene. Biochem J. 1998;330 (Pt 1):217–24. doi: 10.1042/bj3300217. [DOI] [PMC free article] [PubMed] [Google Scholar]
- 14.Barrero MJ, Marrero PF, Haro D. Regulation of the rat liver carnitine palmitoyltransferase I gene transcription by thyroid hormone. Biochem Biophys Res Commun. 2000;279:81–8. doi: 10.1006/bbrc.2000.3893. [DOI] [PubMed] [Google Scholar]
- 15.Cook GA, Edwards TL, Jansen MS, Bahouth SW, Wilcox HG, Park EA. Differential regulation of carnitine palmitoyltransferase-I gene isoforms (CPT-I alpha and CPT-I beta) in the rat heart. J Mol Cell Cardiol. 2001;33:317–29. doi: 10.1006/jmcc.2000.1304. [DOI] [PubMed] [Google Scholar]
- 16.Rosenfeld MG, Lunyak VV, Glass CK. Sensors and signals: a coactivator/corepressor/epigenetic code for integrating signal-dependent programs of transcriptional response. Genes & Development. 2006;20:1405–28. doi: 10.1101/gad.1424806. [DOI] [PubMed] [Google Scholar]
- 17.Rosenfeld MG, Glass CK. Coregulator codes of transcriptional regulation by nuclear receptors. J Biol Chem. 2001;276:36865–8. doi: 10.1074/jbc.R100041200. [DOI] [PubMed] [Google Scholar]
- 18.Puigserver P, Wu Z, Park CW, Graves R, Wright M, Spiegelman BM. A cold-inducible coactivator of nuclear receptors linked to adaptive thermogenesis. Cell. 1998;92:829–39. doi: 10.1016/s0092-8674(00)81410-5. [DOI] [PubMed] [Google Scholar]
- 19.Puigserver P, Spiegelman BM. Peroxisome proliferator-activated receptor-gamma coactivator 1 alpha (PGC-1 alpha): transcriptional coactivator and metabolic regulator. Endocr Rev. 2003;24:78–90. doi: 10.1210/er.2002-0012. [DOI] [PubMed] [Google Scholar]
- 20.Lin J, Puigserver P, Donovan J, Tarr P, Spiegelman BM. Peroxisome proliferator-activated receptor gamma coactivator 1beta (PGC-1beta), a novel PGC-1-related transcription coactivator associated with host cell factor. J Biol Chem. 2002;277:1645–8. doi: 10.1074/jbc.C100631200. [DOI] [PubMed] [Google Scholar]
- 21.Knutti D, Kaul A, Kralli A. A tissue-specific coactivator of steroid receptors, identified in a functional genetic screen. Mol Cell Biol. 2000;20:2411–22. doi: 10.1128/mcb.20.7.2411-2422.2000. [DOI] [PMC free article] [PubMed] [Google Scholar]
- 22.Lin J, Handschin C, Spiegelman BM. Metabolic control through the PGC-1 family of transcription coactivators. Cell Metab. 2005;1:361–70. doi: 10.1016/j.cmet.2005.05.004. [DOI] [PubMed] [Google Scholar]
- 23.Puigserver P. Tissue-specific regulation of metabolic pathways through the transcriptional coactivator PGC1-alpha. Int J Obes (Lond) 2005;29(Suppl 1):S5–9. doi: 10.1038/sj.ijo.0802905. [DOI] [PubMed] [Google Scholar]
- 24.Lin J, Tarr PT, Yang R, Rhee J, Puigserver P, Newgard CB, Spiegelman BM. PGC-1beta in the regulation of hepatic glucose and energy metabolism. J Biol Chem. 2003;278:30843–8. doi: 10.1074/jbc.M303643200. [DOI] [PubMed] [Google Scholar]
- 25.Wallberg AE, Yamamura S, Malik S, Spiegelman BM, Roeder RG. Coordination of p300-mediated chromatin remodeling and TRAP/mediator function through coactivator PGC-1alpha. Mol Cell. 2003;12:1137–49. doi: 10.1016/s1097-2765(03)00391-5. [DOI] [PubMed] [Google Scholar]
- 26.Zhang Y, Ma K, Song S, Elam MB, Cook GA, Park EA. Peroxisomal proliferator-activated receptor-gamma coactivator-1 alpha (PGC-1 alpha) enhances the thyroid hormone induction of carnitine palmitoyltransferase I (CPT-I alpha) J Biol Chem. 2004;279:53963–71. doi: 10.1074/jbc.M406028200. [DOI] [PubMed] [Google Scholar]
- 27.Ma K, Zhang Y, Elam MB, Cook GA, Park EA. Cloning of the Rat Pyruvate Dehydrogenase Kinase 4 Gene Promoter: ACTIVATION OF PYRUVATE DEHYDROGENASE KINASE 4 BY THE PEROXISOME PROLIFERATOR-ACTIVATED RECEPTOR {gamma} COACTIVATOR. J Biol Chem. 2005;280:29525–32. doi: 10.1074/jbc.M502236200. [DOI] [PubMed] [Google Scholar]
- 28.Harris RA, Bowker-Kinley MM, Huang B, Wu P. Regulation of the activity of the pyruvate dehydrogenase complex. Adv Enzyme Regul. 2002;42:249–59. doi: 10.1016/s0065-2571(01)00061-9. [DOI] [PubMed] [Google Scholar]
- 29.Ma K, Zhang Y, Elam MB, Cook GA, Park EA. Cloning of the rat pyruvate dehydrogenase kinase 4 gene promoter: activation of pyruvate dehydrogenase kinase 4 by the peroxisome proliferator-activated receptor gamma coactivator. J Biol Chem. 2005;280:29525–32. doi: 10.1074/jbc.M502236200. [DOI] [PubMed] [Google Scholar]
- 30.Deng X, Cagen LM, Wilcox HG, Park EA, Raghow R, Elam MB. Regulation of the rat SREBP-1c promoter in primary rat hepatocytes. Biochem Biophys Res Commun. 2002;290:256–62. doi: 10.1006/bbrc.2001.6148. [DOI] [PubMed] [Google Scholar]
- 31.Gamble MS, Cook GA. Alteration of the apparent Ki of carnitine palmitoyltransferase for malonyl-CoA by the diabetic state and reversal by insulin. J Biol Chem. 1985;260:9516–9. [PubMed] [Google Scholar]
- 32.Bremer J. The effect of fasting on the activity of liver carnitine palmitoyltransferase and its inhibition by malonyl-CoA. Biochim Biophys Acta. 1981;665:628–31. doi: 10.1016/0005-2760(81)90282-4. [DOI] [PubMed] [Google Scholar]
- 33.Kashfi K, Cook GA. Proteinase treatment of intact hepatic mitochondria has differential effects on inhibition of carnitine palmitoyltransferase by different inhibitors. Biochem J. 1992;282 (Pt 3):909–14. doi: 10.1042/bj2820909. [DOI] [PMC free article] [PubMed] [Google Scholar]
- 34.Park EA, Song S, Olive M, Roesler WJ. CCAAT-enhancer-binding protein alpha (C/EBP alpha) is required for the thyroid hormone but not the retinoic acid induction of phosphoenolpyruvate carboxykinase (PEPCK) gene transcription. Biochem J. 1997;322 (Pt 1):343–9. doi: 10.1042/bj3220343. [DOI] [PMC free article] [PubMed] [Google Scholar]
- 35.Wu Y, Delerive P, Chin WW, Burris TP. Requirement of helix 1 and the AF-2 domain of the thyroid hormone receptor for coactivation by PGC-1. J Biol Chem. 2002;277:8898–905. doi: 10.1074/jbc.M110761200. [DOI] [PubMed] [Google Scholar]
- 36.Yoon JC, Puigserver P, Chen G, Donovan J, Wu Z, Rhee J, Adelmant G, Stafford J, Kahn CR, Granner DK, Newgard CB, Spiegelman BM. Control of hepatic gluconeogenesis through the transcriptional coactivator PGC-1. Nature. 2001;413:131–8. doi: 10.1038/35093050. [DOI] [PubMed] [Google Scholar]
- 37.Puigserver P, Rhee J, Donovan J, Walkey CJ, Yoon JC, Oriente F, Kitamura Y, Altomonte J, Dong H, Accili D, Spiegelman BM. Insulin-regulated hepatic gluconeogenesis through FOXO1-PGC-1alpha interaction. Nature. 2003;423:550–5. doi: 10.1038/nature01667. [DOI] [PubMed] [Google Scholar]
- 38.Rhee J, Inoue Y, Yoon JC, Puigserver P, Fan M, Gonzalez FJ, Spiegelman BM. Regulation of hepatic fasting response by PPARgamma coactivator-1alpha (PGC-1): requirement for hepatocyte nuclear factor 4alpha in gluconeogenesis. Proc Natl Acad Sci U S A. 2003;100:4012–7. doi: 10.1073/pnas.0730870100. [DOI] [PMC free article] [PubMed] [Google Scholar]
- 39.Furuyama T, Kitayama K, Yamashita H, Mori N. Forkhead transcription factor FOXO1 (FKHR)-dependent induction of PDK4 gene expression in skeletal muscle during energy deprivation. Biochem J. 2003;375:365–71. doi: 10.1042/BJ20030022. [DOI] [PMC free article] [PubMed] [Google Scholar]
- 40.Wende AR, Huss JM, Schaeffer PJ, Giguere V, Kelly DP. PGC-1alpha coactivates PDK4 gene expression via the orphan nuclear receptor ERRalpha: a mechanism for transcriptional control of muscle glucose metabolism. Mol Cell Biol. 2005;25:10684–94. doi: 10.1128/MCB.25.24.10684-10694.2005. [DOI] [PMC free article] [PubMed] [Google Scholar]
- 41.Kwon HS, Huang B, Unterman TG, Harris RA. Protein kinase B-alpha inhibits human pyruvate dehydrogenase kinase-4 gene induction by dexamethasone through inactivation of FOXO transcription factors. Diabetes. 2004;53:899–910. doi: 10.2337/diabetes.53.4.899. [DOI] [PubMed] [Google Scholar]
- 42.Weitzel JM, Hamann S, Jauk M, Lacey M, Filbry A, Radtke C, Iwen KA, Kutz S, Harneit A, Lizardi PM, Seitz HJ. Hepatic gene expression patterns in thyroid hormone-treated hypothyroid rats. J Mol Endocrinol. 2003;31:291–303. doi: 10.1677/jme.0.0310291. [DOI] [PubMed] [Google Scholar]
- 43.Weitzel JM, Radtke C, Seitz HJ. Two thyroid hormone-mediated gene expression patterns in vivo identified by cDNA expression arrays in rat. Nucleic Acids Res. 2001;29:5148–55. doi: 10.1093/nar/29.24.5148. [DOI] [PMC free article] [PubMed] [Google Scholar]
- 44.Weitzel JM, Iwen KA, Seitz HJ. Regulation of mitochondrial biogenesis by thyroid hormone. Exp Physiol. 2003;88:121–8. doi: 10.1113/eph8802506. [DOI] [PubMed] [Google Scholar]
- 45.Kressler D, Schreiber SN, Knutti D, Kralli A. The PGC-1-related protein PERC is a selective coactivator of estrogen receptor alpha. J Biol Chem. 2002;277:13918–25. doi: 10.1074/jbc.M201134200. [DOI] [PubMed] [Google Scholar]
- 46.Puigserver P, Adelmant G, Wu Z, Fan M, Xu J, O’Malley B, Spiegelman BM. Activation of PPARgamma coactivator-1 through transcription factor docking. Science. 1999;286:1368–71. doi: 10.1126/science.286.5443.1368. [DOI] [PubMed] [Google Scholar]
- 47.Song S, Zhang Y, Ma K, Jackson-Hayes L, Lavrentyev EN, Cook GA, Elam MB, Park EA. Peroxisomal proliferator activated receptor gamma coactivator (PGC-1alpha) stimulates carnitine palmitoyltransferase I (CPT-Ialpha) through the first intron. Biochim Biophys Acta. 2004;1679:164–73. doi: 10.1016/j.bbaexp.2004.06.006. [DOI] [PubMed] [Google Scholar]
- 48.Lin J, Yang R, Tarr PT, Wu PH, Handschin C, Li S, Yang W, Pei L, Uldry M, Tontonoz P, Newgard CB, Spiegelman BM. Hyperlipidemic effects of dietary saturated fats mediated through PGC-1beta coactivation of SREBP. Cell. 2005;120:261–73. doi: 10.1016/j.cell.2004.11.043. [DOI] [PubMed] [Google Scholar]
- 49.Wolfrum C, Stoffel M. Coactivation of Foxa2 through Pgc-1beta promotes liver fatty acid oxidation and triglyceride/VLDL secretion. Cell Metab. 2006;3:99–110. doi: 10.1016/j.cmet.2006.01.001. [DOI] [PubMed] [Google Scholar]
- 50.Castellani LW, Wilcox HC, Heimberg M. Relationships between fatty acid synthesis and lipid secretion in the isolated perfused rat liver: effects of hyperthyroidism, glucose and oleate. Biochim Biophys Acta. 1991;1086:197–208. doi: 10.1016/0005-2760(91)90008-6. [DOI] [PubMed] [Google Scholar]
- 51.Herzog B, Hall RK, Wang XL, Waltner-Law M, Granner DK. Peroxisome proliferator-activated receptor gamma coactivator-1alpha, as a transcription amplifier, is not essential for basal and hormone-induced phosphoenolpyruvate carboxykinase gene expression. Mol Endocrinol. 2004;18:807–19. doi: 10.1210/me.2003-0384. [DOI] [PubMed] [Google Scholar]