

Abstract
Granulation tissue formation is a critical step in infarct repair, however, the kinetics of cell replication and the molecules that regulate this process are poorly understood. In uninjured mouse hearts and at 2 days post-infarction, very little DNA synthesis (measured by incorporation of a BrdU pulse) was detected in any cell type. Four days after permanent coronary occlusion, the rates of myofibroblast (smooth muscle α-actin and BrdU double-positive) and endothelial cell (CD31 and BrdU double-positive) proliferation were 15.4 ± 1.1% and 2.9 ± 0.5%, respectively. Most proliferating cells were located at the interface of the infarct and viable tissue. By 1 week, fibroblast and endothelial cell proliferation declined to 4.1 ± 0.6% and 0.7 ± 0.1%, respectively. In the 2-week infarct, the remaining necrosis had been phagocytosed, and fibroblast and endothelial cell proliferation were <0.5%. Although leukocytes were abundant throughout infarct repair, no significant proliferation was detected at any time in cells expressing CD45 or mac-3. Infarct size at 4 days was 38 ± 5% of the left ventricle and contracted to 20 ± 4% by 4 weeks. After 4 days, the chamber dilated to four times that of the control hearts and remained so for the duration of the time course. The vascular density (per mm2) declined from 3643 ± 82 in control hearts to 2716 ± 197 at 1 week and 1010 ± 47 at 4 weeks post-myocardial infarction (MI). The average percent area occupied by vessels did not change significantly between the groups but the area/vessel (μm2) increased from 14.1 ± 0.3 in control hearts to 16.9 ± 1.9 at 1 week and 38.7 ± 7.9 at 4 weeks post-MI. These data indicate that mitogens for fibroblasts and endothelial cells peak within 4 days of infarction in the mouse heart. This provides the basis for identifying the responsible molecules and developing strategies to alter wound repair and improve cardiac function.
Following coronary artery occlusion, extensive cardiomyocyte necrosis and remodeling of the ventricular wall occurs. Macrophages phagocytose the necrotic myocardium, and, concomitantly, myofibroblasts and endothelial cells proliferate and migrate into the infarct zone. 1-4 The dead tissue is thus replaced with granulation tissue, a provisional tissue with a matrix rich in proteoglycans and matricellular proteins such as osteopontin 5 and fibronectin. 6-8 As repair proceeds, the myofibroblasts deposit a network of collagen, the provisional matrix is resorbed, and there is extensive apoptosis of granulation tissue cells resulting in a thin, hypocellular scar. 9,10 Progressive ventricular wall thinning and chamber dilation (ventricular remodeling) are associated with increased incidence of congestive heart failure, aneurysm formation, and mortality. 11-15
Although formation of granulation tissue is a critical stage of infarct repair, we know surprisingly little about how this process is regulated. Given the importance of myofibroblasts and endothelial cells in forming granulation tissue, we are interested in identifying the mitogens that drive their proliferation. However, before mitogenic factors can be identified, it is necessary to understand when these cells proliferate after myocardial infarction. Therefore, to assess the kinetics of wound healing in the infarcted heart, we quantified myofibroblast and endothelial cell proliferation at discrete time points in a chronic murine model of myocardial infarction induced by permanent occlusion of the left anterior descending (LAD) coronary artery. Additionally, based on their location at different stages of repair, we described the migratory patterns of these cells. Finally, we morphometrically assessed the geometrical reconfiguration and vascular changes of the left ventricle during the transformation from necrosis to scar to compare and contrast our study with previous studies and other models of infarct repair.
Materials and Methods
Animals
C57BL/6J mice were purchased from Jackson Laboratories (Bar Harbor, ME). The procedures for the care and treatment of mice were followed according to those set by the University of Washington Animal Research Committee guidelines.
Surgical Procedure
Forty-two male C57BL/6J mice (20 to 30 grams; Jackson Laboratories) were anesthetized with an i.p. injection of 20 μl/g body weight Avertin (20 mg/ml). The surgical procedure has been described in detail elsewhere. 16,17 Briefly, using a dissecting microscope and a bright fiberoptic light source, the mouse was mechanically ventilated, a thoracotomy was aseptically performed, and the left anterior descending coronary artery was ligated. Control animals underwent the same procedure without ligation. The animal was permitted to recover sternal recumbency in a heated chamber before being returned to the vivarium. The survival rate was 92%.
Animals were sacrificed at 2 days, 4 days, 1 week, 2 weeks, and 4 weeks, with an i.p. injection of pentobarbital (n = 5 to 12 per group; see Table 1 ▶ ). One hour before sacrifice, each mouse was given a 0.5 ml i.p. injection of BrdU (5 mg/ml) to mark proliferating cells. The heart and a segment of small intestine (a cell proliferation control) were briefly rinsed in phosphate-buffered saline (PBS) and immersion fixed in methyl Carnoy’s solution (60% methanol, 30% chloroform, and 10% glacial acetic acid; Roche, Indianapolis, IN) for CD45 and smooth muscle α-actin staining, or zinc fixative for CD31 or mac-3 staining as previously described. 17 After fixation, the heart was transversely sectioned into four slices of equal thickness, processed, and embedded in paraffin by standard methods. Blocks were then sliced at 5-μm thickness and mounted on positively charged Labcraft glass slides. Immunostaining and standard histological (hemtaoxylin and eosin and Masson trichrome) procedures were performed.
Table 1.
Morphometrical Analyses
| Group | LV area (mm2) | Infarct size (% LV area) | Chamber area (mm2) | Granulation tissue (% of infarct area) | Necrosis (% of infarct area) | Scar (% of infarct area) | Septal wall thickness (mm) | Anterior wall thickness (mm) | Expansion index (LV cavity area/LV area) × (septum/scar thickness) |
|---|---|---|---|---|---|---|---|---|---|
| Control (n = 5) | 2.2 ± 0.2 | — | 0.2 ± 0.1 | — | — | — | 0.8 ± 0.04 | 0.91 ± 0.06† | 0.3 ± 0.2 |
| 4 day (n = 12) | 2.2 ± 0.2 | 38 ± 5 | 0.7 ± 0.1* | 73 ± 3 | 26 ± 3 | 0 | 0.5 ± 0.03 | 0.28 ± 0.02* | 0.88 ± 0.22 |
| 1 week (n = 9) | 1.8 ± 0.2 | 27 ± 4† | 0.5 ± 0.1* | 95 ± 1 | 5 ± 1 | 0 | 0.4 ± 0.06 | 0.17 ± 0.02*† | 1.14 ± 0.2 |
| 2 week (n = 7) | 2.0 ± 0.3 | 32 ± 5† | 0.7 ± 0.1* | 0 | 0 | 100 | 0.56 ± 0.09 | 0.21 ± 0.03*† | 1.13 ± 0.22 |
| 4 week (n = 8) | 2.6 ± 0.3 | 20 ± 4† | 0.9 ± 0.1* | 0 | 0 | 100 | 0.6 ± 0.06 | 0.16 ± 0.02*† | 1.76 ± 0.37* |
*different from control;
†different from 4 day.
Immunostaining
Slide-mounted tissue sections were deparaffinized by rinsing 2 × 5 minutes in xylene followed by 2 × 5 minutes 100% ethanol rinses. Endogenous peroxidases were quenched in 0.3% H2O2 in methanol for 20 minutes. After rinsing 3 × 5 minutes in PBS, slides were incubated overnight at 4°C with either anti-CD45 (rat anti-mouse monoclonal; PharMingen, #550539; 1:2000) for leukocytes, mac-3 (rat anti-mouse monoclonal antibody for macrophages; Pharmingen, San Diego, CA, #550292; 1:1000); anti-smooth muscle α-actin (peroxidase-conjugated mouse anti-human monoclonal; DAKO, Carpinteria, CA, U7033) for myofibroblasts, or anti-CD31 (biotinylated rat anti-mouse monoclonal; PharMingen, #553371; 1:2000) or anti-thrombomodulin (a gift from Steve Kennel, Oak Ridge National Laboratory; rat anti-mouse 1:100) for endothelial cells. 17 Following incubation with anti-CD45 or anti-mac-3, or anti-thrombomodulin, slides were rinsed and incubated for 1 hour with a goat anti-rat secondary (1:500 BA-9400; Vector Labs, Burlingame, CA). After rinsing with PBS 3 × 5 minutes, these slides as well as those incubated with anti-CD31 were incubated with ABC solution (Vector) for 30 minutes. After 3 × 5 minutes rinses in PBS, the reaction product was visualized with DAB (Vector, SK-4100). For BrdU double-labeling of fibroblasts, endothelial cells, or leukocytes, slides were immersed in 1.5N HCl at 37°C for 15 minutes, briefly rinsed in distilled water, placed in borax buffer (0.1 mol/L; pH 8.5) for 2 × 5 minutes, rinsed in PBS, and incubated with peroxidase-conjugated anti-BrdU (Roche, #1585860; 1:25) overnight at 4°C. The reaction product was visualized with Vector VIP (Vector, SK-4600). All slides were subsequently counter-stained with methyl green, dehydrated, and cover-slipped. The time point of sections on the slide was concealed and the slides were randomized. Proliferating cells were counted on the microscope using a 10 × 10 grid reticle eyepiece and surveying random fields from the border zone of one end of the infarct to the other until a total of 500 cells had been counted. Fibroblasts were counted at ×400 and endothelial cells were counted at ×600. Numbers were expressed as the percentage of double-labeled (both BrdU and phenotype marker-positive) cells in 500 CD31-, SM-α-actin-, or CD45-positive cells ± SEM.
Morphometrical Analyses
Photographs of four hematoxylin and eosin-stained sections per heart were taken at ×20 (so as to include the entire section of the heart) using a SPOT RT digital camera and the SPOT imaging software (Diagnostic Instruments, Sterling Heights, MI). The images were randomized and the investigator was blinded to the time point. Scion Imaging software (Scion Corporation, Frederick, MD) was calibrated with a micrometer (Olympus, Melville, NY) and used to trace the areas of the left ventricle, the infarct zone, and areas of necrosis, granulation tissue, and scar. Infarct thickness was measured at the thinnest point and septal wall thickness was measured by taking the average length of three segments along radii from the center of the left ventricle through the septum. 18
For the vessel number and area, four images (two epicardial, two endocardial) of the infarct zones of 1-week and 4-week hearts stained with CD31 were taken at ×40. The number of vessels was counted in each field, the vessel areas were measured using Scion Imaging software, and both were expressed as measures per unit area. The measurements were exported into Excel for analysis. Expansion index (EI) was calculated with the formula: EI = (LV cavity/LV area) × (septum/scar thickness). 11,19,20
Statistics
Correlation and regression analyses were done to describe relationships between morphometrical parameters. Statistical significance between groups was determined by analysis of variance followed by Bonferroni post-hoc analyses. All statistics were performed using Instat and significance levels were P < 0.05.
Results
Histology
Hematoxylin and eosin-stained sections at each time point are shown in Figure 1, A to E ▶ (top row; ×20) and the Masson trichrome stains in Figure 1, F-J ▶ (bottom row; ×200). The control heart (Figure 1, A and F) ▶ showed the arrangement of normal, healthy myocytes in the myocardium. In the 4-day infarct (Figure 1, B and G) ▶ there was dramatic infiltration of inflammatory cells and large area of necrosis (note the myocytes in the dark red region in Figure 1G ▶ have no nuclei). Focal hemorrhage was observed in the majority of 4-day hearts post-myocardial infarction (MI), and occasional contraction band necrosis was observed at the infarct margins. There was a rim of viable myocardium in the subendocardium and subepicardium, and there was a marked decrease in ventricular wall thickness and increase in chamber area.
Figure 1.

Histology of infarct repair. Hematoxylin and eosin stains (top row; ×20; bar, 0.5 mm) and Masson trichrome (bottom row; ×200; bar, 100 μm; pink, viable tissue; red, necrosis; blue, collagen) on tissues from control, 4-day, 1-week, 2-week, and 4-week murine infarcts. These photos demonstrate the intense inflammatory response that occurs at 4 days, the encapsulation of necrosis (arrowheads) by granulation tissue (*), the progressive thinning of the ventricular wall, ventricular chamber dilation, progressive collagen (blue) deposition, and subendocardial sparing (arrows).
By 1 week post-infarction (Figure 1, C and H) ▶ , there was extensive formation of granulation tissue, containing many new vascular channels. There was some residual necrosis localized toward the center of the infarct zone. In the 2-week infarct (Figure 1, D and I) ▶ , there was a definite interface between non-infarcted myocardium and immature scar. The Masson trichrome stain showed an increase in collagen deposition and organization of collagen fibrils (blue regions). Along the perimeter of the thin infarct remained a continuous band of subendocardial sparing, likely due to the proximity to the oxygenated blood in the ventricle. Surviving subepicardial tissue in the infarct region was usually observed in association with large vessels and was often discontinuous, possibly as a consequence of infarct expansion. By this time, any remaining necrosis had been phagocytosed, and thus contributed to further thinning of the ventricular wall. This was in sharp contrast to the viable portions of the hypertrophied ventricular wall. Collagen accumulation increased from 1 week to 4 weeks. In the 4-week infarct (Figure 1, E and J) ▶ , now a discrete scar, we observed dramatic thinning of the ventricular wall, and the collagen fibers in the hypocellular scar were organized in parallel.
Leukocytes
Pilot studies showed that the optimal markers for leukocytes in the infarct were CD45 (pan-leukocyte) and mac-3 (macrophage-specific). Other markers that were screened are listed in a supplemental table available on-line. Control hearts showed only rare CD45-positive leukocytes outside of blood vessels (Figure 2A) ▶ . Some CD45-positive cells were observed at the border zone of the infarct at 2 days (data not shown), but by 4 days, they were widespread (Figure 2, B and C) ▶ and encapsulated the infarct zone as they entered from the viable regions. At 1 and 2 weeks post-MI a large number of CD45-positive cells remained as they penetrated through the necrotic myocardium and phagocytosed the dead myocytes and other cellular debris. By 4 weeks, the density of CD45-positive cells declined, but they were still abundant in the wound. Representative micrographs showing CD45 and BrdU double-labeling from a control heart, and hearts 4 days, 1 week, and 4 weeks post-MI are shown in Figure 2, A to E ▶ . CD45-positive leukocytes did not proliferate to any significant extent within the infarcted myocardium (Figure 2C ▶ and Figure 3 ▶ )). Although the same pattern and intensity of staining was obtained with the mac-3 antibody, the deposition of the chromagen was not as clear as that obtained with the CD45 (please refer to the on-line supplement). Neutrophils were commonly observed at 2 and only rarely 4 days post-MI and were not present at any later time points.
Figure 2.
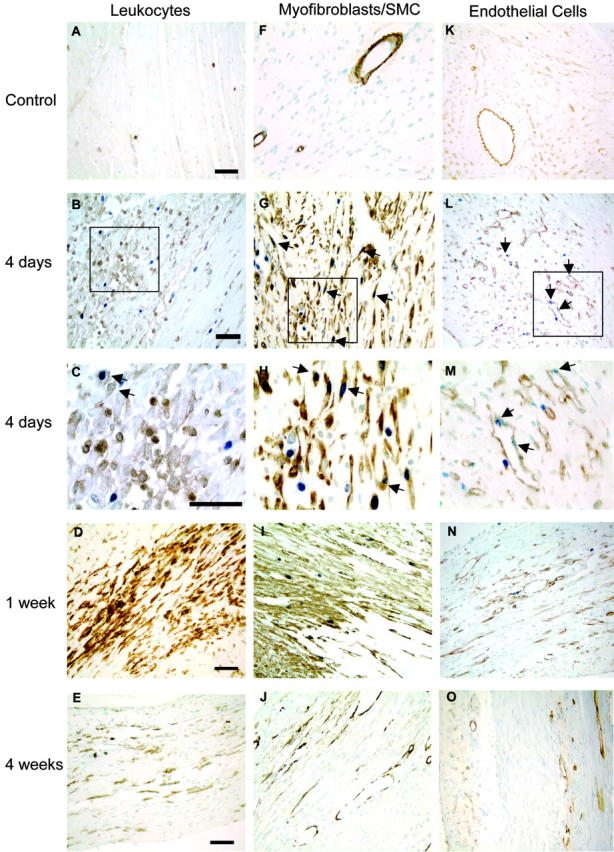
Immunohistochemical analysis of proliferation in macrophages, myofibroblasts, and endothelial cells. In the left column, A–E are representative micrographs of CD45/BrdU staining, which highlight the extensive leukocyte infiltration throughout the repair process. The field in C shows two CD45-BrdU-positive cells highlighted in the upper left corner to illustrate the presence of these rare double-positive cells. In the middle column, F–J show the myofibroblast proliferation and migration pattern demonstrated by combined smooth muscle α-actin and BrdU staining. After 1 week, myofibroblast proliferation slows greatly, and the α-actin signal disappears from the interstitial cells, probably as a combined result of down-regulation of expression and apoptosis. In the right column, K–O, endothelial proliferation is illustrated by combined CD31 and BrdU staining. The peak of endothelial cell proliferation also occurs at 4 days. Vascularization of the wound occurs at 1 to 2 weeks, but vascular channel density appears to decline by 4 weeks. Examples of proliferating cells are marked by arrows. Original magnification, ×1000 for B, G, and L and ×400 for the other micrographs. Bars represent 50μm in each row.
Figure 3.

Cell proliferation in murine infarcts. Infarcts show virtually no proliferation at 2 days. Proliferation shows an abrupt peak at 4 days post-MI, decreases at 1 week, and effectively ceases by 14 days. Mice received injection of BrdU 1 hour before sacrifice to mark proliferating cells. The percentage of proliferating cells was determined by counting the number of BrdU-positive cells out of 500 cells of each type per heart. At 4 days, 15.4 ± 0.9% of myofibroblasts were BrdU-positive, declining to 4.1 ± 1.1% at 1 week. Endothelial cells were 3 ± 0.1% BrdU-positive at 4 days and 0.7 ± 0.5% at 1 week. Macrophages did not proliferate significantly within the heart at any time.
Myofibroblast Proliferation
Cell proliferation was studied by administering a bolus of BrdU 1 hour before sacrifice. Proliferating myofibroblasts were detected by double-labeling with SM-α-actin and BrdU. The rate of fibroblast proliferation is expressed as a percentage of SM-α-actin/BrdU double-positive cells not associated with a vessel. Pilot studies showed that the optimal marker for infarct myfibroblasts was smooth muscle-α-actin. In normal tissues, SM-α-actin is exclusively expressed by vascular smooth muscle cells (Figure 2F) ▶ . In injured tissues however, activated myofibroblasts also express SM-α-actin. 21,22 We also tested antibodies to α8-integrin, 23 prolyl-4-hydroxylase 24 (Chemicon MAB2073) and human procollagen I 25 (Chemicon MAB1912) and were unable to achieve satisfactory staining in frozen or paraffin sections in any fixative with any antigen retrieval protocol. At 2 days post-infarction, very little BrdU incorporation was detected in any cell type (not shown). Myofibroblast proliferation peaked at 15.4 ± 1.1% after 4 days, declined to 4.1 ± 0.6% after 1 week, and progressively slowed to 0.2 ± 0.6% after 2 weeks and 0.03 ± 0.1% after 4 weeks. The photos in Figure 2, F to J ▶ are representative sections of a control heart and infarct zones at 4 days, 1 week, and 4 weeks post-MI. Myofibroblasts appeared to be replicating at the border of the infarct zone and migrating inward at 4 days, more centrally at 1 week (Figure 2H) ▶ , sporadically at 2 weeks (not shown), and had ceased by 4 weeks (Figure 2J) ▶ . At 2 to 4 weeks post-MI, SM-α-actin-positive cells were once again largely restricted to the vessel wall, likely due to a combination of apoptosis and down-regulation of α-actin in fibroblasts.
Endothelial Cell Proliferation
To determine the fraction of proliferating endothelial cells in mouse heart, CD31/BrdU double-positive cells were counted. Endothelial cell proliferation was 2.9 ± 0.1% after 4 days, 0.7 ± 0.5% after 1 week, 0.2 ± 0.1% after 2 weeks, and 0.4 ± 0.3% after 4 weeks. Figure 2, K to O ▶ shows representative endothelial cell staining in control hearts and infarct zones at 4 days, 1 week, and 4 weeks post-MI. Similar to the trend observed with myofibroblasts, the bulk of endothelial cell replication occurred at 4 days, declined at 1 week, and ceased by 2 weeks (Figure 3) ▶ . Due to the relatively low number of proliferating cells, an anatomical pattern of proliferation and migration was not evident. Note the decreased vascularity of the mature scar at 4 weeks post-MI compared to granulation tissue at 4 and 7 days.
On a subset of 4-day infarcted hearts (n = 3), we visualized proliferating endothelial cells with anti-thrombomodulin and BrdU and counted these cells to corroborate the results obtained with CD31/BrdU. The individual counts fell within the range observed with CD31-labeling. The rate of endothelial proliferation using thrombomodulin/BrdU was 2.3 ± 0.3% which is comparable to the rate of 2.9 ± 0.5% determined with CD31/BrdU.
Morphometry
Morphometrical results are presented in Table 1 ▶ . There was no significant difference in the total area of the left ventricle (wall and cavity) between the time points studied. The infarct size was 38 ± 5% of the left ventricle at 4 days, consisting of 73 ± 3% granulation tissue and 26 ± 3% necrosis. After 1 week, the infarct size decreased to 27 ± 4% of the left ventricle and the majority of the infarct zone was composed of granulation tissue (95 ± 1%) with only 5 ± 1% residual necrosis. By 2 weeks, 32 ± 5% of the left ventricle was young scar tissue, and by 4 weeks post-MI, the scar contracted to 20 ± 4% of the left ventricle. Figure 4 ▶ summarizes the changes in infarct composition that occur during healing, highlighting the three distinct stages of repair and speed of infarct resolution observed in the mouse heart. The ventricular wall 4 days post-MI was one-third of the original thickness and continued to thin up to 1 week to almost one-sixth of the original thickness. Concomitantly, the area of the left ventricular chamber more than tripled by 4 days after infarction compared to control, and this degree of dilation persisted throughout the time course. There was a gradual increase in expansion index (EI) over the time course with statistical significance at 4 weeks.
Figure 4.

Time course of changes in infarct composition during repair. This graph shows the duration and relative composition of the stages of wound repair. The majority of necrosis was phagocytosed 1 week post-MI. Granulation tissue formation began at 4 days, peaks at 1 week, and was resolved by 2 weeks post-MI. Scar tissue formation began 1 week post-MI and was complete by 2 weeks.
Between 1 week and 4 weeks, the number of vessels per mm2 in the infarct area decreased 25% from 3643 ± 82 in control hearts to 2716 ± 197 at 1 week and almost threefold from 1 week to 1010 ± 47 at 4 weeks (Figure 5A) ▶ . Interestingly, the average vessel area per μm2 remained unchanged (Figure 5B) ▶ , due to an increase in the area per vessel (μm2) at 4 weeks (38.66 ± 7.87) as compared with 1 week (16.93 ± 1.87) and control hearts (14.08 ± 0.27) (Figure 5C) ▶ .
Figure 5.
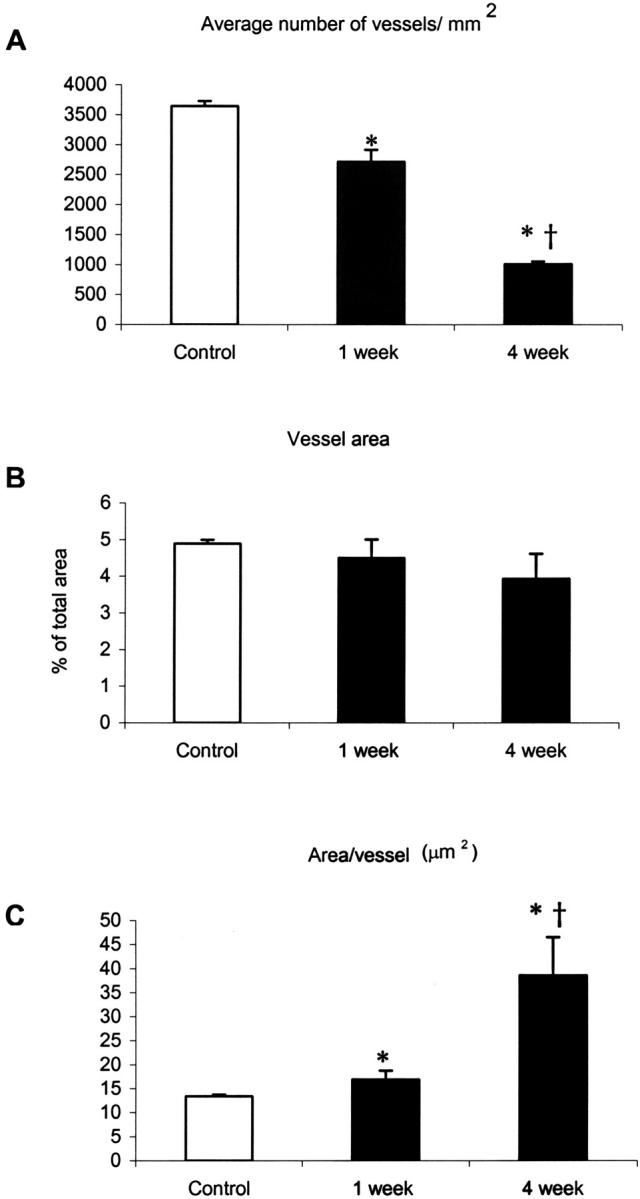
Vessel density and vessel area in control, and 1- and 4-week infarcts. Vessel density (per mm2) declined approximately 25% from control to 1 week and threefold from 1 week to 4 weeks in the infarct zone (A). The average area of all vessels combined per μm2 did not change (B). The average area of a vessel in the infarct at 4 weeks was more than twice that observed in 1-week and control hearts (C) (*, P < 0.01 versus control; †, P < 0.05 versus 1-week).
Discussion
In the first study demonstrating the feasibility of performing coronary artery ligation in mice, Michael et al 26 reported that permanent occlusions generating infarct sizes of approximately 30% of the left ventricular free wall caused wall thickness to decrease by ∼50% by 2 weeks compared to sham-operated mice. In our study, infarcts were slightly larger, not restricted to the free wall, and caused a more pronounced thinning to ∼25% of controls at 2 weeks. Lutgens et al 14 showed that chronic LAD occlusion resulting in 46% infarction of left ventricular circumference caused wall thinning to 50% of control at 1 week and to 30% by 5 weeks. They also observed significant chamber dilation indicated by doubling of LV diameter after 5 weeks. Our results are comparable to these since our infarcts thinned to ∼20% of control by 4 weeks and the chamber area was more than four times larger at 4 weeks compared to control. Lutgens et al 14 also performed what is, to our knowledge, the only other study of cell proliferation during mouse infarct repair. Using osmotic pumps to deliver a constant infusion of BrdU for 7 days, they reported increased DNA synthesis in interstitial cells in the border zone, septum, and right ventricle. While this study provided an important demonstration of cell replication, they did not determine the cell types that were proliferating. Furthermore, their continuous infusion would have labeled macrophage precursors in the bone marrow that subsequently homed to the infarct, and thus likely would have overestimated cell proliferation in the infarct. 14
Using a bolus administration of BrdU before sacrifice, we quantified cell proliferation at discrete time points in defined cell populations. Our results therefore extend preceding findings by demonstrating that the peak proliferation of myofibroblasts and endothelial cells occurs at 4 days post-MI, predominantly in the infarct border zone. By 1 week, proliferation of both cell types tapers off and essentially ceases by 2 weeks. Myofibroblasts, which express smooth muscle α-actin transiently when activated during wound healing, undergo apoptosis during the maturation of the scar, 9,27,28 which may account for the loss of SM-α-actin staining in the infarct at later time points. Similarly, we observed a decrease in vascular density (per mm2) at 4 weeks post-MI, from 3643 in control hearts (a number consistent with that reported by other groups 29,30 ) to 2716 at 1 week and 1010 at 4 weeks. However, the total cross-sectional area remained constant due to dilation of the vessels. The net loss of cell mass in the ventricle and side-to-side slippage of surviving cardiomyocytes, causes the wall to thin and the chamber to dilate. 13,31 We observed significant wall thinning and chamber dilation as early as 4 days post-MI. In accordance with other studies, these parameters progressively worsened throughout the 4-week study period, as indicated by the gradual increase in the expansion index between 4 days and 4 weeks post-MI. 11,13,32-35 Between 4 days and 4 weeks post-MI, the infarct region decreased from 38 ± 5% to 20 ± 4% of the LV area. This 50% reduction in infarct size is in accordance with previous studies in the rat and dog models showing over 40% reduction of infarct size. 1,36 Contraction of scar tissue during wound healing is well documented and is due, in part, to the contractile features of myofibroblasts. 37
In humans, scar maturation takes at least 8 weeks. 38 Experimental myocardial infarction in dogs has revealed that healing is slightly faster; non-reperfused infarcts are predominantly composed of granulation tissue with a central core of necrosis at 2 weeks post-MI, and scar formation is essentially complete by 6 weeks. 36 In rats, this process is shorter still, with collagen deposition leveling off between 1 and 2 weeks, 39 and healing essentially completed by 3 weeks. 1 In our study, we have shown that the infarct repair in mice is extremely rapid, with conversion of necrotic myocardium to granulation tissue mostly complete by 1 week, formation of young scar tissue by 2 weeks, and scar maturation at 4 weeks. This rate of repair is a slight gain compared to the rat model, which, in turn, is about twice as fast as in humans. This is expected since it is known that the rate of infarct healing is a function of the ratio of surface/volume. As infarct size increases, surface/volume ratio decreases and therefore larger infarcts (human, dog) heal slower than small ones (rat, mouse). Miura et al 40 showed that, in rabbits, as infarct size increases, the speed of healing decreases and that reperfusion can accelerate the healing process (organization) independent of infarct size. In addition to surface/volume ratios, there may be species variation in intrinsic healing rate. It is important to consider interspecies differences in infarct repair rates when extrapolating results from rodent models for the design of clinical interventions.
We hypothesize that interventions that accelerate the formation of granulation tissue will reduce ventricular remodeling and, consequently, decrease heart failure and mortality. Our kinetic data reveal the time point at which we should seek out and identify mitogens responsible for granulation tissue formation. Identification of these mitogens could lead to interventions that promote tissue repair and preserve cardiac function. The molecular regulation of the conversion rate of necrosis to granulation tissue is, therefore, of great interest when considering possible strategies to alter remodeling. For example, mice with targeted deletion of urokinase, 41,42 plasminogen, 43 or the matrix metalloproteinase MMP-9 44 do not convert myocardial necrosis to granulation tissue, demonstrating the importance of the plasmin system in degradation of the ECM following myocardial infarction. Also, many studies have shown that reperfusion significantly increases the rate of healing and attenuates remodeling. 18,36,40,45-48 We hypothesize that growth factors released from macrophages, myofibroblasts, 37,49-51 endothelial cells, 52,53 and possibly by damaged or necrotic cells 54 are potential candidates. With the ascendant use of genetically altered mice to interrogate gene function and miniaturized equipment to quantify LV function, this model of murine myocardial infarction establishes a reliable baseline for future work aimed at improving our understanding of the processes governing infarct repair.
Footnotes
Address reprint requests to Charles E. Murry, M.D., Ph.D., Department of Pathology, Box 357470, Room D-514 Health Sciences Building, University of Washington, 1959 Pacific Street NE, Seattle, WA, 98195. E-mail: murry@u.washington.edu.
Supported in part by National Institutes of Health grants PO1 HL0374, RO1 HL61553, and R24 HL64387.
References
- 1.Fishbein MC, Maclean D, Maroko PR: Experimental myocardial infarction in the rat: qualitative and quantitative changes during pathologic evolution. Am J Pathol 1978, 90:57-70 [PMC free article] [PubMed] [Google Scholar]
- 2.Frangogiannis NG, Smith CW, Entman ML: The inflammatory response in myocardial infarction. Cardiovasc Res 2002, 53:31-47 [DOI] [PubMed] [Google Scholar]
- 3.Cleutjens JPM: The role of matrix metalloproteinases in heart disease. Cardiovasc Res 1996, 32:816-821 [PubMed] [Google Scholar]
- 4.Bing RJ: Myocardial ischemia and infarction: growth of ideas. Cardiovasc Res 2001, 51:13-20 [DOI] [PubMed] [Google Scholar]
- 5.Murry CE, Giachelli CM, Schwartz SM, Vracko R: Macrophages express osteopontin during repair of myocardial necrosis. Am J Pathol 1994, 145:1450-1462 [PMC free article] [PubMed] [Google Scholar]
- 6.Casscells W, Kimura H, Sanchez JA, Yu ZX, Ferrans VJ: Immunohistochemical study of fibronectin in experimental myocardial infarction. Am J Pathol 1990, 137:801-810 [PMC free article] [PubMed] [Google Scholar]
- 7.Willems IE, Arends JW, Daemen MJ: Tenascin and fibronectin expression in healing human myocardial scars. J Pathol 1996, 179:321-325 [DOI] [PubMed] [Google Scholar]
- 8.Ulrich MM, Janssen AM, Daemen MJ, Rappaport L, Samuel JL, Contard F, Smits JF, Cleutjens JP: Increased expression of fibronectin isoforms after myocardial infarction in rats. J Mol Cell Cardiol 1997, 29:2533-2543 [DOI] [PubMed] [Google Scholar]
- 9.Desmouliere A, Redard M, Darby I, Gabbiani G: Apoptosis mediates the decrease in cellularity during the transition between granulation tissue and scar. Am J Pathol 1995, 146:56-66 [PMC free article] [PubMed] [Google Scholar]
- 10.Takemura G, Ohno M, Hayakawa Y, Misao J, Kanoh M, Ohno A, Uno Y, Minatoguchi S, Fujiwara T, Fujiwara H: Role of apoptosis in the disappearance of infiltrated and proliferated interstitial cells after myocardial infarction. Circ Res 1998, 82:1130-1138 [DOI] [PubMed] [Google Scholar]
- 11.Weisman HF, Healy B: Myocardial infarct expansion, infarct extension, and reinfarction: pathophysiologic concepts. Prog Cardiovasc Dis 1987, 30:73-110 [DOI] [PubMed] [Google Scholar]
- 12.Schuster EH, Bulkley BH: Expansion of transmural myocardial infarction: a pathophysiologic factor in cardiac rupture. Circulation 1979, 60:1532-1538 [DOI] [PubMed] [Google Scholar]
- 13.Pfeffer MA, Braunwald E: Ventricular remodeling after myocardial infarction: experimental observations and clinical implications. Circulation 1990, 81:1161-1172 [DOI] [PubMed] [Google Scholar]
- 14.Lutgens E, Daemen MJ, de Muinck ED, Debets J, Leenders P, Smits JF: Chronic myocardial infarction in the mouse: cardiac structural and functional changes. Cardiovasc Res 1999, 41:586-593 [DOI] [PubMed] [Google Scholar]
- 15.Braunwald E, Pfeffer MA: Ventricular enlargement and remodeling following acute myocardial infarction: mechanisms and management. Am J Cardiol 1991, 68:1D-6D [DOI] [PubMed] [Google Scholar]
- 16.Reinecke H, Murry C: Cell grafting for cardiac repair. Metzger J eds. Cardiac Cell and Gene Transfer: Principles, Protocols, and Applications 2003:pp 97-112 Humana Press, Ann Arbor, MI [DOI] [PubMed]
- 17.Ismail J, Poppa V, Kemper L, Scatena M, Giachelli C, Douglas J, Murry CE: Immunohistologic labeling of murine endothelium. Cardiovasc Pathol 2003, 12:82-90 [DOI] [PubMed] [Google Scholar]
- 18.Boyle MP, Weisman HF: Limitation of infarct expansion and ventricular remodeling by late reperfusion: study of time course and mechanism in a rat model. Circulation 1993, 88:2872-2883 [DOI] [PubMed] [Google Scholar]
- 19.Fraccarollo D, Galuppo P, Bauersachs J, Ertl G: Collagen accumulation after myocardial infarction: effects of ETA receptor blockade and implications for early remodeling. Cardiovasc Res 2002, 54:559-567 [DOI] [PubMed] [Google Scholar]
- 20.Weisman HF, Bush DE, Mannisi JA, Bulkley BH: Global cardiac remodeling after acute myocardial infarction: a study in the rat model. J Am Coll Cardiol 1985, 5:1355-1362 [DOI] [PubMed] [Google Scholar]
- 21.Darby I, Skalli O, Gabbiani G: α-smooth muscle actin is transiently expressed by myofibroblasts during experimental wound healing. Lab Invest 1990, 63:21-29 [PubMed] [Google Scholar]
- 22.Willems I, Havenith M, De Mey J, Daemen M: The α-smooth muscle actin-positive cells in healing human myocardial scars. Am J Pathol 1994, 145:868-875 [PMC free article] [PubMed] [Google Scholar]
- 23.Schnapp LM, Breuss JM, Ramos DM, Sheppard D, Pytela R: Sequence and tissue distribution of the human integrin α 8 subunit: a β 1-associated α subunit expressed in smooth muscle cells. J Cell Sci 1995, 108:537-544 [DOI] [PubMed] [Google Scholar]
- 24.Zimmermann WH, Didie M, Wasmeier GH, Nixdorff U, Hess A, Melnychenko I, Boy O, Neuhuber WL, Weyand M, Eschenhagen T: Cardiac grafting of engineered heart tissue in syngenic rats. Circulation 2002, 106:I151-I157 [PubMed] [Google Scholar]
- 25.Zhang K, Rekhter MD, Gordon D, Phan SH: Myofibroblasts and their role in lung collagen gene expression during pulmonary fibrosis: a combined immunohistochemical and in situ hybridization study. Am J Pathol 1994, 145:114-125 [PMC free article] [PubMed] [Google Scholar]
- 26.Michael LH, Entman ML, Hartley CJ, Youker KA, Zhu J, Hall SR, Hawkins HK, Berens K, Ballantyne CM: Myocardial ischemia and reperfusion: a murine model. Am J Physiol 1995, 269:H2147-H2154 [DOI] [PubMed] [Google Scholar]
- 27.Gabbiani G: Modulation of fibroblastic cytoskeletal features during wound healing and fibrosis. Pathol Res Pract 1994, 190:851-853 [DOI] [PubMed] [Google Scholar]
- 28.Gabbiani G: The cellular derivation and the life span of the myofibroblast. Pathol Res Pract 1996, 192:708-711 [DOI] [PubMed] [Google Scholar]
- 29.Maestri R, Milia AF, Salis MB, Graiani G, Lagrasta C, Monica M, Corradi D, Emanueli C, Madeddu P: Cardiac hypertrophy and microvascular deficit in kinin B2 receptor knockout mice. Hypertension 2003, 41:1151-1155 [DOI] [PubMed] [Google Scholar]
- 30.Scherrer-Crosbie M, Ullrich R, Bloch KD, Nakajima H, Nasseri B, Aretz HT, Lindsey ML, Vancon A-C, Huang PL, Lee RT, Zapol WM, Picard MH: Endothelial nitric oxide synthase limits left ventricular remodeling after myocardial infarction in mice. Circulation 2001, 104:1286-1291 [DOI] [PubMed] [Google Scholar]
- 31.Palojoki E, Saraste A, Eriksson A, Pulkki K, Kallajoki M, Voipio-Pulkki LM, Tikkanen I: Cardiomyocyte apoptosis and ventricular remodeling after myocardial infarction in rats. Am J Physiol 2001, 280:H2726-H2731 [DOI] [PubMed] [Google Scholar]
- 32.Pfeffer MA, Pfeffer JM: Ventricular enlargement and reduced survival after myocardial infarction. Circulation 1987, 75:IV93-IV97 [PubMed] [Google Scholar]
- 33.Pfeffer JM, Pfeffer MA, Fletcher PJ, Braunwald E: Progressive ventricular remodeling in rat with myocardial infarction. Am J Physiol 1991, 260:H1406-H1414 [DOI] [PubMed] [Google Scholar]
- 34.McKay RG, Pfeffer MA, Pasternak RC, Markis JE, Come PC, Nakao S, Alderman JD, Ferguson JJ, Safian RD, Grossman W: Left ventricular remodeling after myocardial infarction: a corollary to infarct expansion. Circulation 1986, 74:693-702 [DOI] [PubMed] [Google Scholar]
- 35.Weiss JL, Marino PN, Shapiro EP: Myocardial infarct expansion: recognition, significance, and pathology. Am J Cardiol 1991, 68:35D-40D [DOI] [PubMed] [Google Scholar]
- 36.Richard V, Murry CE, Reimer KA: Healing of myocardial infarcts in dogs: effects of late reperfusion. Circulation 1995, 92:1891-1901 [DOI] [PubMed] [Google Scholar]
- 37.Tomasek JJ, Gabbiani G, Hinz B, Chaponnier C, Brown RA: Myofibroblasts and mechano-regulation of connective tissue remodeling. Nat Rev Mol Cell Biol 2002, 3:349-363 [DOI] [PubMed] [Google Scholar]
- 38.Mallory G, White P, Salcedo-Salga J: The speed of healing of myocardial infarction: a study of the pathologic anatomy in 72 cases. Am Heart J 1939, 18:647-671 [Google Scholar]
- 39.Jugdutt BI, Joljart MJ, Khan MI: Rate of collagen deposition during healing and ventricular remodeling after myocardial infarction in rat and dog models. Circulation 1996, 94:94-101 [DOI] [PubMed] [Google Scholar]
- 40.Miura T, Shizukuda Y, Ogawa S, Ishimoto R, Iimura O: Effects of early and later reperfusion on healing speed of experimental myocardial infarct. Can J Cardiol 1991, 7:146-154 [PubMed] [Google Scholar]
- 41.Blankesteijn WM, Creemers E, Lutgens E, Cleutjens JP, Daemen MJ, Smits JF: Dynamics of cardiac wound healing following myocardial infarction: observations in genetically altered mice. Acta Physiol Scand 2001, 173:75-82 [DOI] [PubMed] [Google Scholar]
- 42.Heymans S, Luttun A, Nuyens D, Theilmeier G, Creemers E, Moons L, Dyspersin GD, Cleutjens JP, Shipley M, Angellilo A, Levi M, Nube O, Baker A, Keshet E, Lupu F, Herbert JM, Smits JF, Shapiro SD, Baes M, Borgers M, Collen D, Daemen MJ, Carmeliet P: Inhibition of plasminogen activators or matrix metalloproteinases prevents cardiac rupture but impairs therapeutic angiogenesis and causes cardiac failure. Nat Med 1999, 5:1135-1142 [DOI] [PubMed] [Google Scholar]
- 43.Creemers E, Cleutjens J, Smits J, Heymans S, Moons L, Collen D, Daemen M, Carmeliet P: Disruption of the plasminogen gene in mice abolishes wound healing after myocardial infarction. Am J Pathol 2000, 156:1865-1873 [DOI] [PMC free article] [PubMed] [Google Scholar]
- 44.Romanic AM, Harrison SM, Bao W, Burns-Kurtis CL, Pickering S, Gu J, Grau E, Mao J, Sathe GM, Ohlstein EH, Yue TL: Myocardial protection from ischemia/reperfusion injury by targeted deletion of matrix metalloproteinase-9. Cardiovasc Res 2002, 54:549-558 [DOI] [PubMed] [Google Scholar]
- 45.Jugdutt BI: Effect of reperfusion on ventricular mass, topography, and function during healing of anterior infarction. Am J Physiol 1997, 272:H1205-H1211 [DOI] [PubMed] [Google Scholar]
- 46.Michael LH, Ballantyne CM, Zachariah JP, Gould KE, Pocius JS, Taffet GE, Hartley CJ, Pham TT, Daniel SL, Funk E, Entman ML: Myocardial infarction and remodeling in mice: effect of reperfusion. Am J Physiol 1999, 277:H660-H668 [DOI] [PubMed] [Google Scholar]
- 47.Jugdutt BI, Menon V: Beneficial effects of therapy on the progression of structural remodeling during healing after reperfused and nonreperfused myocardial infarction: different effects on different parameters. J Cardiovasc Pharmacol Ther 2002, 7:95-107 [DOI] [PubMed] [Google Scholar]
- 48.Jugdutt BI, Menon V, Kumar D, Idikio H: Vascular remodeling during healing after myocardial infarction in the dog model: effects of reperfusion, amlodipine, and enalapril. J Am Coll Cardiol 2002, 39:1538-1545 [DOI] [PubMed] [Google Scholar]
- 49.Gabbiani G, Hirschel BJ, Ryan GB, Statkov PR, Majno G: Granulation tissue as a contractile organ: a study of structure and function. J Exp Med 1972, 135:719-734 [DOI] [PMC free article] [PubMed] [Google Scholar]
- 50.Serini G, Gabbiani G: Mechanisms of myofibroblast activity and phenotypic modulation. Exp Cell Res 1999, 250:273-283 [DOI] [PubMed] [Google Scholar]
- 51.Sun Y, Kiani MF, Postlethwaite AE, Weber KT: Infarct scar as living tissue. Basic Res Cardiol 2002, 97:343-347 [DOI] [PubMed] [Google Scholar]
- 52.Battegay EJ: Angiogenesis: mechanistic insights, neovascular diseases, and therapeutic prospects. J Mol Med 1995, 73:333-346 [DOI] [PubMed] [Google Scholar]
- 53.Kalkman EA, van Haren P, Saxena PR, Schoemaker RG: Regionally different vascular response to vasoactive substances in the remodeled infarcted rat heart: aberrant vasculature in the infarct scar. J Mol Cell Cardiol 1997, 29:1487-1497 [DOI] [PubMed] [Google Scholar]
- 54.Reidy MA, Fingerle J, Lindner V: Factors controlling the development of arterial lesions after injury. Circulation 1992, 86:III43-III46 [PubMed] [Google Scholar]