

Abstract
Of all of the epithelial ovarian cancers, clear cell carcinoma (CCC) of the ovary has the worst prognosis. We applied the oligonucleotide array technique to identify genes generally involved in CCC. Of the ∼12,600 genes that were analyzed, 28 were expressed significantly differently between four CCC and seven non-CCC cell lines. Among 16 up-regulated genes in CCC, we further investigated a transcription factor, hepatocyte nuclear factor-1β (HNF-1β). We validated up-regulation of HNF-1β in CCC in terms of both mRNA and protein level using real-time quantitative reverse transcriptase-polymerase chain reaction and immunoblotting. Immunohistochemical analysis of 83 surgically resected ovarian cancers showed that almost all CCC specimens (21 of 22 cases) had nuclear staining for HNF-1β, whereas most non-CCC specimens (60 of 61 cases) showed no immunostaining or only focal and faint staining in the nucleus. Furthermore, we investigated the significance of HNF-1β expression in CCC using RNA interference. The reduction of HNF-1β expression by RNA interference induced apoptotic cell death in ovarian CCC cells, which was confirmed by terminal dUTP nick-end labeling and fluorescence-activated cell-sorting analyses. Our results suggest that HNF-1β is not only an excellent CCC-specific molecular marker but also a molecular target for therapy of ovarian CCC.
Epithelial ovarian cancer has the worst prognosis of all gynecological malignancies. 1 Since the emergence of platinum-based chemotherapy, the survival rate of patients with epithelial ovarian cancer has improved dramatically. 2 Debulking surgery and adjuvant chemotherapy (such as a combination of paclitaxel and carboplatin) have now gained a position as the standard therapy for epithelial ovarian cancer. 3 However, we still face many problems in the therapy of epithelial ovarian cancer. One of the most difficult is the treatment of clear cell carcinoma (CCC). The incidence of CCC among epithelial ovarian cancers is not high (∼10%), but patients with CCC have a significantly worse prognosis than patients with serous carcinoma. 4,5 One of the reasons why CCC has such a poor prognosis is its low response to standard platinum-based chemotherapy. 6
From a pathogenetic viewpoint, CCC has a number of features distinguishing it from other epithelial ovarian cancers. The percentage of patients with stage I disease is significantly higher in patients with CCC (48.5%) than in those with serous adenocarcinoma (16.6%), 7 which means the properties of invasion differ between CCC and non-CCCs. The incidence of p53 mutation differs between CCC (0%) and endometrioid adenocarcinoma (63%). 8 The loss of heterozygosity pattern differs between CCC and non-CCCs. 9 Immunohistochemical analysis has revealed that CCC shows trends such as weak expression of both p53 and cyclin A and markedly increased expression of both p21 and cyclin E compared with the other histological subtypes. 10 Glutathione peroxidase 3 (GPX3) is overexpressed in CCC, which may explain the cancer’s chemoresistance. 11 Considering these facts, it is evident that CCC is not just another type of epithelial ovarian cancer but a distinct entity, and there is a need to determine its molecular pathogenesis if we are to improve its prognosis.
Until the establishment of the genome-wide expression-analyzing technique such as serial analysis of gene expression 12 or cDNA microarray 13,14 there was only fragmentary knowledge about the molecular pathogenesis of epithelial ovarian cancer. Since then, there have been extensive studies and rapid progress in our understanding of the molecular pathogenesis of various tumors 15-17 including epithelial ovarian cancer. 18-22 Although such studies based on the genome-wide expression analysis have identified many novel genes involved in ovarian cancer, the function and significance of almost all of such genes still remain unknown.
Here, we demonstrated that a distinction could be made between four CCC cell lines and seven non-CCC cell lines in terms of their molecular signatures. We found that hepatocyte nuclear factor-1β (HNF-1β), a sequence-specific transcription factor, is up-regulated at both the mRNA and protein level in CCC, unlike other epithelial ovarian cancers, using immunoblotting of 11 ovarian cancer cell lines and immunohistochemistry of 83 surgically resected specimens. As immunohistochemical analysis revealed that HNF-1β expression was tightly linked to CCC, we furthermore investigated the significance of HNF-1β expression in CCC using RNA interference (RNAi), a new gene-silencing technique. 23-25 Ovarian CCC cells were transfected with short interference RNA (siRNA) targeted against the HNF-1β gene. Terminal dUTP nick-end labeling (TUNEL) and fluorescence-activated cell-sorting (FACS) analyses revealed that the reduction of HNF-1β induced apoptotic cell death in ovarian CCC cells. Our data indicate that HNF-1β would be not only an excellent CCC-specific molecular marker but also a molecular target for the therapy of ovarian CCC.
Materials and Methods
Cell Cultures
RMG-1, RMG-2, and RMUG-L cell lines were kindly provided by Dr. S. Nozawa (Keio University, Tokyo, Japan). JHOC-5, JHOS-2, and JHOS-3 were generously provided by Dr. H. Ishikawa (Tokyo Jikeikai Medical School, Tokyo, Japan). OMC-3 was kindly provided by Dr. T. Yamada (Osaka Medical College, Osaka, Japan). MCAS was obtained from the Japanese Cancer Research Resources Bank, Tokyo, Japan. OV-90, TOV-21G, TOV-112D, and HeLa cells were obtained from the American Type Culture Collection (Manassas, VA). Abbreviations used for these cell lines and the cell line histologies are shown in Table 1 ▶ . All cell lines were cultured in RPMI 1640 supplemented with 10% fetal bovine serum, 100 U/ml penicillin, and 100 μg/ml streptomycin in a humidified atmosphere of 5% CO2 and 95% air at 37°C.
Table 1.
Analyzed Ovarian Cancer Cell Lines
| Abbreviation | Cell name | Histology |
|---|---|---|
| C1 | RMG-2 | Clear cell |
| C2 | RMG-1 | Clear cell |
| C3 | JHOC-5 | Clear cell |
| C4 | TOV-21G | Clear cell |
| E1 | TOV-112D | Endometrioid |
| M1 | RMUG-L | Mucinous |
| M2 | MCAS | Mucinous |
| M3 | OMC-3 | Mucinous |
| S1 | JHOS-3 | Serous |
| S2 | OV-90 | Serous |
| S3 | JHOS-2 | Serous |
RNA Extraction and Oligonucleotide Array
Total RNA was extracted from each cell line using Trizol reagent (Invitrogen, Carlsbad, CA) according to the manufacturer’s instructions, and then treated with DNase I (Promega, Madison, WI). The cRNA target was synthesized from 5 μg of total RNA derived from each sample using a Super Script Choice System (Invitrogen) and the BioArray High Yield RNA Transcript Labeling kit (Enzo Diagnostics, Farmingdale, NY) according to the manufacturer’s instructions. Hybridization of each cRNA target to human U95Av2 oligonucleotide probe arrays (corresponding to 12,686 human genes and expressed sequence tags; Affymetrix, Santa Clara, CA) and detection of the signals were performed as instructed by the manufacturer. Absolute analysis was performed with Affymetrix Microarray Suite 4.0 software. The hybridization intensity data were normalized to 1000 total signal intensities for each array. The data were further filtered and analyzed by GeneSpring Software (version 4.2.1; Silicon Genetics, San Carlos, CA).
Real-Time Reverse Transcriptase-Polymerase Chain Reaction (RT-PCR)
From total RNA sample, template cDNA was synthesized with an oligo (dT)12–18 primer (Invitrogen) and Omniscript Reverse Transcriptase (Qiagen, Hilden, Germany). Real-time quantitative RT-PCR was performed with a QuantiTect SYBR Green PCR kit (Qiagen) and a GeneAmp 7700 Sequence Detector (Applied Biosystems, Foster City, CA) under the following conditions: one cycle at 95°C for 15 minutes, then 40 cycles at 95°C for 15 seconds, 55°C for 30 seconds, and 72°C for 30 seconds. For standardization of the amount of RNA, expression of glyceraldehyde-3-phosphate dehydrogenase (GAPDH) in each sample was quantified. The primer sets for amplification of HNF-1β, lamin, and GAPDH cDNA were as follows: HNF-1β forward, 5′-GCCCACACACCACTTACTTCG-3′; and reverse, 5′-GTCCGTCAGGTAAGCAGGGAC-3′; lamin forward, 5′-CTGCGCAACAAGTCCAATGAG-3′; and reverse, 5′-CAGGGTGAACTTTGGTGGGAAC-3′; GAPDH forward, 5′-AGGAAGAGAGAGACCCTCACTGC-3′; and reverse, 5′-ATGACAAGGTGCGGCTCC-3′. Quantitative RT-PCR was performed at least three times, including a no-template control as a negative control. Statistical analyses were performed by the Mann-Whitney U-test.
Immunoblot Analysis
For immunoblot analysis, cells were lysed with lysis buffer [50 mmol/L Tris-HCl (pH 7.4), 150 mmol/L NaCl, 1% Triton X-100, 1 mmol/L phenylmethyl sulfonyl fluoride, and complete protease inhibitor cocktail tablet (Roche Diagnostics, Basel, Switzerland)]. The lysate was centrifuged and the supernatant was prepared. Equal amount of proteins were resolved by sodium dodecyl sulfate-polyacrylamide gel electrophoresis (10%) and transferred to polyvinylidene difluoride membrane (Immobilon; Millipore, Billerica, MA). Nonspecific sites on the membrane were blocked by incubation for 90 minutes at ambient temperature with 5% (w/v) nonfat dry milk in phosphate-buffered saline (PBS). All of the membranes were then incubated overnight at 4°C with goat polyclonal antibody for HNF-1β (sc-7411; Santa Cruz Biotechnology, Santa Cruz, CA), mouse monoclonal antibody for lamin A/C (612163; BD Biosciences, San Jose, CA) and mouse monoclonal antibody for α-tubulin (sc-8035; Santa Cruz Biotechnology) as a loading control in the same blocking solution. The membranes were then washed and incubated for 90 minutes at ambient temperature with horseradish peroxidase-conjugated secondary antibodies (Santa Cruz Biotechnology). Immunocomplexes were visualized using an enhanced chemiluminescence detection system (Amersham Pharmacia Biotech, Buckinghamshire, UK).
Cases Used for Immunohistochemistry
We investigated a total of 83 epithelial ovarian cancers surgically resected at the National Cancer Center Hospital between 1998 and 2001. The patients’ ages ranged from 30 to 84 years (mean, 55.6 years), and none of the patients had received chemotherapy or any other treatment preoperatively. Their detailed clinicopathological features are summarized in Table 2 ▶ . Ten cases of ovarian endometriosis and 10 cases of normal ovarian surface epithelium from patients with other nonneoplastic gynecological diseases were also investigated. The pathological diagnoses were made according to the criteria of the World Health Organization and the International Federation of Gynecology and Obstetrics (FIGO). 26
Table 2.
Clinicopathological Features of Surgically Resected Specimens
| Characteristics | Clear cell (%) | Serous (%) | Mucinous (%) | Endometrioid (%) |
|---|---|---|---|---|
| Age | ||||
| <60 | 14 (63.6) | 25 (64.1) | 9 (81.8) | 9 (81.8) |
| ≥60 | 8 (36.3) | 14 (35.8) | 2 (18.2) | 2 (18.2) |
| Histologic differentiation | ||||
| Well | 10 (45.4) | 14 (35.8) | 9 (81.8) | 8 (72.7) |
| Moderate | 8 (36.3) | 14 (35.8) | 2 (18.2) | 3 (27.2) |
| Poor | 4 (18.1) | 11 (28.2) | 0 | 0 |
| FIGO stage | ||||
| I/II | 18 (81.8) | 16 (41.0) | 10 (90.9) | 9 (81.8) |
| III/IV | 4 (18.1) | 23 (58.9) | 1 (9.1) | 2 (18.2) |
| Total (cases) | 22 | 39 | 11 | 11 |
Immunohistochemistry
Sections (5 μm thick) of formalin-fixed, paraffin-embedded tissue were deparaffinized with xylene, treated with 0.3% hydrogen peroxide in methanol, immersed in 10 mmol/L citrate buffer (pH 6.0), heated at 90°C in a microwave oven for 10 minutes, and allowed to cool at room temperature for 30 minutes. Then the sections were preincubated in 2% normal swine serum (DAKO, Glostrup, Denmark) in PBS, incubated with goat polyclonal antibody for HNF-1β (sc-7411) as the primary antibody at 4°C overnight, washed with PBS, and incubated for 30 minutes with biotinylated horse anti-goat immunoglobulin as the secondary antibody (Vector Laboratories, Burlingame, CA). Subsequently, they were incubated for 30 minutes with avidin-biotin-peroxidase complex using a Vectastain ABC kit (Vector Laboratories) and subjected to the peroxidase reaction using 0.02% 3,3′-diaminobenzidine tetrahydrochloride as the chromogen and 0.007% hydrogen peroxide in Tris-HCl buffer (pH 7.6), followed by nuclear counterstaining with hematoxylin.
Staining Evaluation and Statistical Methods
Staining was evaluated by two independent observers (AT and MS). The results were scored on the basis of the percentage of nuclei positive for HNF-1β (0, no positive cells; 1, ≤5%; 2, 6 to 25%; 3, 26 to 50%; 4, 51 to75%; 5, >75%). The Mann-Whitney U-test and chi-square test were used to analyze the statistical significance of the relationship between HNF-1β expression and the clinicopathological variables.
RNA Interference
HNF-1β siRNA, which was chemically synthesized 21-nucleotide double-stranded RNA, was obtained from Dharmacon Research Inc. (Lafayette, CO). The HNF-1β siRNA was targeted to the coding regions 1276 to 1296 (AAUCCCCAGCAAUCUCAAAAC) to the first nucleotide of the start codon (GenBank accession no. X58840). Control siRNAs targeted to luciferase GL2 and lamin A/C 25 were obtained from Dharmacon Research Inc. Cells were plated at 2 × 10⁵ cells per well in a six-well plate for real-time quantitative RT-PCR, immunoblot, TUNEL, and FACS analysis. Twenty-four hours after plating, the cells were transfected with a final concentration of 100 nmol/L of siRNA using siPORT Lipid (Ambion, Austin, TX) according to the manufacturer’s instructions.
Detection of Apoptosis
Apoptosis was detected by TUNEL assay and FACS analysis. The TUNEL assay was performed using an In Situ Cell Death Detection kit (Roche Diagnostics) according to the manufacturer’s instructions. Then the nuclei were counterstained with VectaShield DAPI (4,6-diamidino-2-phenylindole; Vector Laboratories), and viewed with a Zeiss LSM410 microscope (Zeiss, Thornwood, NY). The number of TUNEL-positive nuclei was counted and divided by the number of DAPI-stained nuclei to calculate the percentage of TUNEL-positive cells.
For FACS analysis, 6, 12, 18, or 24 hours after transfection with siRNA, adherent and detached cells were combined and fixed overnight with 70% ethanol at 4°C overnight. After two rinses with PBS, the cells were incubated for 20 minutes with 1 ml of PBS containing 1 mg of ribonuclease A at 37°C, and then stained in 1 ml of PBS containing 50 μg of propidium iodide. A total of 2 × 10⁴ cells were then analyzed in a flow cytometer (FACScalibur; Becton Dickinson, Franklin Lakes, NJ), and the sub-G1 peak was quantified using CELLQuest software.
Results
Expression Analysis of 11 Ovarian Cancer Cell Lines
To identify genes expressed differently between CCC and non-CCCs, we compared the gene expressions of four ovarian CCC cell lines with those of seven cell lines of other histologies using oligonucleotide array. We filtered all genes, with the following limits: 1) present (ie, unambiguously expressed in the sample) in at least 5 of 11 samples; 2) average difference of more than 1000 in at least 5 of 11 samples (mean difference in signal intensity between perfect match and mismatch probe pairs); 3) Mann-Whitney U-test with significance set at P < 0.05 to identify genes expressed differently between CCCs and non-CCCs. Using the above criteria, we selected 207 differently expressed genes from 12,686 probe sets. Furthermore, we listed genes that met an additional limit: 4) more than a threefold increase in the average difference between two groups, to identify genes with more significant difference of expression in CCC or non-CCC cells (Figure 1) ▶ . Sixteen genes were up-regulated and 12 were down-regulated in CCC compared with non-CCCs.
Figure 1.

Genes differently expressed in clear cell versus non-CCC. Twenty-eight genes displayed a threefold or more increase or decrease in expression level that was significant at the P < 0.05 level by U-test. Each color patch in the resulting visual map represents the expression level of the associated gene in the cell line sample, with a continuum of expression levels from green (lowest) to bright red (highest). GenBank accession numbers, gene symbols, loci, gene descriptions, and the fold changes are shown. The scale bar reflects the fold increase (red) or decrease (green) for any given gene relative to the median level of expression across all samples. Samples are labeled as follows: C, clear cell; E, endometrioid; M, mucinous; S, serous carcinoma of the ovary.
Expression of HNF-1β mRNA and Protein in Ovarian Cancer Cell Lines
Of the genes listed in Figure 1 ▶ , we focused on a transcription factor HNF-1β because it is a well-characterized transcription factor playing an important role in the embryonal development, 27 but its up-regulation is rare among the cancerous tissue other than hepatocellular carcinoma 28 and the significance of its expression in cancerous tissue is still unknown. As HNF-1β was the most abundantly up-regulated transcription factor, we speculated that it contributes to the characteristic biological behavior of CCC by regulating its downstream target genes. First, we analyzed the expression level of HNF-1β mRNA by real-time quantitative RT-PCR (Figure 2A) ▶ . The relative expression levels of HNF-1β mRNA normalized with GAPDH mRNA, as measured by real-time quantitative RT-PCR, were closely correlated with those obtained by microarray analysis. The relative expression levels of HNF-1β mRNA in CCCs (8.75 ± 3.89) were on average 11.6-fold higher than those in non-CCCs (0.75 ± 1.09) (P = 0.008 by U-test).
Figure 2.

Real-time quantitative RT-PCR analysis and immunoblot analysis of HNF-1β in ovarian cancer cell lines. A: Gene expression levels for HNF-1β. The expression levels were normalized with GAPDH mRNA in each sample. B and C: Immunoblot analysis of HNF-1β protein (B). Each cell line lysate (20 μg) was analyzed using anti-HNF-1β antibody. Arrowheads indicate the normal HNF-1β isoform. The blot was stripped and reprobed with anti-α-tubulin antibody to check for equal loading of total protein (C). Abbreviations used for these cell lines (C1, C2, C3, C4, E1, M1, M2, M3, S1, S2, and S3) and the cell line histologies are shown in Table 1 ▶ .
We next examined the expression of HNF-1β protein using anti-HNF-1β antibody. Immunoblot detection of HNF-1β in a series of ovarian cancer cell lines is shown in Figure 2B ▶ . The Mr 70,000 band corresponding to HNF-1β protein was detected in all CCC cell lines. The Mr 55,000 band detected in C1 and C2 was considered to be corresponding to a splice variant protein of HNF-1β because there are three HNF-1β isoforms. 29 No specific band was detected other than these two HNF-1β-specific bands. The intensity of the Mr 70,000 band in each cell line was correlated with the mRNA expression level obtained from quantitative RT-PCR analysis. Little or no reactivity for HNF-1β was observed in any of the non-CCC cell lines except for M1.
Immunohistochemical Analysis of Ovarian Cancer Specimens
To determine whether HNF-1β is also up-regulated in surgically resected specimens of CCC at the protein level, for immunohistochemical analysis we used the same anti-HNF-1β antibody that we had used for immunoblot analysis (Figure 3) ▶ . Almost all of the CCCs showed nuclear staining (Figure 3 ▶ ; A to C), but most non-CCCs showed no immunostaining or only focal and faint staining in the nucleus (Figure 3 ▶ ; D to G). No cases of benign endometriosis showed nuclear staining for HNF-1β (Figure 3H) ▶ . Also, no cases of normal ovarian surface epithelium, which is considered to be the origin of epithelial ovarian cancer, showed nuclear staining for HNF-1β (Figure 3I) ▶ .
Figure 3.
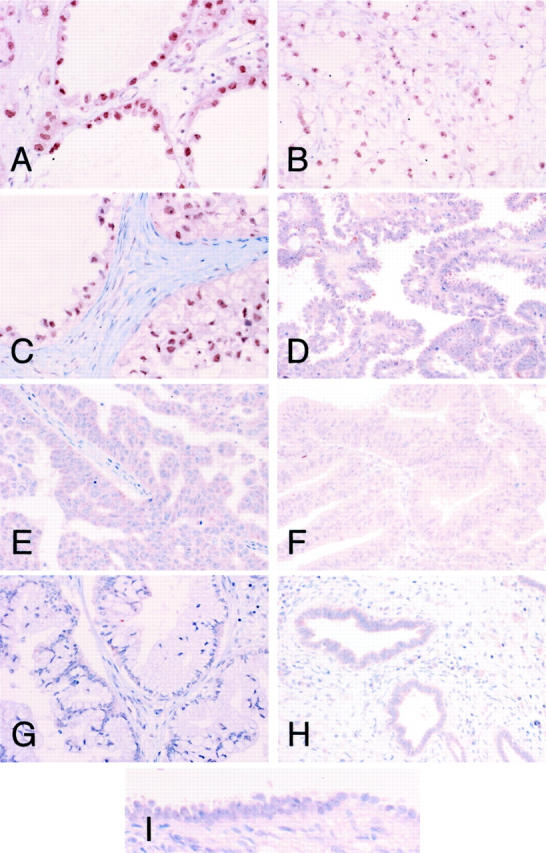
Immunohistochemical analysis of HNF-1β protein expression in surgically resected epithelial ovarian cancers. Immunohistochemistry on paraffin-embedded samples of clear cell (A, case 26; B, case 8; C, case 15), serous (D, case 35; E, case 59), endometrioid (F, case 18), and mucinous (G, case 81) adenocarcinomas of the ovary was performed with an antibody against HNF-1β. Ovarian endometriosis (H) and normal ovarian surface epithelium (I) were also immunostained with the same antibody. CCCs had strong nuclear staining for HNF-1β. Original magnifications: ×200 (A–H); ×400 (I).
The HNF-1β immunostaining score for CCCs (4.22 ± 0.85) was significantly higher than that for non-CCCs (0.31 ± 0.62) (P < 0.0001 by U-test) (Figure 4) ▶ . The different HNF-1β expression patterns (high or low HNF-1β expression) did not correlate with patient age or histological differentiation (Table 3) ▶ . The P value for the difference in expression pattern of HNF-1β between the early FIGO stage (stage I, II) and the advanced stage (stage III, IV) was significant (P = 0.041 by chi-square test) (Table 3) ▶ , but we considered that this significance was related to the earlier FIGO stage distribution of CCCs and the higher HNF-1β immunostaining score for CCCs. Indeed, there was no significant difference between the HNF-1β score for earlier-stage CCCs (4.16 ± 0.57, 18 cases) and that for advanced-stage CCCs (4.50 ± 0.99, four cases) (P = 0.670 by U-test). Therefore, essentially, no specific correlation was found between these immunostaining scores and FIGO stage.
Figure 4.

Relationship between immunohistochemical expression of HNF-1β and histology. Box plot showing the relationship between HNF-1β immunostaining score and histology. The box encompasses the 25th through 75th percentiles of results obtained with the 50th percentile (median). The 5th and 95th percentiles are shown as Ο below and above the 10th and 90th percentile whisker caps, respectively. The immunostaining scores for CCCs were significantly higher than those for other histologies (P < 0.0001 by U-test).
Table 3.
Relationships Between HNF-1β Expression and Clinicopathological Features in Epithelial Ovarian Cancers*
| n | HNF-1β expression high group (score 3 to 5) | HNF-1β expression low group (score 0 to 2) | P value | |
|---|---|---|---|---|
| All patients | 83 | 22 (27%) | 61 (73%) | |
| Age | ||||
| <60 | 57 | 15 (26%) | 42 (74%) | |
| ≥60 | 26 | 7 (27%) | 19 (73%) | 0.953 |
| Histology | ||||
| Clear cell | 22 | 21 (95%) | 1 (5%) | |
| Serous | 39 | 0 (0%) | 39 (100%) | |
| Mucinous | 11 | 0 (0%) | 11 (100%) | |
| Endometrioid | 11 | 1 (9%) | 10 (91%) | <0.0001 |
| Histologic differentiation | ||||
| Well | 41 | 11 (27%) | 30 (73%) | |
| Moderate | 27 | 8 (30%) | 19 (70%) | |
| Poor | 15 | 3 (20%) | 12 (80%) | 0.793 |
| FIGO stage | ||||
| I/II | 53 | 18 (34%) | 35 (66%) | |
| III/IV | 30 | 4 (13%) | 26 (87%) | 0.041 |
*Chi-square test.
Reduction of HNF-1β Expression by RNA Interference
To investigate whether the up-regulated expression of HNF-1β in CCC has biological significance, we conducted functional analysis by reduction of HNF-1β expression with RNAi. Using real-time quantitative RT-PCR, we first tested the ability of siRNAs to reduce the endogenous level of lamin and HNF-1β mRNA in the TOV-21G, JHOC-5, RMG-1, and RMG-2 ovarian CCC cell lines (Figure 5A) ▶ . Lamin siRNA significantly reduced the expression of lamin mRNA to 44 ± 6% (TOV-21G) or to 42 ± 7% (JHOC-5) of the level in cells treated with the transfection reagent only, but it did not reduce the expression of HNF-1β mRNA. HNF-1β siRNA significantly reduced the expression of HNF-1β mRNA to 27 to 45% (TOV-21G) or to 50 ± 12% (JHOC-5) of the level in cells treated with the transfection reagent only, but it did not reduce the expression of lamin mRNA. Lamin or HNF-1β siRNA did not reduce lamin or HNF-1β mRNA in RMG-1 or RMG-2 cell lines (data not shown). Therefore, by using siRNA we successfully induced gene-specific silencing in the TOV-21G and JHOC-5 cell lines.
Figure 5.

Effect of small interfering RNA (siRNA) transfection in TOV-21G and JHOC-5 ovarian CCC cells. A: Gene expression levels for lamin and HNF-1β measured by real-time quantitative RT-PCR analysis. Buffer (PBS plus transfection reagent)-, luciferase siRNA-, and lamin siRNA-transfected TOV-21G and JHOC-5 cells were analyzed 24 hours after the beginning of transfection. HNF-1β siRNA-transfected cells were analyzed 12, 24, and 36 hours after the beginning of transfection. The expression levels were normalized with GAPDH mRNA in each sample. The average of three independent experiments is shown, and error bars indicate SD. **, Significant reduction compared with buffer only (P < 0.001 by U-test). B: Immunoblot analysis of lamin and HNF-1β protein in transfected TOV-21G and JHOC-5 cells. Each cell line lysate (20 μg) was analyzed using anti-lamin and anti-HNF-1β antibodies. The blot was stripped and reprobed with anti-α-tubulin antibody to check for equal loading of total protein.
Next, using immunoblot analysis, we examined whether these siRNAs also reduce the expression of lamin or HNF-1β protein in the TOV-21G and JHOC-5 cell lines (Figure 5B) ▶ . Lamin siRNA reduced the expression of lamin protein. HNF-1β siRNA reduced the expression of HNF-1β protein time dependently, and the intensity of the HNF-1β protein band almost reached the background level 24 hours after transfection in TOV-21G and JHOC-5 cells. The effect was specific because lamin or HNF-1β siRNA reduced only the lamin or HNF-1β protein, respectively, and siRNA targeted to luciferase, for which TOV-21G or JHOC-5 has no endogenous expression, did not change the expression of any protein.
Induction of Apoptosis in Ovarian CCC Cells by Reduction of HNF-1β Expression
It was observed that TOV-21G and JHOC-5 cells transfected with HNF-1β siRNA frequently became detached from the culture dish and floated in the culture medium, the floating cells exhibiting a rounded and shrunken morphology reminiscent of apoptosis. On the other hand, cells transfected with lamin siRNA as controls did not float or show these morphological changes. To examine whether the reduction of HNF-1β expression induces apoptosis in TOV-21G and JHOC-5 cells, we used TUNEL and FACS analysis. TUNEL analysis showed that 9.2 ± 2.2% (TOV-21G) or 8.6 ± 2.5% (JHOC-5) of the adherent cells transfected with HNF-1β siRNA underwent apoptosis 24 hours after the beginning of transfection. The percentage of apoptotic cells was significantly higher than that in control cells transfected with lamin siRNA (2.9 ± 1.0% in TOV-21G or 2.5 ± 1.3% in JHOC-5) (P < 0.001 by U-test) (Figure 6A) ▶ .
Figure 6.
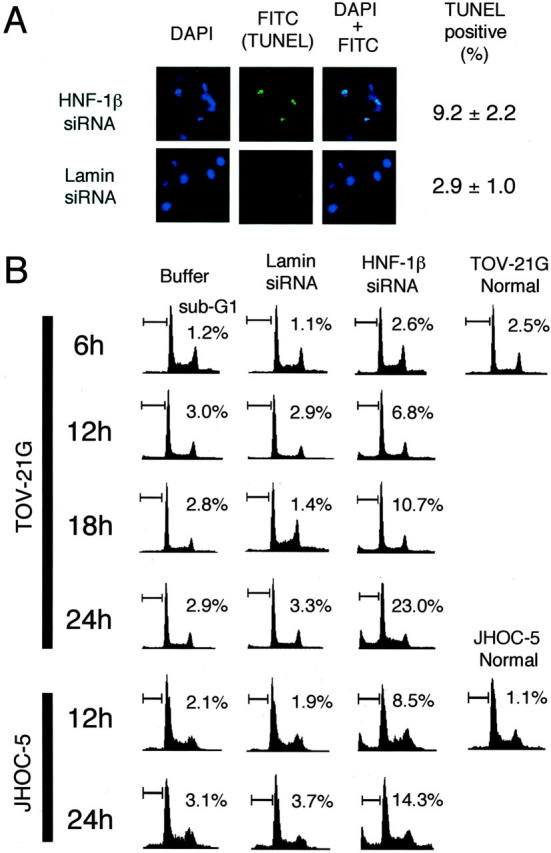
Induction of apoptosis by reduction of HNF-1β expression in TOV-21G and JHOC-5 ovarian CCC cells using RNAi. A: TOV-21G cells were transfected with HNF-1β or lamin siRNA. Apoptosis was detected by the TUNEL method with FITC emission 24 hours after the beginning of transfection. The percentage of TUNEL-positive values corresponds to the average and SD of 10 determinations of slides from three independent experiments with three fields/slide. B: Apoptotic cells were evaluated by FACS analysis at 6, 12, 18, and 24 hours after the beginning of transfection with buffer (PBS plus transfection reagent), lamin siRNA, and HNF-1β siRNA. Values indicate the percentage of cells with a sub-G1 DNA content. Three experiments were performed in triplicate.
Figure 6B ▶ shows the time course effect of HNF-1β siRNA on the cell-cycle profile of TOV-21G and JHOC-5 cells by FACS analysis. When cells were treated with lamin siRNA or buffer only, no change in the percentage of total cells in the sub-G1 peak, characteristic of apoptotic cells, was observed throughout the experimental period. On the other hand, a significant increase in the sub-G1 peak was observed in cells treated with HNF-1β siRNA 12 hours after the beginning of transfection both in TOV-21G and JHOC-5 cells. The percentage of the sub-G1 peak in HNF-1β siRNA-treated cells gradually increased, and reached 23.0% (TOV-21G) or 14.3% (JHOC-5) 24 hours after transfection.
To exclude the possibility that the HNF-1β siRNA we synthesized had unexpected toxicity for culture cells, we conducted FACS analysis of OV-90 serous carcinoma cells and HeLa cells, which have weak or no endogenous HNF-1β expression (OV-90; Figure 2 ▶ , HeLa; data not shown). Lamin siRNA reduced the lamin protein content of respective cells, indicating that the RNAi mechanism works both in OV-90 and HeLa cells (Figure 7A) ▶ . FACS analysis performed 24 hours after transfection showed no significant difference between the sub-G1 peak of HNF-1β siRNA-treated cells and that of lamin siRNA-treated cells (Figure 7B) ▶ in both cell lines. Therefore this observation indicated that the HNF-1β siRNA we synthesized did not have a nonspecific side effect, and that degradation of HNF-1β mRNA and subsequent reduction of HNF-1β protein caused apoptotic cell death in TOV-21G and JHOC-5 cells transfected with HNF-1β siRNA.
Figure 7.

HNF-1β siRNA does not induce apoptosis in HeLa or ovarian serous adenocarcinoma cells. A: Immunoblot analysis of lamin protein in transfected OV-90 and HeLa cells. Each cell line lysate (20 μg) was analyzed using anti-lamin antibody. The blot was stripped and reprobed with anti-α-tubulin antibody to check for equal loading of total protein. B: Apoptotic cells were evaluated by FACS analysis at 24 hours after the beginning of transfection with buffer (PBS plus transfection reagent), lamin siRNA, and HNF-1β siRNA. Values indicate the percentage of cells with a sub-G1 DNA content.
Discussion
All of the details of the molecular pathogenesis of ovarian cancer have not yet been elucidated. The establishment of genome-wide expression analysis, as well as several studies based on such technology, 18-22 have recently clarified the genes involved in ovarian cancer. Of the genes up-regulated in the CCC cell lines obtained in this study, osteopontin (SPP1), nicotinamide N-methyltransferase, HNF-1β (TCF2), RAB9, and lipopolysaccharide-induced tumor necrosis factor-α factor (PIG7) were also up-regulated in surgically resected CCC tissue according to a recent microarray analysis of ovarian cancer tissue specimens. 22 Contamination with noncancerous cells such as mesenchymal cells is a problem in the microarray analysis of tissue specimens, whereas changes in cell features, including the expression profile, during the process of establishing a cell line are problematic in the analysis of cell lines. Therefore, the agreement between the results obtained from surgically resected tissue and those from the cell lines implies that these five genes are especially important features of ovarian CCC. SPP1, the most up-regulated gene in this study, is a secreted calcium-binding glycophosphoprotein whose overexpression is linked to poor prognosis and tumor hypoxia in several cancers. 30,31 SPP1 is up-regulated in epithelial ovarian cancer (both CCC and non-CCC) compared with normal tissue, 32 but its overexpression in CCC observed in this study was tremendous, suggesting that overexpression of SPP1 contributes partly to the poor prognosis of CCC. Nicotinamide N-methyltransferase catalyzes the N-methylation of nicotinamide and other pyridines, and its overexpression is correlated with radioresistance. 33 Up-regulation of nicotinamide N-methyltransferase may account for the chemoresistance of CCC because nicotinamide N-methyltransferase inhibits poly (ADP-ribose) polymerase (PARP), which plays an important role in maintaining genome integrity in response to DNA damage induced by genotoxic agents such as cis-platin. 34 Up-regulation of PAX8, a sequence-specific transcription factor, 35 was confirmed by real-time quantitative RT-PCR and immunohistochemical analysis (unpublished observation), and might be involved in the carcinogenesis of CCC because PAX8 protein has been shown to be expressed at a high level in Wilms’ tumors 36 and is able to induce transformation of cell cultures and tumor formation in mice. 37
By using surgically resected specimens with diverse pathological characteristics, we found that up-regulated HNF-1β expression at the protein level was very tightly linked to ovarian CCC, regardless of clinical stage or histological differentiation. More than 95% (21 of 22 cases) of CCCs analyzed showed >25% HNF-1β-positive cancer cells, whereas <2% (1 of 61 cases) of non-CCCs showed >25% HNF-1β-positive cancer cells. It was interesting that no cases of benign endometriosis or normal ovary showed HNF-1β immunostaining because endometriosis is highly associated with CCC 38 and is considered to be precursor lesion of CCC. 39 These results of immunohistochemical analysis imply that HNF-1β is a useful molecular marker for ovarian CCC. Particularly in cytology, HNF-1β immunostaining would be an excellent method of distinguishing ovarian CCC cells from other histologies, which up to now has been difficult with the standard Papanicolaou stain.
HNF-1β (also called variant HNF1, LF-B3, or TCF2) is a transcription activator that regulates the promoters or enhancers of genes that are expressed in a liver-specific manner, such as albumin and α-fetoprotein. 40-42 HNF-1β and HNF-1α (a protein closely related to HNF-1β 42 ) are also thought to be major regulators of glucose homeostasis. 43 HNF-1β mutations cause early-onset diabetes mellitus. 44 HNF-1β is overexpressed in hepatocellular carcinoma, 28 but its up-regulation has not been reported in other cancers so far.
To investigate the significance of HNF-1β expression in CCC, we conducted siRNA analysis and successfully introduced RNAi phenomenon to TOV-21G and JHOC-5 ovarian CCC cell lines. In these cell lines, reduction of HNF-1β expression by RNAi caused apoptotic cell death. However we could not introduce siRNA phenomenon to RMG-1 and RMG-2 ovarian CCC cell lines, using several commercially available transfection reagents such as oligofectamine (Invitrogen), Lipofectamine2000 (Invitrogen), siPort amine (Ambion), siPort lipid (Ambion), and RNAiFect (Qiagen). We thought that the reason why we could not introduce gene silencing to these two cell lines was partly because these transfection reagents had little transfection effects on RMG-1 or RMG-2. In the transfection experiment using fluorescein-labeled siRNA duplex targeted to luciferase, more than 70% of TOV-21G and JHOC-5 cells took fluorescein-labeled siRNA whereas less than 5% of RMG-1 and RMG-2 cells took fluorescein-labeled siRNA (data not shown). We did not observe apoptosis throughout siRNA experiments in RMG-1 and RMG-2 cell lines (data not shown). Taking the above results to consideration, we concluded that the reduction of HNF-1β by RNAi caused apoptosis in TOV-21G and JHOC-5 cell lines, suggesting that HNF-1β expression was essential for the survival of CCC cells. Our observation is supported by evidence that dominant-negative suppression of HNF-1α induces insulinoma cell apoptosis. 45 However, it is not clear why reduction of HNF-1 induces apoptosis in CCC or insulinoma cells. HNF-1β may regulate directly or indirectly unknown target genes relevant to cell survival. Further investigation to elucidate the relationship between induction of apoptosis and transcriptional changes caused by the reduction of HNF-1β are under way in our laboratory. In any event, our results suggest that HNF-1β might be a novel molecular target for therapy of ovarian CCC. Double-stranded RNA itself can work as a therapeutic agent in murine models, 46 or it may be possible to use retrovirus-based RNAi vectors 47 or transcription factor decoy molecules. 48
In conclusion, we have found a series of genes that are preferentially expressed in ovarian CCC. Also we found that the expression of HNF-1β was tightly linked to CCC and essential for its survival. The genes found in this study, especially HNF-1β, should prove to be useful clues that will help us to clarify the distinguishing features of CCC, including its origin, morphology, and resistance to standard therapies for ovarian cancer.
Acknowledgments
We thank Ms. Y. Yamauchi for expert technical assistance; and Dr. R. Tsunematsu, Dr. T. Yamada, Dr. T. Kasamatsu, and Dr. T. Onda for generously providing us with clinical information.
Footnotes
Address reprint requests to Setsuo Hirohashi, M.D., National Cancer Center Research Institute, 5-1-1, Tsukiji, Chuo-ku, Tokyo, 104-0045, Japan. E-mail: shirohas@ncc.go.jp.
Supported by a Grant-Aid for the Second Term Comprehensive 10-Year Strategy for Cancer Control from the Ministry of Health, Labor, and Welfare of Japan; the Program for Promotion of Fundamental Studies in Health Sciences of the Organization for Pharmaceutical Safety and Research; and the Foundation for Promotion of Cancer Research (research resident fellowships to A. T. and M. C.).
References
- 1.Scully RE, Young RH, Clement PB: Rosai J eds. Tumors of the Ovary, Maldeveloped Gonads, Fallopian Tube, and Broad Ligament. 1999:pp 27-50 Armed Forces Institute of Pathology Washington DC
- 2.Piver MS: Ovarian carcinoma. A decade of progress. Cancer 1984, 54:2706-2715 [DOI] [PubMed] [Google Scholar]
- 3.Parmar MKB, Adams M, Balestrino M, Bertelsen K, Bonazzi C, Calvert H, Colombo N, Delaloye JF, Durando A, Guthrie D, Hagen B, Harper P, Mangioni C, Perren T, Poole C, Qian W, Rustin G, Sandercock J, Tumolo S, Torri V, Vecchione F, Tinazzi A, Uscinska B, Collins S, Flann M, Buda A, Taylor B, Tannock I, Souhami R, Granzia-Valsecchi M: Paclitaxel plus carboplatin versus standard chemotherapy with either single-agent carboplatin or cyclophosphamide, doxorubicin, and cisplatin in women with ovarian cancer: the ICON3 randomised trial. Lancet 2002, 360:505-515 [DOI] [PubMed] [Google Scholar]
- 4.Tammela J, Geisler JP, Eskew PN, Jr, Geisler HE: Clear cell carcinoma of the ovary: poor prognosis compared to serous carcinoma. Eur J Gynaecol Oncol 1998, 19:438-440 [PubMed] [Google Scholar]
- 5.O’Brien ME, Schofield JB, Tan S, Fryatt I, Fisher C, Wiltshaw E: Clear cell epithelial ovarian cancer (mesonephroid): bad prognosis only in early stages. Gynecol Oncol 1993, 49:250-254 [DOI] [PubMed] [Google Scholar]
- 6.Goff BA, Sainz de la Cuesta R, Muntz HG, Fleischhacker D, Ek M, Rice LW, Nikrui N, Tamimi HK, Cain JM, Greer BE, Fuller AF, Jr: Clear cell carcinoma of the ovary: a distinct histologic type with poor prognosis and resistance to platinum-based chemotherapy in stage III disease. Gynecol Oncol 1996, 60:412-417 [DOI] [PubMed] [Google Scholar]
- 7.Sugiyama T, Kamura T, Kigawa J, Terakawa N, Kikuchi Y, Kita T, Suzuki M, Sato I, Taguchi K: Clinical characteristics of clear cell carcinoma of the ovary: a distinct histologic type with poor prognosis and resistance to platinum-based chemotherapy. Cancer 2000, 88:2584-2589 [PubMed] [Google Scholar]
- 8.Okuda T, Otsuka J, Sekizawa A, Saito H, Makino R, Kushima M, Farina A, Kuwano Y, Okai T: p53 mutations and overexpression affect prognosis of ovarian endometrioid cancer but not clear cell cancer. Gynecol Oncol 2003, 88:318-325 [DOI] [PubMed] [Google Scholar]
- 9.Okada S, Tsuda H, Takarabe T, Yoshikawa H, Taketani Y, Hirohashi S: Allelotype analysis of common epithelial ovarian cancers with special reference to comparison between clear cell adenocarcinoma with other histological types. Jpn J Cancer Res 2002, 93:798-806 [DOI] [PMC free article] [PubMed] [Google Scholar]
- 10.Shimizu M, Nikaido T, Toki T, Shiozawa T, Fujii S: Clear cell carcinoma has an expression pattern of cell cycle regulatory molecules that is unique among ovarian adenocarcinomas. Cancer 1999, 85:669-677 [DOI] [PubMed] [Google Scholar]
- 11.Hough CD, Cho KR, Zonderman AB, Schwartz DR, Morin PJ: Coordinately up-regulated genes in ovarian cancer. Cancer Res 2001, 61:3869-3876 [PubMed] [Google Scholar]
- 12.Velculescu VE, Zhang L, Vogelstein B, Kinzler KW: Serial analysis of gene expression. Science 1995, 270:484-487 [DOI] [PubMed] [Google Scholar]
- 13.Schena M, Shalon D, Davis RW, Brown PO: Quantitative monitoring of gene expression patterns with a complementary DNA microarray. Science 1995, 270:467-470 [DOI] [PubMed] [Google Scholar]
- 14.Lockhart DJ, Dong H, Byrne MC, Follettie MT, Gallo MV, Chee MS, Mittmann M, Wang C, Kobayashi M, Horton H, Brown EL: Expression monitoring by hybridization to high-density oligonucleotide arrays. Nat Biotechnol 1996, 14:1675-1680 [DOI] [PubMed] [Google Scholar]
- 15.Golub TR, Slonim DK, Tamayo P, Huard C, Gaasenbeek M, Mesirov JP, Coller H, Loh ML, Downing JR, Caligiuri MA, Bloomfield CD, Lander ES: Molecular classification of cancer: class discovery and class prediction by gene expression monitoring. Science 1999, 286:531-537 [DOI] [PubMed] [Google Scholar]
- 16.Higgins JP, Shinghal R, Gill H, Reese JH, Terris M, Cohen RJ, Fero M, Pollack JR, van de Rijn M, Brooks JD: Gene expression patterns in renal cell carcinoma assessed by complementary DNA microarray. Am J Pathol 2003, 162:925-932 [DOI] [PMC free article] [PubMed] [Google Scholar]
- 17.Varambally S, Dhanasekaran SM, Zhou M, Barrette TR, Kumar-Sinha C, Sanda MG, Ghosh D, Pienta KJ, Sewalt RG, Otte AP, Rubin MA, Chinnaiyan AM: The polycomb group protein EZH2 is involved in progression of prostate cancer. Nature 2002, 419:624-629 [DOI] [PubMed] [Google Scholar]
- 18.Wang K, Gan L, Jeffery E, Gayle M, Gown AM, Skelly M, Nelson PS, Ng WV, Schummer M, Hood L, Mulligan J: Monitoring gene expression profile changes in ovarian carcinomas using cDNA microarray. Gene 1999, 229:101-108 [DOI] [PubMed] [Google Scholar]
- 19.Hough CD, Sherman-Baust CA, Pizer ES, Montz FJ, Im DD, Rosenshein NB, Cho KR, Riggins GJ, Morin PJ: Large-scale serial analysis of gene expression reveals genes differentially expressed in ovarian cancer. Cancer Res 2000, 60:6281-6287 [PubMed] [Google Scholar]
- 20.Ono K, Tanaka T, Tsunoda T, Kitahara O, Kihara C, Okamoto A, Ochiai K, Takagi T, Nakamura Y: Identification by cDNA microarray of genes involved in ovarian carcinogenesis. Cancer Res 2000, 60:5007-5011 [PubMed] [Google Scholar]
- 21.Welsh JB, Zarrinkar PP, Sapinoso LM, Kern SG, Behling CA, Monk BJ, Lockhart DJ, Burger RA, Hampton GM: Analysis of gene expression profiles in normal and neoplastic ovarian tissue samples identifies candidate molecular markers of epithelial ovarian cancer. Proc Natl Acad Sci USA 2001, 98:1176-1181 [DOI] [PMC free article] [PubMed] [Google Scholar]
- 22.Schwartz DR, Kardia SL, Shedden KA, Kuick R, Michailidis G, Taylor JM, Misek DE, Wu R, Zhai Y, Darrah DM, Reed H, Ellenson LH, Giordano TJ, Fearon ER, Hanash SM, Cho KR: Gene expression in ovarian cancer reflects both morphology and biological behavior, distinguishing clear cell from other poor-prognosis ovarian carcinomas. Cancer Res 2002, 62:4722-4729 [PubMed] [Google Scholar]
- 23.Fire A, Xu S, Montgomery MK, Kostas SA, Driver SE, Mello CC: Potent and specific genetic interference by double-stranded RNA in Caenorhabditis elegans. Nature 1998, 391:806-811 [DOI] [PubMed] [Google Scholar]
- 24.Kennerdell JR, Carthew RW: Use of dsRNA-mediated genetic interference to demonstrate that frizzled and frizzled 2 act in the wingless pathway. Cell 1998, 95:1017-1026 [DOI] [PubMed] [Google Scholar]
- 25.Elbashir SM, Harborth J, Lendeckel W, Yalcin A, Weber K, Tuschl T: Duplexes of 21-nucleotide RNAs mediate RNA interference in cultured mammalian cells. Nature 2001, 411:494-498 [DOI] [PubMed] [Google Scholar]
- 26.Serov SF, Scully RE, Sobin LH: Histologic typing of ovarian tumors. International Histologic Classification of Tumors, no. 9 1973. World Health Organization Geneva
- 27.Lazzaro D, De Simone V, De Magistris L, Lehtonen E, Cortese R: LFB1 and LFB3 homeoproteins are sequentially expressed during kidney development. Development 1992, 114:469-479 [DOI] [PubMed] [Google Scholar]
- 28.Wang W, Hayashi Y, Ninomiya T, Ohta K, Nakabayashi H, Tamaoki T, Itoh H: Expression of HNF-1 alpha and HNF-1 beta in various histological differentiations of hepatocellular carcinoma. J Pathol 1998, 184:272-278 [DOI] [PubMed] [Google Scholar]
- 29.Bach I, Yaniv M: More potent transcriptional activators or a transdominant inhibitor of the HNF1 homeoprotein family are generated by alternative RNA processing. EMBO J 1993, 12:4229-4242 [DOI] [PMC free article] [PubMed] [Google Scholar]
- 30.Le QT, Sutphin PD, Raychaudhuri S, Yu SC, Terris DJ, Lin HS, Lum B, Pinto HA, Koong AC, Giaccia AJ: Identification of osteopontin as a prognostic plasma marker for head and neck squamous cell carcinomas. Clin Cancer Res 2003, 9:59-67 [PMC free article] [PubMed] [Google Scholar]
- 31.Ye QH, Qin LX, Forgues M, He P, Kim JW, Peng AC, Simon R, Li Y, Robles AI, Chen Y, Ma ZC, Wu ZQ, Ye SL, Liu YK, Tang ZY, Wang XW: Predicting hepatitis B virus-positive metastatic hepatocellular carcinomas using gene expression profiling and supervised machine learning. Nat Med 2003, 9:416-423 [DOI] [PubMed] [Google Scholar]
- 32.Kim JH, Skates SJ, Uede T, Wong KK, Schorge JO, Feltmate CM, Berkowitz RS, Cramer DW, Mok SC: Osteopontin as a potential diagnostic biomarker for ovarian cancer. JAMA 2002, 287:1671-1679 [DOI] [PubMed] [Google Scholar]
- 33.Kassem H, Sangar V, Cowan R, Clarke N, Margison GP: A potential role of heat shock proteins and nicotinamide N-methyl transferase in predicting response to radiation in bladder cancer. Int J Cancer 2002, 101:454-460 [DOI] [PubMed] [Google Scholar]
- 34.Clark JB, Ferris GM, Pinder S: Inhibition of nuclear NAD nucleosidase and poly ADP-ribose polymerase activity from rat liver by nicotinamide and 5′-methyl nicotinamide. Biochim Biophys Acta 1971, 238:82-85 [DOI] [PubMed] [Google Scholar]
- 35.Zannini M, Francis-Lang H, Plachov D, Di Lauro R: Pax-8, a paired domain-containing protein, binds to a sequence overlapping the recognition site of a homeodomain and activates transcription from two thyroid-specific promoters. Mol Cell Biol 1992, 12:4230-4241 [DOI] [PMC free article] [PubMed] [Google Scholar]
- 36.Poleev A, Fickenscher H, Mundlos S, Winterpacht A, Zabel B, Fidler A, Gruss P, Plachov D: PAX8, a human paired box gene: isolation and expression in developing thyroid, kidney and Wilms’ tumors. Development 1992, 116:611-623 [DOI] [PubMed] [Google Scholar]
- 37.Maulbecker CC, Gruss P: The oncogenic potential of Pax genes. EMBO J 1993, 12:2361-2367 [DOI] [PMC free article] [PubMed] [Google Scholar]
- 38.Ogawa S, Kaku T, Amada S, Kobayashi H, Hirakawa T, Ariyoshi K, Kamura T, Nakano H: Ovarian endometriosis associated with ovarian carcinoma: a clinicopathological and immunohistochemical study. Gynecol Oncol 2000, 77:298-304 [DOI] [PubMed] [Google Scholar]
- 39.Feeley KM, Wells M: Precursor lesions of ovarian epithelial malignancy. Histopathology 2001, 38:87-95 [DOI] [PubMed] [Google Scholar]
- 40.Courtois G, Baumhueter S, Crabtree GR: Purified hepatocyte nuclear factor 1 interacts with a family of hepatocyte-specific promoters. Proc Natl Acad Sci USA 1988, 85:7937-7941 [DOI] [PMC free article] [PubMed] [Google Scholar]
- 41.Cereghini S, Blumenfeld M, Yaniv M: A liver-specific factor essential for albumin transcription differs between differentiated and dedifferentiated rat hepatoma cells. Genes Dev 1988, 2:957-974 [DOI] [PubMed] [Google Scholar]
- 42.Rey-Campos J, Chouard T, Yaniv M, Cereghini S: vHNF1 is a homeoprotein that activates transcription and forms heterodimers with HNF1. EMBO J 1991, 10:1445-1457 [DOI] [PMC free article] [PubMed] [Google Scholar]
- 43.Pontoglio M: Hepatocyte nuclear factor 1, a transcription factor at the crossroads of glucose homeostasis. J Am Soc Nephrol 2000, 11(Suppl 16):S140-S143 [PubMed] [Google Scholar]
- 44.Horikawa Y, Iwasaki N, Hara M, Furuta H, Hinokio Y, Cockburn BN, Lindner T, Yamagata K, Ogata M, Tomonaga O, Kuroki H, Kasahara T, Iwamoto Y, Bell GI: Mutation in hepatocyte nuclear factor-1 beta gene (TCF2) associated with MODY. Nat Genet 1997, 17:384-385 [DOI] [PubMed] [Google Scholar]
- 45.Wobser H, Dussmann H, Kogel D, Wang H, Reimertz C, Wollheim CB, Byrne MM, Prehn JH: Dominant-negative suppression of HNF-1 alpha results in mitochondrial dysfunction, INS-1 cell apoptosis, and increased sensitivity to ceramide-, but not to high glucose-induced cell death. J Biol Chem 2002, 277:6413-6421 [DOI] [PubMed] [Google Scholar]
- 46.Song E, Lee SK, Wang J, Ince N, Ouyang N, Min J, Chen J, Shankar P, Lieberman J: RNA interference targeting Fas protects mice from fulminant hepatitis. Nat Med 2003, 9:347-351 [DOI] [PubMed] [Google Scholar]
- 47.Rubinson DA, Dillon CP, Kwiatkowski AV, Sievers C, Yang L, Kopinja J, Zhang M, McManus MT, Gertler FB, Scott ML, Van Parijs L: A lentivirus-based system to functionally silence genes in primary mammalian cells, stem cells and transgenic mice by RNA interference. Nat Genet 2003, 33:401-406 [DOI] [PubMed] [Google Scholar]
- 48.Ishibashi H, Nakagawa K, Onimaru M, Castellanous EJ, Kaneda Y, Nakashima Y, Shirasuna K, Sueishi K: Sp1 decoy transfected to carcinoma cells suppresses the expression of vascular endothelial growth factor, transforming growth factor beta1, and tissue factor and also cell growth and invasion activities. Cancer Res 2000, 60:6531-6536 [PubMed] [Google Scholar]