

Abstract
Current paradigms hold that lung carcinomas arise from pleuripotent stem cells capable of differentiation into one or several histological types. These paradigms suggest lung tumor cell ontogeny is determined by consequences of gene expression that recapitulate events important in embryonic lung development. Using oligonucleotide microarrays, we acquired gene profiles from 32 microdissected non-small-cell lung tumors. We determined the 100 top-ranked marker genes for adenocarcinoma, squamous cell, large cell, and carcinoid using nearest neighbor analysis. Results were validated by immunostaining for 11 selected proteins using a tissue microarray representing 80 tumors. Gene expression data of lung development were accessed from a publicly available dataset generated with the murine Mu11k genome microarray. Self-organized mapping identified two temporally distinct clusters of murine orthologues. Supervised clustering of lung development data showed large-cell carcinoma gene orthologues were in a cluster expressed in pseudoglandular and canalicular stages whereas adenocarcinoma homologues were predominantly in a cluster expressed later in the terminal sac and alveolar stages of murine lung development. Representative large-cell genes (E2F3, MYBL2, HDAC2, CDK4, PCNA) are expressed in the nucleus and are associated with cell cycle and proliferation. In contrast, adenocarcinoma genes are associated with lung-specific transcription pathways (SFTPB, TTF-1), cell adhesion, and signal transduction. In sum, non-small-cell lung tumors histology gene profiles suggest mechanisms relevant to ontogeny and clinical course. Adenocarcinoma genes are associated with differentiation and glandular formation whereas large-cell genes are associated with proliferation and differentiation arrest. The identification of developmentally regulated pathways active in tumorigenesis provides insights into lung carcinogenesis and suggests early steps may differ according to the eventual tumor morphology.
Lung cancer, the leading cause of cancer death in the United States with 157,200 deaths expected in 2003, is also the leading cause of cancer death worldwide with 1.1 million annual deaths. 1,2 The lung cancer 5-year-survival rate has remained ∼13 to 15% throughout the past 3 decades despite innovations in diagnostic testing, surgical technique, and development of new chemotherapeutic agents. In contrast, the survival rates for other common neoplasms (breast, prostate, and colorectal carcinoma) for which similar principles of diagnosis, staging, resection, and chemotherapy are applied, have improved dramatically. Although survival improvements in breast, prostate, and colorectal cancers may be associated with effective early detection screening programs, it is possible that the poor outcomes of lung cancer are also attributable to fundamental differences in tumor biology. Unlike breast, colorectal, and prostate malignancies that are predominantly adenocarcinomas, lung cancer histology is heterogeneous. Adenocarcinoma comprises 40% of all lung cancers. 3 Other histological types of lung carcinoma include small-cell carcinoma and non-small-cell lung carcinoma types squamous and large cell, and carcinoid.
Within non-small-cell lung carcinoma, the case distribution of histology has changed throughout time. Throughout the past 3 decades the incidence of squamous cell carcinoma has decreased while the incidence of adenocarcinoma has increased. The change in histological distribution coincides with the introduction of cigarette filters, suggesting that differences in particle composition and in anatomical distribution of tobacco carcinogens associated with cigarette filters may increase rates of adenocarcinoma, a tumor known to arise in distal portions of the airway and alveolus. 4
Current paradigms hold that lung carcinomas arise from pleuripotent stem cells capable of differentiation into one or several histological cell types. These paradigms suggest that lung tumor cell ontogeny is determined by the consequences of gene transcriptional activation and/or repression events that recapitulate events important in embryonic lung development. 5 Recent research examining lung development in model organisms such as Drosophila melanogaster and Mus musculus has identified conserved genes and signaling events, 6 many of which have been implicated in carcinogenesis. In humans, the lung is derived from the endodermal foregut. The earliest events are ventral outpouching of the foregut, budding, and branching. Studies in Drosophila indicate that branchless (homologue of FGF-10), breathless (homologue of FGFR-2), sprouty (antagonist of FGF signaling), and trachealess (homologue of HIF-1α) encode proteins that mediate primary branching. Subsequent molecular events in branching morphogenesis and alveolarizaton have been examined in rodent models and are organized temporally into stages. Stages of murine lung development include: 1) pseudoglandular (E9.5 to E16.6); 2) canalicular stage (E16.6 to E17.4); 3) terminal sac stage (E17.4 to postnatal day 5); and 4) alveolar stage (P5 to P30). 7 These developmental processes, in part, are mediated by the sonic hedgehog pathway, lung transcription factors such as TTF-1, and peptide growth factor-signaling pathways.
We hypothesized that genes specifically expressed in non-small-cell lung carcinoma histological classes would be associated with developmentally regulated genes and pathways. These associations might provide novel insights into early events in lung carcinogenesis and tumor ontogeny. In this study, we identified gene marker sets associated with lung tumor histology and determined the expression of murine orthologues of these genes in normal mouse lung development. The adenocarcinoma gene marker set was associated with gene expression in the terminal sac and alveolar stages of murine development whereas the large-cell carcinoma set was associated with genes expressed in earlier pseudoglandular and canalicular stages. The large-cell carcinoma gene set includes a preponderance of genes associated with cellular proliferation and cell-cycle regulation, whereas adenocarcinoma genes were associated with differentiation and signal transduction.
Materials and Methods
Tissue specimens obtained at lung cancer resection surgery were snap-frozen and stored at − 80°C in the Tumor Bank Facility of Columbia University’s Cancer Center. Specimens from 32 cases of non-small-cell lung carcinomas were cryostat-sectioned and mounted as 10-μm sections. Sections were fixed in 95% ethanol, stained with eosin, dehydrated, and air-dried. Uncoverslipped sections were examined microscopically at ×40 and neoplastic cells were microdissected with a 20-gauge needle. The microdissected areas of tumor were collected directly into guanidine thiocyanate for RNA extraction, using the RNeasy Mini Kit (Qiagen, Valencia, CA) following the manufacturer’s protocol. Digital photomicrographs were obtained of serial sections before and after microdissection. Between 10 and 12 sections were dissected per case to obtain a minimum of 2 μg of total RNA. In addition, RNA was extracted from whole sections cut from adjacent nonmalignant lung (histology confirmed microscopically) in seven lung cancer patients. Clinical information for the patients was obtained from the medical record and from patients’ physicians (Table 1) ▶ . Tumor specimens were reviewed by two pathologists and classified using the World Health Organization lung tumor classification scheme. 3 In cases in which there was a discrepancy in histological classification, the slides were reviewed by a third pathologist and consensus was reached. All procedures were approved by the Columbia Presbyterian Medical Center Institutional Review Board.
Table 1.
Characteristics of Patients
| Histology | Specimen ID | Differentiation | Stage | Gender | Age | |||||
|---|---|---|---|---|---|---|---|---|---|---|
| Adenocarcinoma | ||||||||||
| AD20009 | Poor | T2N0 | Male | 62 | ||||||
| AD20014 | Moderate | T2N0 | Female | 73 | ||||||
| AD20033 | Moderate | T2N2 | Male | 62 | ||||||
| AD21001 | Well | T1N0 | Male | 63 | ||||||
| AD21002 | Well | T2N1 | Female | 39 | ||||||
| AD21006 | Poor | T1N0 | Female | 77 | ||||||
| AD21011 | Moderate | T1N2 | Female | 56 | ||||||
| AD21012 | Poor | T2N0 | Female | 68 | ||||||
| AD21013 | Well | T1N0 | Male | 67 | ||||||
| AD21014 | Poor | T1N0 | Female | 51 | ||||||
| AD22003 | Moderate | T2N0 | Female | 59 | ||||||
| AD22005 | Moderate | T1N0 | Male | 68 | ||||||
| AD22009 | Moderate | T1N0 | Female | 82 | ||||||
| AD22010 | Well | T2N2 | Female | 77 | ||||||
| AD99015 | Poor | T1N0 | Female | 66 | ||||||
| AD99034 | Moderate | T2N0 | Female | 79 | ||||||
| AD99035 | Poor | T2N1 | Female | 70 | ||||||
| AD99043 | Well | T1N0 | Female | 56 | ||||||
| Bronchioloalveloar | ||||||||||
| AD22011 | Well | T1N0 | Female | 56 | ||||||
| Carcinoid | ||||||||||
| COID21003 | Typical | T1N0 | Male | 56 | ||||||
| COID21010 | Typical | T2N0 | Female | 71 | ||||||
| COID22019 | Atypical | T2N1 | Male | 82 | ||||||
| COID98461 | Typical | T1N0 | Male | 64 | ||||||
| Large cell | ||||||||||
| LG21004 | Poor | T2N1 | Male | 71 | ||||||
| LG21021 | Poor | T2N0 | Male | 78 | ||||||
| LG21022 | Poor | T2N0 | Male | 74 | ||||||
| LG21023 | Poor | T2N0 | Male | 81 | ||||||
| Squamous | ||||||||||
| SQ22002 | Moderate | T1N0 | Male | 83 | ||||||
| SQ22004 | Poor | T2N1 | Female | 74 | ||||||
| SQ22016 | Moderate | T2N1 | Male | 71 | ||||||
| SQ99011 | Poor | T2N0 | Male | 63 | ||||||
| SQ99014 | Poor | T2N0 | Male | 65 | ||||||
| Nonmalignant | ||||||||||
| N20003 | Female | 70 | ||||||||
| N21023 | Male | 81 | ||||||||
| N99014 | Male | 65 | ||||||||
| N20028 | Female | 66 | ||||||||
| N99034 | Female | 79 | ||||||||
| N99035 | Female | 70 | ||||||||
| N99015 | Female | 66 | ||||||||
Target cRNA preparation followed standard procedures recommended by Affymetrix (Santa Clara, CA). 8 cRNA was hybridized to the Affymetrix U95Av2 DNA array that contains probes for ∼12,600 human genes. Raw data were analyzed with Affymetrix Microarray Suite v5.0 and were scaled to a target intensity of 250 to facilitate interarray comparisons. Expression data were filtered to remove genes uniformly expressed at low-intensity levels or genes that did not show variation across samples. Genes without raw intensity values >25 in at least four samples or genes that were not present in at least four samples were excluded. In addition, a SD filter set at 0.5 was applied, leaving 4631 genes. To normalize intensity values, a fixed value of 250 was specified; all of the measurements in each sample were divided by this value. Each gene was divided by the median of its measurements in all samples. If the median of the raw values was less than 10, then each measurement for that gene was divided by 10.
Clustering
Hierarchical dendrograms were generated with CLUSTER and TREEVIEW programs using median-centered average linkage unsupervised clustering of log transformed data. 9 Supervised clustering was performed using GENECLUSTER program, 10 available at http://www.genome.wi.mit.edu/cancer/software/genecluster2/gc2.html. Gene marker lists associated with histological subtypes or with lung developmental stage (group 1, embryonic days 12 to18; group 2, postnatal day 1 to adult) were ranked using nearest neighbor t-test statistic based on median gene expression. The significance of the score for each gene was assessed by randomly permuting the class assignments 500 times. Self-organized mapping was performed using GeneSpring (Silicon Genetics, Redwood City, CA).
Annotation
Functional annotations were provided by GO Biological Process (http://www.affymetrix.com/analysis/index.affx) and by Swiss-Prot. protein knowledge base (http://us.expasy.org/sprot/). Biological pathway annotation was provided by GenMAPP (http://www.genmapp.org).
Mouse Lung Development
Gene expression data of murine lung development was obtained from the publicly available database: http://lungtranscriptome.bwh.harvard.edu/. 11 Raw data generated from the Affymetrix Mu11k array set were normalized as follows. Each measurement was divided by the 50th percentile of all measurements in that sample. The percentile was calculated with all normalized measurements greater than 10 for genes not marked absent. For specimens in which the bottom 10th percentile was less than the negative of the 50th percentile, it was used as background, and subtracted from all of the other genes first. Each gene was divided by the median of its measurements in all samples. If the median of the normalized values was less than 0.01 then each measurement for that gene was divided by 0.01. Values less than 0 were set to 0. Murine orthologues of human non-small-cell lung cancer class gene markers were identified using Resourcerer v.4.0 (http://pga.tigr.org/tigr-scripts/magic/r1.pl). We identified 322 probe sets on the Mu11k array matching 189 human genes (supplemental Table S1). The data were log-transformed before self-organized mapping to construct a 2 × 1 table with 1000 iterations. The murine gene-expression data set was filtered to exclude 22 probes that did not have an orthologue in the tumor histology classes.
Tissue Microarrays
We used a tissue arrayer device (MTA-1; Beecher Instruments, Sun Prairie, WI) to construct the tissue microarrays (TMA) with cores from 80 non small-cell lung tumors. All lung cancer cases were histologically reviewed and the areas representative of histological subtype were marked in the paraffin blocks. In each case, two selected 1-mm-diameter cylinders from two different areas were included. Included also in each TMA were two cylinders representing nonmalignant lung tissue from blocks of randomly sampled lung from each tumor resection. Thus, four different TMA blocks were constructed, each containing 120 cylinders from 20 tumors.
Immunohistochemistry
TMA blocks were sectioned at a thickness of 5 μm and dewaxed in xylene and rehydrated through a graded ethanol series and washed with phosphate-buffered saline. Four tumors not included in the TMA were examined using 5-μm sections cut from paraffin-embedded tissue (two squamous tumors and two large-cell tumors). Antigen retrieval was achieved by heat treatment in a microwave for 10 minutes in 10 mmol/L citrate buffer (pH 6.5). Before staining the sections, endogenous peroxidase was quenched.
Immunohistochemical staining was performed on these sections using 11 different antibodies (Abs). The staining of the sections was evaluated by a pathologist (ACB) using uniform criteria. The staining of each antibody was recorded as negative (score 0), low positive (multifocal or diffuse faint staining, score 1), or high expression (multifocal or diffuse strong staining, score 2) with uniform cutoffs for all markers. For TTF-1, tumor protein 63, cyclinD1, CDK4, and histone deacetylase 2, only nuclear staining was scored. For keratin 5, integrin α3, docking protein 1, syndecan-1, and singed-like, only cytoplasmic/membranous staining was scored. For epidermal growth factor (EGF) receptor, only membranous staining was scored.
Results
Unsupervised Clustering
Samples derived from nonmalignant lung tissue cluster together (Figure 1A) ▶ . A bronchioloalveolar cell carcinoma, AD22011, clusters as a subbranch within the nonmalignant sample clade. As bronchioloalveolar cell carcinoma may represent a well-differentiated noninvasive tumor, 12 it is possible that the gene profile of this tumor (that straddles pre-existing alveolar walls) bridges that of normal lung and more invasive adenocarcinomas, as has been shown in other gene profile studies. 13
Figure 1.

Unsupervised clustering hierarchical dendrograms are determined by histology and morphology. A: Dendrogram of entire set of 39 specimens. Underlined specimen AD22011 is a well-differentiated bronchioloalveolar carcinoma that segregates within clade of nonmalignant specimens. B: Dendrogram of 32 tumor specimens. Restricting the clustering to tumor specimens, lung carcinomas cluster into four clades that are associated with histology. Placement of outlier specimens (underlined) with histology classification dissimilar from other members in the clade can be explained by examination of histological sections.
Because we were interested in genes that discriminate between lung cancer histological types and because genes that distinguish these classes may be expressed in normal lung, we examined unsupervised clustering of histology using only tumor samples. Thus, we eliminated gene expression in normal lung tissue as a confounding factor in the detection of gene expression differences between histological classes of tumors.
Restricting the clustering to tumor specimens, lung carcinomas cluster into four clades that are associated with histology (Figure 1B) ▶ . Placement of outlier specimens with histology classification dissimilar from others members in the clade can be explained by examination of histological sections. Clade 1 includes four of five squamous cell carcinomas and one adenocarcinoma, AD22005 (Figure 2, A and B) ▶ . The histological section of this adenocarcinoma demonstrates areas of squamous differentiation lying within a predominantly glandular tumor. Although these areas represent less than 10% of the total tumor, they may have influenced the gene profile to include genes that otherwise were seen predominantly in squamous carcinomas. A designation of adenosquamous carcinoma would require more than 10% squamous differentiation. Clade 2 includes four tightly clustered carcinoid specimens that, within the same clade, cluster separately from three large-cell carcinomas and an adenocarcinoma, AD21014. This tumor has gland-forming areas (Figure 2C) ▶ as well as areas of poorly differentiated growth (Figure 2D) ▶ ; neuroendocrine markers synaptophysin and chromogranin are negative. The presence of glands led to the designation as an adenocarcinoma. Another feature of clade 2 is the inclusion of two subgroups—one with four carcinoids and the other with three large-cell tumors. This might be explained by the presence of neuroendocrine differentiation in the large-cell tumors, a feature in common with carcinoid tumors. Clade 3 includes a subset of adenocarcinomas with one large-cell carcinoma, LG21004. This tumor shows solid and organoid growth with central necrosis (Figure 2E) ▶ and strong and diffuse reactivity for synaptophysin and chromogranin, leading to its designation as a large-cell neuroendocrine carcinoma. A minority of the tumor shows cribriform gland-like structures (Figure 2F) ▶ , possibly accounting for the tumor’s segregation into a clade with adenocarcinomas. Within clade 4 is one squamous cell carcinoma, SQ22002 (Figure 2, G and H) ▶ . In this case, the majority of the tumor is a squamous cell carcinoma, with only a rare field showing glandular differentiation. Review of the two adenocarcinoma cases AD22009 (Figure 2, I and J) ▶ and AD20009 (Figure 2, K and L) ▶ in the same subbranch of the clade shows tumors with a majority of adenocarcinoma patterns (Figure 2, I and K) ▶ and areas of squamous differentiation. None of these tumors were classified as adenosquamous because the minority pattern represents less than 10% of the total tumor. Other unsupervised clustering experiments have demonstrated that, although tumor morphology may account for clustering, it is probable there are other biological and/or clinically associated variables that contribute to determine specimen-clustering patterns.
Figure 2.
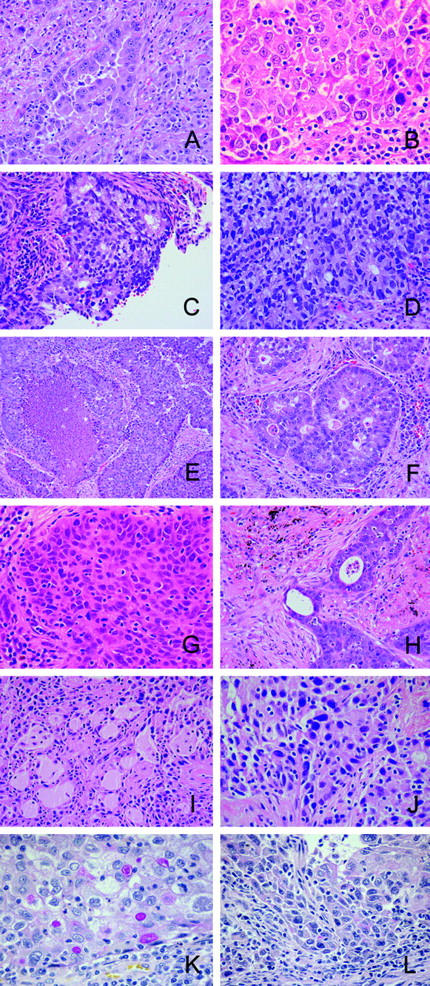
Photomicrographs of underlined tumors from dendrogram in Figure 1B ▶ . A and B: AD22005 from clade 1 segregated with squamous carcinomas. A: A gland-forming adenocarcinoma containing small areas of squamous differentiation (B), which accounted for less than 10% of the tumor’s morphology. C and D: AD21014 from clade 2 segregated with large-cell carcinomas. C: Gland-forming areas that comprised more than 10% of the tumor’s morphology. The remainder of the tumor showed poor differentiation (D) similar to the large-cell tumors. E and F: LG21004 from clade 3 segregated with adenocarcinomas. The tumor morphology showed large-cell features of organoid growth with central necrosis (E) and strong reactivity for neuroendocrine markers synaptophysin and chromogranin (data not shown). A minority of the tumor showed cribiform gland structures (F). G–L: Clade 4 contained one squamous cell carcinoma SQ22002 (G) with rare fields showing glandular differentiation (H) and two adenocarcinomas AD22009 and AD20009, which showed a majority of adenocarcinoma pattern (I and K, respectively) as well as areas of squamous differentiation (J and L, respectively). A–J, H&E stain; K and L, mucicarmine stain. Original magnifications: ×50 (E); ×100 (A, C, D, F, H, I); ×150 (B, G, J–L).
Supervised Clustering
To identify genes associated with histology, we performed supervised clustering using nearest neighbor analysis with a t-test metric. This methodology permits the assignment of genes to classes in a statistically robust manner and reduces the problems introduced by multiple comparisons in nonparametric testing procedures. 14 For the initial analysis we set up two classes, tumor and nonmalignant lung. We arbitrarily selected a marker set size of 250 and determined that the median score of all genes was greater than the score after 500 random permutations, with P < 0.05, suggesting that the class assignment was statistically significant (Table S2). For our primary analysis to determine gene marker sets associated with specific histological subtypes, we limited our analysis to the 32 tumor specimens and selected a marker set size of 100 per class. All genes per class had scores with P < 0.05 after 500 permutations (Figure 3A ▶ and ▶ Table 2 ▶ ).
Figure 3.
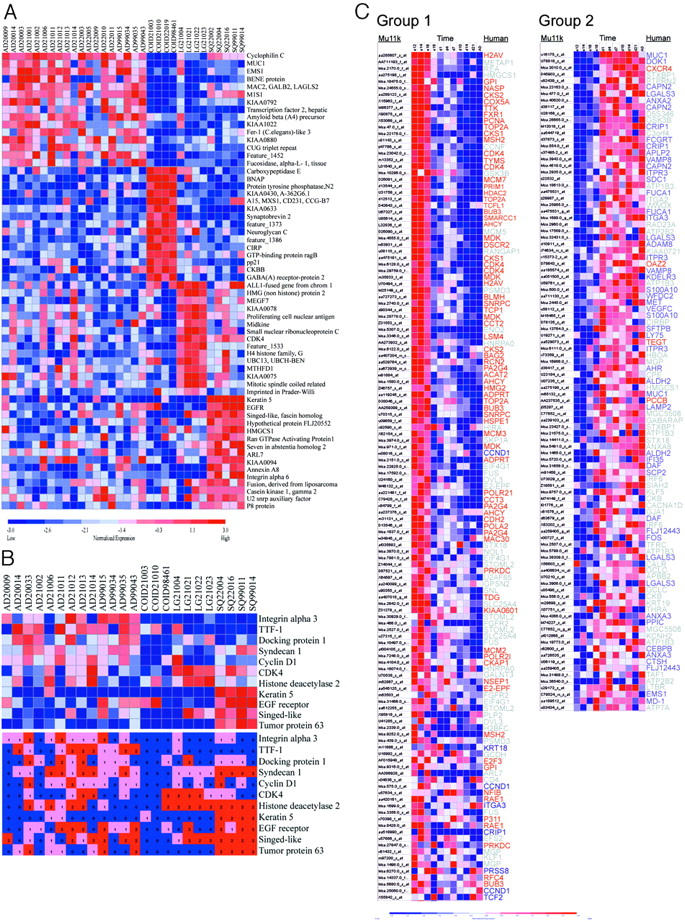
Histological class gene marker sets determined by nearest neighbor supervised clustering. A: Nearest neighbor analysis with a t-test metric was used to identify and rank 100 gene markers for each non-small-cell lung cancer histology class relative to other classes (Table 2) ▶ . The top 15 markers per histology are shown. For each gene, red indicates a high level of expression relative to the median and blue indicates a low level of expression relative to the median. B: Validation of gene marker sets with immunohistochemistry. Eleven proteins for which antibodies previously used on paraffin sections were commercially available were selected. Top: Supervised clustering diagram excerpts from Figure 3A ▶ . Bottom: Antibody reactivity for each sample. For each protein, blue, pink, and red indicate a score of 0 (negative), 1 (low positive), and 2 (high positive), respectively. C: Nearest neighbor analysis was used to classify and rank Mu11k gene markers associated with two temporally associated gene groups. Genes were filtered to remove 22 murine genes without a human orthologue in the histology marker sets. Shown are expression profiles for group 1 (left) and for group 2 (right) genes that were more highly associated with group distinction than 95% of random permutations of the group labels (P < 0.05). Lung development stages represented by group 1 (days E12 to E18)- and group 2 (postnatal D1 to adult)-expressed genes are pseudoglandular/canalicular and terminal sac/alveolar, respectively. Each row shows gene expression throughout time for murine genes. The corresponding human histology gene orthologues for large-cell carcinoma are indicated in red, adenocarcinoma in blue. Other gene labels for carcinoid and squamous carcinomas are indicated in gray.
Table 2.
Top 100 Ranked Genes for Histology, as Determined by Nearest Neighbor Analysis
| Rank | ADENO | CARCINOID | LARGE CELL | SQUAMOUS | ||||
|---|---|---|---|---|---|---|---|---|
| 1 | PPIC | CPE | AF1Q | KRT5 | ||||
| 2 | MUC1 | NAP1L3 | HMGB2 | EGFR | ||||
| 3 | EMS1 | PTPRN2 | LRP4 | SNL | ||||
| 4 | BENE | BC008967 | RAD21 | FLJ20552 | ||||
| 5 | LGALS3 | TM4SF2 | PCNA | HMGCS1 | ||||
| 6 | MEIS3 | COBL | MDK | RANGAP1 | ||||
| 7 | KIAA0792 | VAMP2 | SNRPC | SIAH2 | ||||
| 8 | TCF2 | feature_1373 | CDK4 | ARL7 | ||||
| 9 | APLP2 | CSPG5 | TOP2A | METAP1 | ||||
| 10 | SLC21A9 | CALM1 | H4FG | ANXA8 | ||||
| 11 | FERIL3 | CIRBP | UBE2N | ITGA6 | ||||
| 12 | MYOID | RAGB | MTHFD1 | FUS | ||||
| 13 | CUBPB2 | TCEAL1 | E2F3 | CSNK1G2 | ||||
| 14 | feature_1452 | CKB | SPAG5 | U2AF65 | ||||
| 15 | FUCA1 | GABARAPL2 | IPW | P8 | ||||
| 16 | CD97 | ZNF36 | KIAA0601 | ILF3 | ||||
| 17 | RNS1 | BTBD3 | H2AFZ | TAF1 | ||||
| 18 | TNFSF13 | DDC | MCM7 | DVL3 | ||||
| 19 | ITGA3 | AIP1 | BAG2 | TP63 | ||||
| 20 | GALNT3 | 13CDNA73 | FEN1 | HSD11B1 | ||||
| 21 | MUC1 | FLJ21174 | CSPG6 | TFDP2 | ||||
| 22 | P2RX4 | WWOX | CDH2 | FGFR2 | ||||
| 23 | CAPN2 | DCTN3 | PA2G4 | ANXA2 | ||||
| 24 | AIM1 | feature_3901 | DEK | KRT19 | ||||
| 25 | S100A10 | AKAP11 | PCCB | GCLC | ||||
| 26 | ERBB2 | KCNH2 | EEF1E1 | GPNMB | ||||
| 27 | TTF-1 | TDEIL | LAPTM4B | KLF5 | ||||
| 28 | RGS13 | UBL3 | feature_1629 | NOL1 | ||||
| 29 | CEBPB | ENO2 | CKS1B | GPSN2 | ||||
| 30 | CTSH | Cl8orf1 | PFN2 | GJA1 | ||||
| 31 | HFL1 | AKAP9 | feature_1579 | CNAP1 | ||||
| 32 | CDS1 | KIAA0675 | TEBP | C3orf4 | ||||
| 33 | HRASLS3 | SKP1A | COX6C | LMLNB2 | ||||
| 34 | CAV2 | DP1 | TCFL1 | IL1RAP | ||||
| 35 | CRIP1 | feature_371 | HDAC2 | COMT | ||||
| 36 | KDELR3 | MOX2 | TS | DNASE2 | ||||
| 37 | PNT5 | FXY2 | ILF2 | SLC7A5 | ||||
| 38 | FOS | TOX | feature_2901 | ITGA2 | ||||
| 39 | MEIS3 | CKB | NSEP1 | LTBR | ||||
| 40 | FLJ22182 | DTNA | RFC4 | COPS7A | ||||
| 41 | LY75 | feature_4206 | CKAP1 | PRKX | ||||
| 42 | ADAM8 | Cl3orf1 | MPHOSPH9 | SRRM2 | ||||
| 43 | CASP4 | 13CDNA73 | KHDRBS3 | CX3CL1 | ||||
| 44 | SFTPB | ATP7A | CKS2 | UBE2I | ||||
| 45 | CEACAM6 | CTSF | TCF12 | TP11 | ||||
| 46 | KRT18 | OPTN | MCM2 | TFRC | ||||
| 47 | LAMP2 | THRA | BUB3 | FGFR2 | ||||
| 48 | feature_3382 | NR1D2 | FUBP1 | TIA-2 | ||||
| 49 | PARG1 | NSP | feature_1560 | CSNK1G2 | ||||
| 50 | WFDC2 | SULT4A1 | SMARCC1 | TOMM40 | ||||
| 51 | DOK1 | CALM1 | SRP9 | GALNT3 | ||||
| 52 | MUC1 | SYNJ1 | SFTBP1 | ATP1B3 | ||||
| 53 | BLVRA | RLN2 | ILF3 | IGF1R | ||||
| 54 | SELENBP1 | AES | ZWINT | A4 | ||||
| 55 | SDC1 | KIAA0721 | HSPE1 | ACO2 | ||||
| 56 | SMURF2 | feature_26 | NF1B | feature_2841 | ||||
| 57 | PRSS8 | feature_2440 | TDG | KYNU | ||||
| 58 | VAV1 | CACNA1D | TTK | REL | ||||
| 59 | VAMP8 | KIAA0240 | DSCR2 | NDRG1 | ||||
| 60 | ANXA3 | feature_3310 | TCP1 | FLJ12671 | ||||
| 61 | PRSS16 | TERF2IP | GMPS | FXYD3 | ||||
| 62 | CENTD1 | CGR19 | MCM3 | IGF1R | ||||
| 63 | TNFRSF10B | FGF7 | RCN2 | STK17A | ||||
| 64 | DAF | feature_4554 | KIAA0286 | dJ512B11.1 | ||||
| 65 | ARHD | FLJ11806 | ADPRT | REA | ||||
| 66 | MYO1D | feature_2099 | PRKDC | LMO4 | ||||
| 67 | ITPR3 | STXBP1 | TFDP2 | EXT1 | ||||
| 68 | CDS1 | CGR19 | feature_1868 | PIK3R2 | ||||
| 69 | SLC16A5 | feature_361 | TEGT | GPRC5B | ||||
| (Table continues) | ||||||||
Table 2A.
Continued
| 70 | PIK3CG | H-plk | RNGTT | RFC4 |
|---|---|---|---|---|
| 71 | PDXK | ARPP-19 | RAE1 | MAPK1 |
| 72 | HNPCC6 | KIF3C | VRK1 | GABRE |
| 73 | RELA | HNRPA0 | POLR21 | SNRPF |
| 74 | EPB72 | DXS1283E | SNRPB | EFS2 |
| 75 | ERBB3 | EPB4IL3 | OAZ2 | MGC5508 |
| 76 | ITGA3 | ST7 | GP1 | MYLK |
| 77 | AHR | PQBP1 | MGC5576 | TACC1 |
| 78 | SH3BP5 | SLC9A6 | E2-EPF | HSBFC |
| 79 | SCP-2 | KCNK3 | E2-EPF | ARHE |
| 80 | KIAA0937 | TACC2 | POLA2 | WWP1 |
| 81 | ASAH1 | KIAA0443 | MYBL2 | EIF4G1 |
| 82 | TYROBP | ATP2B2 | MSH2 | TR1P6 |
| 83 | RAI3 | DJ971N18.2 | CXCR4 | CCNF |
| 84 | YAP1 | CGEF2 | TCP1 | MCM5 |
| 85 | IFI35 | SLC25A4 | MAC30 | STHM |
| 86 | PTK6 | feature_3672 | BLMH | XRCC9 |
| 87 | VEGFC | H1FX | ACAT2 | ZNF36 |
| 88 | TCF21 | ATRX | H2AV | GSK3B |
| 89 | FCGRT | KL | TCP1 | PWP1 |
| 90 | MD-1 | MAGED2 | LSM4 | MCC |
| 91 | FLJ12443 | BTEB1 | PRIM1 | WNT5A |
| 92 | TSSC3 | APBB2 | HTATSF1 | DKFZp564D206 |
| 93 | LOC57228 | KIAA0903 | COX5A | KYNU |
| 94 | RARRES3 | HIRA | TOP2A | DD1 |
| 95 | KRT7 | argBP1B | PRKDC | UBE21 |
| 96 | CCND1 | PPP3CB | P311 | feature_3021 |
| 97 | ALDH2 | ALEX2 | CHAF1A | PSMD3 |
| 98 | TJP3 | FACL3 | AHCY | DZIP1 |
| 99 | SEC24A | MEF-2 | NASP | TFRC |
| 100 | TSPAN-1 | PEG10 | FXR1 | E2-EPF |
As an initial validation of gene marker set identification by microarray analysis, we directly compared gene expression data with protein expression data obtained by immunohistochemistry. We selected 11 representative genes for which commercial antibodies were available. All genes were represented in the set of 400 lung histology markers. Paraffin-embedded histological sections were available for 24 of the 32 tumor specimens analyzed on the microarray (Figure 3B) ▶ . There was agreement between gene expression results and immunostaining for all of the markers except for histone deacetylase 2 (HDAC2). Although HDAC2 gene expression data suggested restriction to large-cell carcinoma, immunostaining demonstrated expression uniformly in both squamous cell tumors and in large-cell carcinomas. The protein expression data discrepancy may be because of polyclonal antibody cross-reactivity with nonspecific epitopes in squamous tumors or it may indicate the presence of posttranslational modification causing increased immunostaining in squamous cell carcinomas. To further validate the class marker sets determined by gene profiling, we evaluated protein expression for the 11 selected targets in a larger cohort of 56 resected non-small-cell lung carcinomas that were represented on a TMA (Table 3) ▶ . Results showed that histological subtype staining was specific for all markers with the exceptions of docking protein 1 and syndecan-1, which were evenly distributed across adenocarcinoma, squamous cell carcinoma, and large-cell carcinoma tumors. It is possible that nearest neighbor analysis selected DOK1 and SDC1 as adenocarcinoma class markers based on the substantial gene expression difference between adenocarcinoma and carcinoid specimens. Of the three carcinoids on which immunohistochemistry was performed, none showed staining for syndecan-1 and one showed weak staining for docking protein 1.
Table 3.
Tissue Microarray Immunostaining Results with Antibodies Used in the Analyses, Indicating Source and Dilution
| Marker | Adenocarcinoma | Squamous | Large cell | Clone | Source | Dilution |
|---|---|---|---|---|---|---|
| Integrin alpha 3+ | 18/47 (38.3%) | 1/9 (11.1%) | 0/12 | P1B5 | Santa Cruz | 1:50 |
| TTF-1*‡ | 36/49 (73.5%) | 0/9 | 6/12 (50%) | 8G7G3 | DAKO | 1:200 |
| Docking protein 1 | 31/45 (68.9%) | 6/9 (66.7%) | 7/12 (58.3%) | A-3 | Santa Cruz | 1:100 |
| Syndecan 1 | 36/49 (73.5%) | 8/9 (88.9%) | 7/12 (58.3%) | M 115 | DAKO | 1:50 |
| Cyclin D1+ | 32/47 (68.1%) | 4/9 (44.4%) | 4/12 (33.3%) | DCS-6 | DAKO | 1:400 |
| CDK4+ | 18/47 (38.3%) | 4/9 (44.4%) | 10/12 (83.3%) | Polyclonal | Santa Cruz | 1:200 |
| Histone deacetylase 2*+ | 30/47 (63.8%) | 9/9 (100%) | 12/12 (100%) | Polyclonal | Abcam | 1:1000 |
| Keratin 5*‡ | 5/48 (10.4%) | 7/9 (77.8%) | 2/12 (16.7%) | D5/16B4 | DAKO | 1:50 |
| EGF receptor‡ | 38/48 (79.2%) | 9/9 (100%) | 6/12 (50%) | 31G7 | ZYMED | 1:40 |
| Singed-like* | 28/47 (59.6%) | 9/9 (100%) | 10/12 (83.3%) | 55K-2 | DAKO | 1:100 |
| Tumorprotein 63*‡ | 12/49 (24.5%) | 9/9 (100%) | 2/12 (16.7%) | 4A4 | DAKO | 1:200 |
*Adenocarcinoma versus squamous carcinoma a, P < .05.
+Adenocarcinoma versus large cell, P < .05.
‡Squamous vs. large cell- P < .05
Several of the proteins encoded by genes identified in supervised clustering have been implicated in embryonic lung development. We hypothesized that genes associated with tumor histological classes could be distinguished by patterns of gene expression during lung development. These differences could be manifest by temporal distribution according to embryonic stage or by spatial distribution according to cell location (peripheral, proximal) or by origin (epithelial, mesenchymal). To examine the association of lung tumor histological gene marker sets with temporal stages of lung development, we used gene expression data previously generated from murine lungs obtained serially from embryonic day 12 through adult. Despite fundamental differences in lung development, it has been demonstrated that genes important in lung development are well conserved across species. 7,15
Murine orthologues for tumor class gene marker sets were identified and the expression of these genes was examined in murine lung development. To organize the genes into clusters associated with developmental stage we used an unsupervised approach, self-organized mapping. Genes were segregated into two temporally distinct clusters. Group 1 genes were expressed predominantly earlier in lung development from embryonic day 12 through embryonic day 18 whereas group 2 genes were expressed predominantly later in lung development from postnatal day 1 through adulthood. Lung developmental stages represented by these clusters were pseudoglandular and canalicular stages for group 1 and terminal sac alveolar stages for group 2.
To determine whether lung cancer histological cell type gene marker sets were associated with lung development stages, we used supervised clustering to examine the distribution of murine orthologues for tumor histology markers in the two temporally associated lung development groups previously identified by self-organized mapping. Genes representing squamous cell lung cancers were heterogeneously distributed between groups 1 and 2 (Figure 3C ▶ , Table 4 ▶ ). However, large-cell carcinoma gene orthologues were almost exclusively expressed in group 1 and adenocarcinoma gene orthologues were primarily confined to group 2. In addition, annotation data indicated that subcellular localization of proteins encoded by group 1 and group 2 genes tended to be nuclear and cytoplasmic/membrane, respectively. These data suggest a rationale for the distinctive gene marker sets for large-cell and adenocarcinoma. This rationale suggests that large-cell genes represent genes encoding proteins that primarily facilitate cell growth and proliferation during the early stages of lung development whereas adenocarcinoma genes encode proteins that facilitate differentiation and epithelial/matrix interactions as occurs in subsequent stages of development. This interpretation is supported by functional annotation of molecular function, which showed segregation of function within large cell, adenocarcinoma, and carcinoid; the majority of genes were associated with cell-cycle maintenance, signal transduction/cell adhesion, and synaptic transmission/neurotransmitter maintenance, respectively. Within squamous carcinoma, gene function was evenly split between cell-cycle maintenance and signal transduction/cell adhesion (Table 5) ▶ .
Table 4.
Lung Development Stage Distribution of Tumor Histology Gene Markers
| Histology | Group 1 | Group 2 | Total | P value |
|---|---|---|---|---|
| Adenocarcinoma | 6 | 34 | 40 | <.0001 |
| Carcinoid | 7 | 18 | 25 | <.0073 |
| Large cell | 51 | 4 | 55 | <.0001 |
| Squamous | 25 | 18 | 43 | 0.7154 |
Group 1 and group 2 are genes associated with lung development stages, as defined for Figure 3C ▶ .
Data shown are number of unique Hu95Av2 histology marker probes.
Chi-squared test procedure P values for each histology are indicated.
Table 5.
Functional Annotation of Representative Histologic Class Marker Genes, Indicating Lung Development Stage
| Development group | Function | |
|---|---|---|
| Adenocarcinoma | ||
| CCND1+ | 1 | Cell cycle |
| ITGA-3+ | 1 | Cell adhesion |
| DOK1+ | 2 | Signal transduction |
| FOS | 2 | Signal transduction |
| MUC1 | 2 | Signal transduction |
| SFTPB | 2 | Respiration, organogenesis |
| VEGFC | 2 | Signal transduction |
| RAI3 | Signal transduction | |
| RARRES3 | Negative cell proliferation | |
| SDC1+ | Signal transduction | |
| TTF-1+ | Transcription factor | |
| Carcinoid | ||
| HIRA | 1 | Transcription regulation |
| AES/HBOA | 2 | Organogenesis |
| CPE | 2 | Neuropepetide signaling pathway |
| GABARAPL2 | 2 | Cell shape and cell size |
| STXBP1 | 2 | Golgi to plasma membrane transport, exocytosis |
| THRA | 2 | Transcription |
| DTNA | Synaptic transmission | |
| KCKNK3 | Synaptic transmission | |
| PRKA | Synaptic transmission | |
| Large cell | ||
| BAG2 | 1 | Protein folding |
| BUB3 | 1 | Cell cycle |
| CDK4+ | 1 | Cell cycle |
| E2F3 | 1 | Transcription factor |
| HDAC2+ | 1 | Transcription regulation |
| HMG2 | 1 | Transcription regulation |
| MCM2, 3, 7 | 1 | Cell cycle |
| MDK | 1 | Signal transduction |
| PCNA | 1 | DNA replication, cell cycle control |
| TCP1 | 1 | Protein folding |
| MYBL2 | Cell cycle | |
| Squamous | ||
| DVL3 | 1 | Signal transduction, morphogenesis |
| FGFR2 | 1 | Signal transduction |
| FUS | 1 | Transcription regulation |
| SNL+ | 1 | Cell shape and cell size |
| CX3CL1/SCYD1 | 2 | Signal transduction |
| ITGA2 | 2 | Cell adhesion |
| KLF5 | 2 | Transcription from Pol II promoter |
| KRT19 | 2 | Cell shape and cell size |
| WNT5A | 2 | Signal transduction |
| EGFR+ | Cell shape and cell size, signal transduction | |
| KRT5+ | Cell shape and cell size control | |
| MAPK1 | Signal transduction | |
| TP63+ | Apoptosis |
+Immunohistochemistry data in Figure 3B ▶ .
Development group 1; Pseudoglandular, canalicular stage;
Development group 2; terminal sac, alveolar stage.
Histological Class Representative Genes
Adenocarcinoma
True to its differentiated state, adenocarcinomas express a number of genes that are crucial to lung terminal differentiation and maturation. These genes are included in a well-characterized pathway terminating in expression of SFTPB, which encodes surfactant protein B. Surfactant is a component of lipid-rich material that lines alveoli to reduce surface tension and prevent collapse. In normal lung, SFTBP expression is specific to alveolar type 2 cells and nonciliated bronchiolar cells. Null mutations cause death because of respiratory distress in newborn infants and in nullizygous mice. A conserved enhancer region located −331 to −500 contains binding sites for TTF-1 and retinoic acid response element sites that mediate retinoid activation of surfactant protein B (SPB). 16 TTF-1 encodes thyroid transcription factor 1, a member of the Nk-2 homeobox family that binds and activates the promoter of thyroid- and lung-specific genes. Mice homozygous for Titf1 are not viable, lacking lung parenchyma. 17 TTF-1 expression is specific to lung and thyroid and expression is frequent in lung adenocarcinoma. Immunohistochemistry for TTF-1 is used to distinguish lung adenocarcinoma from tumors derived from other primary sites. Activation of the retinoid response element co-enhancer is suggested by the identification of two genes, RARRES3 and RAI3, which encode retinoic acid responsive proteins (retinoic acid receptor responder 3 and retinoic acid induced 3, respectively). Orthologues of these genes were not included in the murine array used to assess expression during lung development. RARRES3 overexpression is associated with anti-proliferative effects in retinoid-sensitive tumor cells. 18 The gene has at least six putative RA response elements to which retinoic acid receptors may bind. 18 RAI3 is a G protein-coupling receptor that was induced by all-trans-retinoic acid in squamous cell carcinoma cells and is constitutively expressed in fetal and adult lung. 19
Large-cell Carcinoma
In contrast to the adenocarcinoma gene markers that represented lung differentiation pathways, the large-cell carcinoma gene markers were associated with cellular proliferation functions including DNA replication and cell-cycle maintenance. Cell-cycle genes included those in the E2F3 pathway. E2F3 is a member of a family of transcription activators (E2F1-6) that is specifically regulated by the retinoblastoma protein tumor suppressor in a cell cycle-dependent manner. Independent of other E2F members, E2F3 activation mediates cell growth and promotes entry into S phase thus controlling cellular proliferation. 20 E2F3 has been shown to act in a dose-dependent manner on mitogen-induced transcriptional activation of E2F responsive genes such as MYBL2, 21 which also was identified in the large-cell marker set. Within the large-cell marker set were several other genes whose functional annotation places them upstream of E2F3 in cell-cycle maintenance. These genes included HDAC2, CDK4, and PCNA.
Squamous Cell Carcinoma
Among the murine lung developmentally regulated genes that were expressed in squamous cell carcinomas was EGFR, which encodes the tyrosine kinase epidermal growth factor receptor. On activation, EGFR induces Ras signaling pathways and is also involved in cytoskeletal rearrangement. Expression is vital for normal epithelial development 22 and overexpression or amplification is frequently associated with squamous cell carcinomas of the lung, oropharynx, and skin as well with other non-small-cell lung carcinomas. 23 Downstream targets of EGFR activation signaling pathways include MAPK1 and keratin 5 24 a member of the basic families of keratins. Keratin 5 is specifically expressed in the basal layer of the epidermis and has been reported to be overexpressed in lung squamous cell carcinomas. Germ-line mutations are associated with the skin-blistering disorder, epidermolysis bullosa simplex. 25 A second developmentally regulated pathway identified in the squamous cell marker set is Wnt/β-catenin. Wnt5A, a member of the Wnt family of signaling molecules binds to the Frizzled family receptor that activates Dishevelled, of which DVL3 is one of three family members. Disheveled leads to stabilization and accumulation of β-catenin in the cytoplasm, thus facilitating cellular proliferation mediated through TCF/LEF transcription factors. 26
Carcinoid
Several genes identified in the carcinoid marker set are important in neuropeptide signaling and synaptic vesicle trafficking, specialized functions that are associated with the well-differentiated histology of these neuroendocrine tumors. Carboxypeptidase E (CPE) is involved in the biosynthesis of peptide hormones and neurotransmitters, functioning to facilitate packaging of these peptides into secretory granules in a calcium-dependent manner. Other genes whose biological processes include synaptic transmission include dystrobrevin α (DTNA); PRKA; and potassium channel, subfamily K, member 3 (KCKNK3). Notably absent from the carcinoid marker set was ASH1 or achaete-scute homolog-1. ASH1 encodes a basic helix-loop-helix transcription factor that regulates neuroendocrine differentiation of epithelium and has been detected frequently in carcinoid and small-cell lung carcinoma tumors. 27 Probes interrogating ASH1 were detected as being present in all large-cell carcinomas, in two of four carcinoids, and in a single adenocarcinoma and squamous carcinoma (data not shown). The gene was excluded from clustering analyses in our data set because of filtering criteria designed to restrict analysis to genes that demonstrated variability in expression across all samples.
Discussion
We have identified gene expression profiles associated with non-small-cell lung cancer histological class and have validated these data using protein expression analysis in a larger, independent cohort of tumors. Examination of the expression of these genes in lung development has identified developmentally associated genes and pathways associated with each histological class that may correlate with tumor differentiation and growth properties.
Other researchers have examined gene profiles of non-small-cell lung carcinoma. These studies have examined tumor homogenates and have determined that tumors generally segregate according to histological subtype. 13,28-30 In these studies, unsupervised clustering identified common genes associated with histological class across multiple data sets, including ours (ie, SFTPB, MUC1, TTF-1, HMG2, TP63, and KRT5). However, there was relatively little overlap in gene sets. Some of this variability may be explained by differences in platform used for analysis (oligonucleotide versus cDNA array) and some by possible differences in tumor heterogeneity. To reduce variability by tumor heterogeneity and to focus on gene profiles associated with tumor morphology properties, we used microdissection and excluded normal tissue specimens from gene marker selection analysis. Using a supervised clustering approach with a small number of samples, we were able to distinguish clusters tightly associated with tumor morphology. In most cases, tumors segregated according to pathological histology classification. In exceptions, review of histological sections frequently identified intratumoral heterogeneity that could account for gene expression classification. Intratumoral histological heterogeneity is common and is frequently encountered in the pathological classification of adenocarcinoma and squamous carcinomas. World Health Organization recommends quantitative criteria for tumoral classification into histological classes and if the minority pattern exceeds 10% of the tumor, the specimen is classified as an adenosquamous tumor; else the specimen is classified by the majority pattern. It remains unclear what extent the relative contribution of intratumoral heterogeneity provides to heterogeneity of gene expression profiles. As methods evolve to reliably analyze small homogeneous microdissected clinical specimens, these issues will be directly addressed.
Current paradigms hold that neoplasia recapitulates ontogeny. We hypothesized that gene marker sets associated with lung cancer histology would identify developmentally regulated pathways that would provide information about lung carcinogenesis and morphogenesis. We were able to demonstrate that histology marker set orthologues were clustered temporally in normal lung development. Genes associated with large-cell carcinoma were expressed in pseudoglandular and canalicular stages whereas genes associated with adenocarcinoma tended to be expressed in the later, terminal sac and alveolar stages of murine lung development. There are some limitations to our approach linking non-small-cell genes with lung development. Not all human genes identified in our supervised clustering analysis were represented by orthologues on the murine array. Additionally, the developmental profile solely examined global differences in gene expression throughout time, which may exclude identification of genes that regulate lung development through changes in cell-type-specific expression or by matrix/epithelial interactions. Nevertheless functional annotation provided insights into molecular differences between non-small-cell lung histological subtypes; most notably between large cell and adenocarcinoma.
A primary distinction delineated by the pathways was terminal differentiation in adenocarcinoma and undifferentiated proliferation in large-cell carcinomas. The mechanisms driving these divergent pathways are unclear. It is possible that the stimulus is dependent on the cell of origin. Distinct epithelial progenitor cells give rise to proximal conducting airways compared with peripheral airways and alveoli in a murine model, 31 suggesting that the cells of origin for peripheral adenocarcinomas may differ from those of proximal large-cell carcinomas. Alternatively, the distinction might be dependent on consequences of carcinogen-specific activation of pathways that determine tumor morphology. For example, epithelial injury induced by systemic naphthalene induces airway neuroendocrine cell proliferation that is associated with sonic hedgehog-signaling pathway-mediated recapitulation of lung epithelial development. 32
Identification of pathways associated with tumor histology may have clinical implications. Adenocarcinoma gene pathways tend to represent steps in lung terminal differentiation while in contrast, pathways associated with large-cell carcinoma include genes such as E2F3 that inactivate the Rb-mediated G1 checkpoint and lead to increased cell proliferation in S phase. Persistent E2F3 expression prevents growth arrest and terminal differentiation, 33 thus indicating a mechanism contributing to the undifferentiated, highly proliferative state of large-cell lung carcinomas. The molecular differences associated with tumor morphology may account for the poorer prognosis of large-cell carcinoma histological type compared with other non-small-cell lung cancer subtypes, controlling for clinical stage. 34
The identification of developmentally regulated pathways that are active in tumorigenesis may provide insights into early steps of lung carcinogenesis and suggest these steps may differ according to the eventual tumor morphology. The identification of disparate pathways leading to specific lung tumor histological classes indicates that future approaches to development of diagnostic biomarkers and targeted therapeutics may need to encompass several pathways that are histological subtype-specific.
Supplementary Material
Acknowledgments
We thank Vladan Miljkovic and Mahesh Mansukani for technical assistance and Benjamin Tycko and Jan Kitajewski for helpful discussions.
Footnotes
Address reprint requests to Charles A. Powell, M.D., Division of Pulmonary, Allergy, and Critical Care Medicine, Columbia University, 630 West 168th St., Box 91, New York, NY 10032. E-mail: cap6@columbia.edu.
Supported by the National Institutes of Health (ES00354), the Katherine and Roland Douglass Fund (American Cancer Society), and the Columbia University Comprehensive Cancer Center.
References
- 1.Jemal A, Murray T, Samuels A, Ghafoor A, Ward E, Thun MJ: Cancer statistics, 2003. CA Cancer J Clin 2003, 53:5-26 [DOI] [PubMed] [Google Scholar]
- 2.Ferlay J, Bray F, Pisani P, Parkin DM: Globocan 2000: Cancer Incidence, Mortality and Prevalence. 2001. IARC Press Lyon
- 3.Travis WD, Colby TV, Corrin B, Shimosato Y, Brambilla E: Histological typing of lung and pleural tumors. World Health Organization International Histological Classification of Tumours. 1999. Springer-Verlag New York
- 4.Stellman SD, Muscat JE, Thompson S, Hoffmann D, Wynder EL: Risk of squamous cell carcinoma and adenocarcinoma of the lung in relation to lifetime filter cigarette smoking. Cancer 1997, 80:382-388 [DOI] [PubMed] [Google Scholar]
- 5.Reya T, Morrison SJ, Clarke MF, Weissman IL: Stem cells, cancer, and cancer stem cells. Nature 2001, 414:105-111 [DOI] [PubMed] [Google Scholar]
- 6.Warburton D, Zhao J, Berberich MA, Bernfield M: Molecular embryology of the lung: then, now, and in the future. Am J Physiol 1999, 276:L697-L704 [DOI] [PubMed] [Google Scholar]
- 7.Warburton D, Schwarz M, Tefft D, Flores-Delgado G, Anderson KD, Cardoso WV: The molecular basis of lung morphogenesis. Mech Dev 2000, 92:55-81 [DOI] [PubMed] [Google Scholar]
- 8.Powell CA, Spira A, Derti A, DeLisi C, Liu G, Borczuk A, Busch S, Sahasrabudhe S, Chen Y, Sugarbaker D, Bueno R, Richards WG, Brody JS: Gene expression in lung adenocarcinomas of smokers and non-smokers. Am J Respir Cell Mol Biol 2003, 29:157-162 [DOI] [PubMed] [Google Scholar]
- 9.Eisen MB, Spellman PT, Brown PO, Botstein D: Cluster analysis and display of genome-wide expression patterns. Proc Natl Acad Sci USA 1998, 95:14863-14868 [DOI] [PMC free article] [PubMed] [Google Scholar]
- 10.Golub TR, Slonim DK, Tamayo P, Huard C, Gaasenbeek M, Mesirov JP, Coller H, Loh ML, Downing JR, Caligiuri MA, Bloomfield CD, Lander ES: Molecular classification of cancer: class discovery and class prediction by gene expression monitoring. Science 1999, 286:531-537 [DOI] [PubMed] [Google Scholar]
- 11.Mariani TJ, Reed JJ, Shapiro SD: Expression profiling of the developing mouse lung: insights into the establishment of the extracellular matrix. Am J Respir Cell Mol Biol 2002, 26:541-548 [DOI] [PubMed] [Google Scholar]
- 12.Brambilla E, Travis WD, Colby TV, Corrin B, Shimosato Y: The new World Health Organization classification of lung tumours. Eur Respir J 2001, 18:1059-1068 [DOI] [PubMed] [Google Scholar]
- 13.Bhattacharjee A, Richards WG, Staunton J, Li C, Monti S, Vasa P, Ladd C, Beheshti J, Bueno R, Gillette M, Loda M, Weber G, Mark EJ, Lander ES, Wong W, Johnson BE, Golub TR, Sugarbaker DJ, Meyerson M: Classification of human lung carcinomas by mRNA expression profiling reveals distinct adenocarcinoma subclasses. Proc Natl Acad Sci USA 2001, 98:13790-13795 [DOI] [PMC free article] [PubMed] [Google Scholar]
- 14.Pomeroy SL, Tamayo P, Gaasenbeek M, Sturla LM, Angelo M, McLaughlin ME, Kim JY, Goumnerova LC, Black PM, Lau C, Allen JC, Zagzag D, Olson JM, Curran T, Wetmore C, Biegel JA, Poggio T, Mukherjee S, Rifkin R, Califano A, Stolovitzky G, Louis DN, Mesirov JP, Lander ES, Golub TR: Prediction of central nervous system embryonal tumour outcome based on gene expression. Nature 2002, 415:436-442 [DOI] [PubMed] [Google Scholar]
- 15.Cardoso WV: Molecular regulation of lung development. Annu Rev Physiol 2001, 63:471-494 [DOI] [PubMed] [Google Scholar]
- 16.Yang L, Naltner A, Kreiner A, Yan D, Cowen A, Du H, Yan C: An enhancer region determines hSP-B gene expression in bronchiolar and ATII epithelial cells in transgenic mice. Am J Physiol 2003, 284:L481-L488 [DOI] [PubMed] [Google Scholar]
- 17.Kimura S, Hara Y, Pineau T, Fernandez-Salguero P, Fox CH, Ward JM, Gonzalez FJ: The T/ebp null mouse: thyroid-specific enhancer-binding protein is essential for the organogenesis of the thyroid, lung, ventral forebrain, and pituitary. Genes Dev 1996, 10:60-69 [DOI] [PubMed] [Google Scholar]
- 18.DiSepio D, Ghosn C, Eckert RL, Deucher A, Robinson N, Duvic M, Chandraratna RA, Nagpal S: Identification and characterization of a retinoid-induced class II tumor suppressor/growth regulatory gene. Proc Natl Acad Sci USA 1998, 95:14811-14815 [DOI] [PMC free article] [PubMed] [Google Scholar]
- 19.Cheng Y, Lotan R: Molecular cloning and characterization of a novel retinoic acid-inducible gene that encodes a putative G protein-coupled receptor. J Biol Chem 1998, 273:35008-35015 [DOI] [PubMed] [Google Scholar]
- 20.Wu L, Timmers C, Maiti B, Saavedra HI, Sang L, Chong GT, Nuckolls F, Giangrande P, Wright FA, Field SJ, Greenberg ME, Orkin S, Nevins JR, Robinson ML, Leone G: The E2F1-3 transcription factors are essential for cellular proliferation. Nature 2001, 414:457-462 [DOI] [PubMed] [Google Scholar]
- 21.Catchpole S, Tavner F, Le Cam L, Sardet C, Watson RJ: A B-myb promoter corepressor site facilitates in vivo occupation of the adjacent E2F site by p107 x E2F and p130 x E2F complexes. J Biol Chem 2002, 277:39015-39024 [DOI] [PubMed] [Google Scholar]
- 22.Miettinen PJ, Berger JE, Meneses J, Phung Y, Pedersen RA, Werb Z, Derynck R: Epithelial immaturity and multiorgan failure in mice lacking epidermal growth factor receptor. Nature 1995, 376:337-341 [DOI] [PubMed] [Google Scholar]
- 23.Franklin WA, Veve R, Hirsch FR, Helfrich BA, Bunn PA, Jr: Epidermal growth factor receptor family in lung cancer and premalignancy. Semin Oncol 2002, 29:3-14 [DOI] [PubMed] [Google Scholar]
- 24.Kinouchi M, Takahashi H, Itoh Y, Ishida-Yamamoto A, Iizuka H: Ultraviolet B irradiation increases keratin 5 and keratin 14 expression through epidermal growth factor receptor of SV40-transformed human keratinocytes. Arch Dermatol Res 2002, 293:634-641 [DOI] [PubMed] [Google Scholar]
- 25.Lane EB, Rugg EL, Navsaria H, Leigh IM, Heagerty AH, Ishida-Yamamoto A, Eady RA: A mutation in the conserved helix termination peptide of keratin 5 in hereditary skin blistering. Nature 1992, 356:244-246 [DOI] [PubMed] [Google Scholar]
- 26.Julius MA, Schelbert B, Hsu W, Fitzpatrick E, Jho E, Fagotto F, Costantini F, Kitajewski J: Domains of axin and disheveled required for interaction and function in wnt signaling. Biochem Biophys Res Commun 2000, 276:1162-1169 [DOI] [PubMed] [Google Scholar]
- 27.Linnoila RI, Zhao B, DeMayo JL, Nelkin BD, Baylin SB, DeMayo FJ, Ball DW: Constitutive achaete-scute homologue-1 promotes airway dysplasia and lung neuroendocrine tumors in transgenic mice. Cancer Res 2000, 60:4005-4009 [PubMed] [Google Scholar]
- 28.Garber ME, Troyanskaya OG, Schluens K, Petersen S, Thaesler Z, Pacyna-Gengelbach M, van de Rijn M, Rosen GD, Perou CM, Whyte RI, Altman RB, Brown PO, Botstein D, Petersen I: Diversity of gene expression in adenocarcinoma of the lung. Proc Natl Acad Sci USA 2001, 98:13784-13789 [DOI] [PMC free article] [PubMed] [Google Scholar]
- 29.Nacht M, Dracheva T, Gao Y, Fujii T, Chen Y, Player A, Akmaev V, Cook B, Dufault M, Zhang M, Zhang W, Guo M, Curran J, Han S, Sidransky D, Buetow K, Madden SL, Jen J: Molecular characteristics of non-small cell lung cancer. Proc Natl Acad Sci USA 2001, 98:15203-15208 [DOI] [PMC free article] [PubMed] [Google Scholar]
- 30.Virtanen C, Ishikawa Y, Honjoh D, Kimura M, Shimane M, Miyoshi T, Nomura H, Jones MH: Integrated classification of lung tumors and cell lines by expression profiling. Proc Natl Acad Sci USA 2002, 99:12357-12362 [DOI] [PMC free article] [PubMed] [Google Scholar]
- 31.Perl AK, Wert SE, Nagy A, Lobe CG, Whitsett JA: Early restriction of peripheral and proximal cell lineages during formation of the lung. Proc Natl Acad Sci USA 2002, 99:10482-10487 [DOI] [PMC free article] [PubMed] [Google Scholar]
- 32.Watkins DN, Berman DM, Burkholder SG, Wang B, Beachy PA, Baylin SB: Hedgehog signalling within airway epithelial progenitors and in small-cell lung cancer. Nature 2003, 422:313-317 [DOI] [PubMed] [Google Scholar]
- 33.Gadd M, Pisc C, Branda J, Ionescu-Tiba V, Nikolic Z, Yang C, Wang T, Shackleford GM, Cardiff RD, Schmidt EV: Regulation of cyclin D1 and p16(INK4A) is critical for growth arrest during mammary involution. Cancer Res 2001, 61:8811-8819 [PubMed] [Google Scholar]
- 34.Takei H, Asamura H, Maeshima A, Suzuki K, Kondo H, Niki T, Yamada T, Tsuchiya R, Matsuno Y: Large cell neuroendocrine carcinoma of the lung: a clinicopathologic study of eighty-seven cases. J Thorac Cardiovasc Surg 2002, 124:285-292 [DOI] [PubMed] [Google Scholar]
Associated Data
This section collects any data citations, data availability statements, or supplementary materials included in this article.