

Abstract
Metallothionein (MT), a low-molecular weight protein with pleiotropic functions, is believed to play an important role in tumorigenesis. The aim of this study was to compare the expression of functional MT-1 and MT-2 mRNA isoforms in five breast cancer cell lines ranging from noninvasive MCF7 breast cancer cells to highly aggressive MDA-MB-231 breast cancer cells together with breast myoepithelial cells in vitro by conventional semiquantitative reverse transcriptase-polymerase chain reaction (RT-PCR) and quantitative real-time RT-PCR. The MT-2A isoform was observed to be differentially upregulated in the invasive phenotype. The MT-1E isoform was found to be present in estrogen receptor-negative breast cancer cell lines (MDA-MB-231 and Hs578T) but not detectable in the estrogen receptor-positive cell lines (T47D, MCF7, and ZR75-1 cells). Only the myoepithelial cells exhibited the presence of the MT-1G transcript. Direct sequencing of the RT-PCR products revealed the occurrence of a variant MT-1H isoform with changes in amino acid residues in the protein sequence and notable differences in the predicted secondary protein structure. The observations in this study are relevant to the development of novel approaches to metastatic breast cancer disease, and may herald the search for novel MT mutants and the elucidation of their biological roles.
Metallothioneins (MTs) are small molecular weight proteins containing 61 to 68 amino acid residues, and are characterized by a high cysteine content with a paucity of aromatic amino acids. 1,2 MTs are known to participate in fundamental cellular processes such as cell proliferation and apoptosis. 3-5 Because MTs exhibit a selective binding to heavy metals such as zinc, copper, and cadmium, they are involved in heavy metal detoxification. 6,7 MTs have also been implicated in chemoresistance to anti-cancer drugs 8,9 and in free radical scavenging in cells. 6,10,11 Since the first report of MT expression in thyroid cancer tissues by Cherian and co-workers in 1987, 12 there has been extensive interest in the role played by MTs in tumorigenesis. 13-17
In humans, four subgroups of MT proteins, namely MT-1, MT-2, MT-3, and MT-4 proteins, encoded by at least 10 functional MT genes have been identified. 18-21 All of the MT genes discovered thus far are located on chromosome 16. 18,19,22,23 Although the MT-2, MT-3, and MT-4 proteins are encoded by a single gene, the MT-1 protein comprises many subtypes encoded by a set of MT-1 genes. The known functional MT-1 and MT-2 isoforms are MT-1A, -1B, -1E, -1F, -1G, -1H, -1X, and -2A. As early as 1988, Kägi and Schaffer 1 proposed that different MT genes in humans could possibly play different functional roles during development or under various physiological conditions. However, to this date, there is still a scarcity of knowledge regarding the regulation and expression of the various MT isoforms. 2,24-26
In light of the pleiotropic functions of MT, this study was undertaken to analyze the expression of the functional MT-1 and MT-2 isoforms in the following breast cancer cell lines: non-invasive MCF7 cells and ZR75-1 cells; less invasive T47D cells, moderately invasive Hs578T cells, and highly metastatic MDA-MB-231 breast cancer cells. 27-29 The MT isoform expression profile was also evaluated in myoepithelial cells in vitro because only myoepithelial cells but not the glandular acinar cells express MT in non-malignant breast tissues. 30 MT isoform expression was examined in surgically resected breast cancer and adjacent benign breast tissues as well. Given that the commercially available E9 antibody (which is generated against a conserved epitope), recognizes but cannot differentiate the MT-1 and MT-2 isoforms, analysis of the various isoforms was performed by both semiquantitative conventional reverse transcriptase-polymerase chain reaction (RT-PCR) and quantitative real-time RT-PCR. The specificity of the RT-PCR products was verified by direct sequencing.
Materials and Methods
Cell Culture
Breast cancer cell lines MCF7, Hs578T, and MDA-MB-231 (American Type Culture Collection, Rockville, MD) were routinely maintained in Dulbecco’s modified Eagle’s medium (DMEM; Sigma, St. Louis, MO) supplemented with 5% fetal calf serum, 2 mmol/L glutamine, 100 U/ml penicillin, and 100 μg/ml streptomycin. T47D and ZR75-1 breast cancer cells (American Type Culture Collection) were maintained in RPMI 1640 (GibcoBRL) supplemented with 10% fetal calf serum (FCS), penicillin, and streptomycin. Myoepithelial cells were selected using Dynabeads M-450 coated with sheep anti-mouse IgG1 (Fc) (Dynal UK Ltd., Bromborough, UK) conjugated to CALLA monoclonal antibody (common acute lymphoblastic leukemia antigen, SS2/36, or CD10, obtained from DAKO UK Ltd., Ely, UK), and luminal epithelial cells were selected using Dynabeads coated with mouse monoclonal antibody to EMA (epithelial membrane antigen, obtained from DAKO UK Ltd.), according to a modification of the method previously described. 31,32 Myoepithelial cells were maintained in 1:1 DMEM:Ham’s F12 supplemented with 10% FCS, 5 μg/ml insulin, 5 μg/ml hydrocortisone, 20 ng/ml epidermal growth factor, 100 IU/ml penicillin, and 100 μg/ml streptomycin, (all from Sigma), and luminal epithelial cells were maintained in DMEM plus 10% FCS, penicillin, and streptomycin. The cell populations were cultured for a maximum of 7 days, through which time they maintain their native phenotype. After characterization of cell phenotype, mRNA was then extracted for analysis of MT isoform expression. Repeats of analysis were performed using mRNA from different individuals.
Characterization of Myoepithelial Cells
Aliquots of selected myoepithelial and luminal epithelial cells (which served as control cells) were transferred to coverslips for characterization of phenotype. Immunohistochemistry was performed as previously described for the luminal cytokeratin CK18 and the basal/myoepithelial cytokeratin CK14 (mouse monoclonal antibodies received as a gift from Prof. EB Lane, University of Dundee, Dundee, UK), for EMA and β4-integrin (Chemicon International Inc., Temecula, CA). 32 Briefly, cells were fixed in acetone at 4°C for 10 minutes, nonspecific staining blocked using 20% normal rabbit serum in phosphate-buffered saline (PBS) and the cells incubated for 1 hour at room temperature with primary antibody. After washing, the samples were incubated with fluorescein isothiocyanate-conjugated rabbit anti-mouse IgG for 1 hour at room temperature in the dark. After washing, the coverslips were mounted using the anti-fade mountant Citifluor (Agar Ltd., Essex, UK) and viewed using confocal laser-scanning microscopy. The purity of the isolated cell populations was established using RT-PCR using primers for EMA, CALLA, the myoepithelial-desmosomal glycoprotein DSg3, and tenascin, which is expressed by myoepithelial cells and fibroblasts but not by luminal epithelial cells. 32,33 Glyceraldehyde-3-phosphate dehydrogenase (G3PDH) was used as a housekeeping gene, as previously described. 32,33 Briefly, mRNA was extracted from 1 × 10⁵ cells using oligo (dT)-labeled paramagnetic beads (Dynal UK Ltd.). mRNA-linked Dynabeads were resuspended in 20 ml of diethyl pyrocarbonate water and used for RT-PCR as described previously. Thirty-five cycles of amplification were performed at annealing temperatures of 53°C for EMA and CALLA, 55°C for DSg3, and 60°C for tenascin and G3PDH. Products were analyzed on a 2% agarose gel stained with ethidium bromide.
Breast Tissues
Fresh tissue specimens comprising 20 surgically resected primary invasive ductal breast cancer and adjacent benign breast tissues, were snap-frozen, stored in liquid nitrogen, and subjected to RT-PCR and direct sequencing.
Estimation of Zinc Concentration in Culture Media
The concentrations of zinc in the culture media were determined by atomic absorption spectrometry. 4
RT-PCR Protocol
Total RNAs from all cancer cell lines and breast tissues were isolated using the RNeasy Mini kit (Qiagen, Hilden, Germany) following the manufacturer’s protocol. RNA integrity was confirmed by denaturing formaldehyde agarose gel electrophoresis. Total RNA was reverse-transcribed using Superscript II RNase H− reverse transcriptase (Invitrogen, Carlsbad, CA). Primers for amplification of the eight MT isoforms were adopted from Mididoddi and co-workers, 21 designed from the divergent 5′ and 3′ untranslated regions of each MT isoform. The housekeeping G3PDH gene was co-amplified using the amplimers described by Abdel-Mageed and Agrawal. 34 The concentration of the primers was adjusted to 10 μmol/L for PCR usage. For each primer pair, a negative control (without template cDNA) was included to ensure no crossover DNA contamination. For amplification of MT-1A and MT-1H isoforms, cDNA equivalent to ∼180 to 200 ng of total RNA from each sample was used. For the amplification of other MT isoforms, cDNA equivalent to ∼90 to 100 ng of total RNA was used. The cycling profile was as follows: initial denaturation at 95°C for 1 minute for one cycle, denaturation at 95°C for 30 seconds, annealing at 55°C for MT-1F, and 65°C for the other isoforms for 30 seconds, extension at 72°C for 30 seconds for 25 to 40 cycles, followed by a final extension at 72°C for 7 minutes. The number of amplification cycles for each gene is shown in Table 2 ▶ . The samples were then electrophoresed in 1.6% agarose gels at 160 V together with a 1-kb plus DNA ladder (Invitrogen). Gels were photographed using a digital camera (electrophoresis documentation and analysis system 120; Kodak, New Haven, CA), and analyzed by densitometry using the Quantity One software (Bio-Rad Laboratories, Hercules, CA). The relative gene expression levels of each MT isoform with respect to G3PDH were determined.
Table 2.
Relative Expression Levels of MT Isoforms by Semiquantitative Conventional RT-PCR in Breast Cell Lines
| Gene | PCR cycles | MDA-MB-231 | Hs578T | T47D | ZR75-1 | MCF7 | Myoepithelial |
|---|---|---|---|---|---|---|---|
| MT-1A | 35 | 0.87 ± 0.03 | 0.73 ± 0.02 | 0.81 ± 0.02 | 0.82 ± 0.03 | 0.74 ± 0.01 | 0.87 ± 0.03 |
| MT-1B | 40 | 0 | 0 | 0 | 0 | 0 | 0 |
| MT-1E | 25 | 0.94 ± 0.02 | 0.99 ± 0.03 | 0 | 0 | 0 | 0.93 ± 0.04 |
| MT-1F | 30 | 0.86 ± 0.04 | 0.69 ± 0.05 | 1.01 ± 0.04 | 0.72 ± 0.03 | 0.82 ± 0.04 | 0.86 ± 0.03 |
| MT-1G | 40 | 0 | 0 | 0 | 0 | 0 | 0.78 ± 0.03 |
| MT-1H | 40 | 0.68 ± 0.09 | 0.69 ± 0.08 | 0.94 ± 0.06 | 0.79 ± 0.07 | 0.68 ± 0.09 | 0.74 ± 0.12 |
| MT-1X | 35 | 0.98 ± 0.02 | 1.03 ± 0.03 | 0.98 ± 0.02 | 0.87 ± 0.04 | 0.91 ± 0.03 | 0.92 ± 0.02 |
| MT-2A | 25 | 1.05 ± 0.02 | 1.03 ± 0.03 | 1.00 ± 0.02 | 0.94 ± 0.01 | 0.82 ± 0.04 | 0.96 ± 0.02 |
| G3PDH | 25 | 1 | 1 | 1 | 1 | 1 | 1 |
Values shown are mean densitometric readings ± SE.
Real-Time RT-PCR
Primers and cDNA were used for optimization and quantification in real-time RT-PCR. To ensure that both gene of interest and G3PDH were amplified at the same efficiency by PCR, amplifications of several dilutions (1 ng, 5 ng, 10 ng) of cDNA were performed. Optimization was performed similarly using different concentrations of MgCl2 and primers. PCR was performed using a Light Cycler (Roche Diagnostics GmbH, Germany) in a total reaction mixture of 10 μl containing 5 ng of cDNA, 1× Light Cycler Hotstart DNA Master SYBERGreen 1, 4 mmol/L MgCl2, and 1 μmol/L of each primer. After denaturation at 95°C for 10 minutes, 40 to 55 cycles were performed at 95°C for 5 seconds, 65°C for 5 seconds, and 72°C for 13 seconds. To verify the specificity of the amplification reaction, melting curve analysis was performed. Relative quantification was calculated using the comparative threshold (CT) method where ΔCT equals the difference between the CT values of the target gene and G3PDH. 35 The CT value is taken as the fractional cycle number at which the emitted fluorescence of the sample passes a fixed threshold above the baseline. For each MT gene of interest, normal myoepithelial cells were selected as the reference, and its ΔCT value subtracted from the ΔCT values of the cancer lines to determine the ΔΔCT value. Lower ΔCT values and ΔΔCT values reflect a relatively higher amount of MT transcript.
Verification of RT-PCR Products
RT-PCR products from gels were eluted with a Spin-X 0.45-μm centrifuge tube filter (Corning-Costar, Corning, NY). RT-PCR product sizes of the MT isoforms and G3PDH are shown in Table 1 ▶ . The QIAquick Gel Extraction kit (Qiagen) was used to extract and purify DNA fragments. Direct sequencing was performed at least twice and in both directions on each detectable MT isoform of individual cell lines to authenticate the specificity of the PCR products. Automated sequencing reactions were performed with primer, PCR template, and ABI PRISM BigDye Terminator Cycle Sequencing ready reaction mix.
Table 1.
RT-PCR Product Size of MT Isoforms
| Gene | Product size |
|---|---|
| MT-1A | 219 bp |
| MT-1B | 287 bp |
| MT-1E | 284 bp |
| MT1F | 232 bp |
| MT-1G | 309 bp |
| MT-1H | 315 bp |
| MT-1X | 151 bp |
| MT-2A | 259 bp |
| G3PDH | 160 bp |
Computer Processing of cDNA and Amino Acid Sequence Data
The BLAST software version 2.2.2 (http://www.ncbi.nlm.nih.gov/blast) was used to search for homology between the obtained sequence and the nonredundant nucleotide database. The ClustalW version 1.8 (http://searchlauncher.bcm.tmc.edu/multialign/multialign.html) was used to perform multiple sequence alignments between sequences. The secondary structures of polypeptides were predicted using the PROSIS Protein Analysis System software program (Hitachi, Brisbane, CA).
Immunohistochemistry
After fixation in 4% paraformaldehyde for 8 minutes, the cells were permeabilized with 0.2% Triton X-100 in PBS for 10 minutes. Cells were then incubated in 2% normal horse serum for 1 hour at room temperature before the addition of a 1:200 dilution of primary antibody E9 (DAKO Corp., Carpinteria, CA) for 2 hours at room temperature. Visualization was achieved by the avidin-biotin-complex technique (ABC kit; Vector Laboratories, Burlingame, CA), using diaminobenzidine as the chromogen substrate. The cells were then counterstained with methyl green.
Statistical Analysis
The Graphpad Prism software package and SPSS 11.0 statistical package were used for statistical analysis. One-way analysis of variance with Bonferroni’s multiple comparison test was performed to compare sample means in which a P value of <0.05 was considered as significant.
Results
Confirmation of Myoepithelial Cell Phenotype
The CALLA-selected cell population exhibited strong homogeneous staining for CK14 and lacked expression of CK18 and EMA (Figure 1; A to C) ▶ . The cells displayed punctate reactivity for β4-integrin, in keeping with localization to hemidesmosomes (Figure 1D) ▶ . In contrast, control EMA-selected luminal cells lacked CK14 but exhibited cytoplasmic staining for CK18 (Figure 1, E and F) ▶ . The luminal cells showed membrane staining for EMA but β4-integrin was undetectable (Figure 1, G and H) ▶ . RT-PCR demonstrated expression of CALLA, DSg3, and tenascin by the CALLA-isolated cell population, with no detection of EMA, while the EMA-isolated cells produced an amplicon only for EMA, lacking expression of CALLA, DSg3, and tenascin (Figure 2) ▶ . A product was obtained in all reactions from mRNA isolated from normal breast that also acts as a control for all genes. This expression profile confirms the isolated cells as myoepithelial and luminal epithelial cells, respectively.
Figure 1.
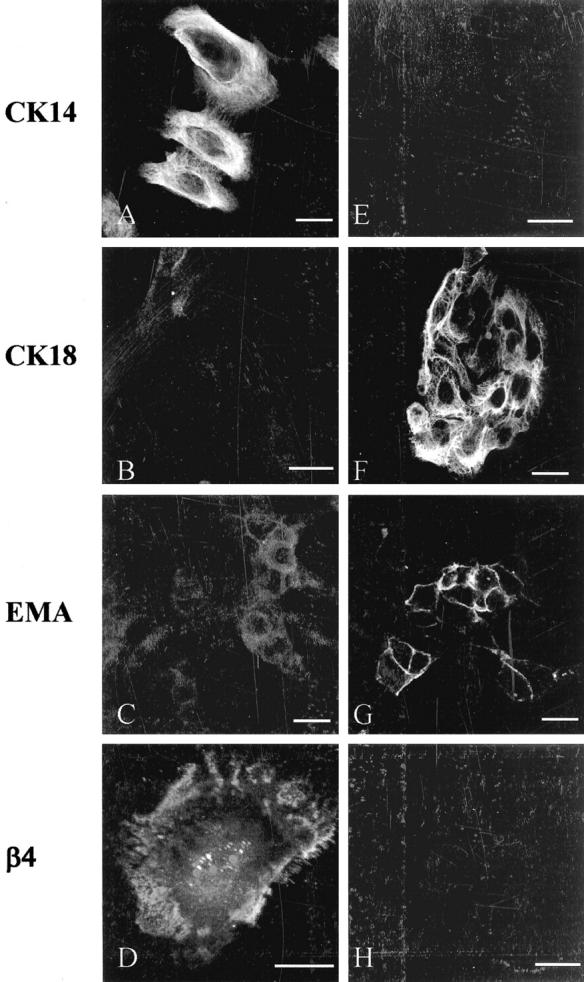
Characterization of isolated breast myoepithelial cells and control luminal epithelial cells. The left column shows the reactivity pattern of CALLA-isolated cells and the right column demonstrates control EMA-isolated cells. The CALLA-isolated cells express CK14 but lack CK18 and EMA, and show punctate staining for β4-integrin (A–D). The EMA-isolated cells lack CK14 but express CK18 and EMA with no detectable β4-integrin (E–H). Scale bar, 25 μm.
Figure 2.
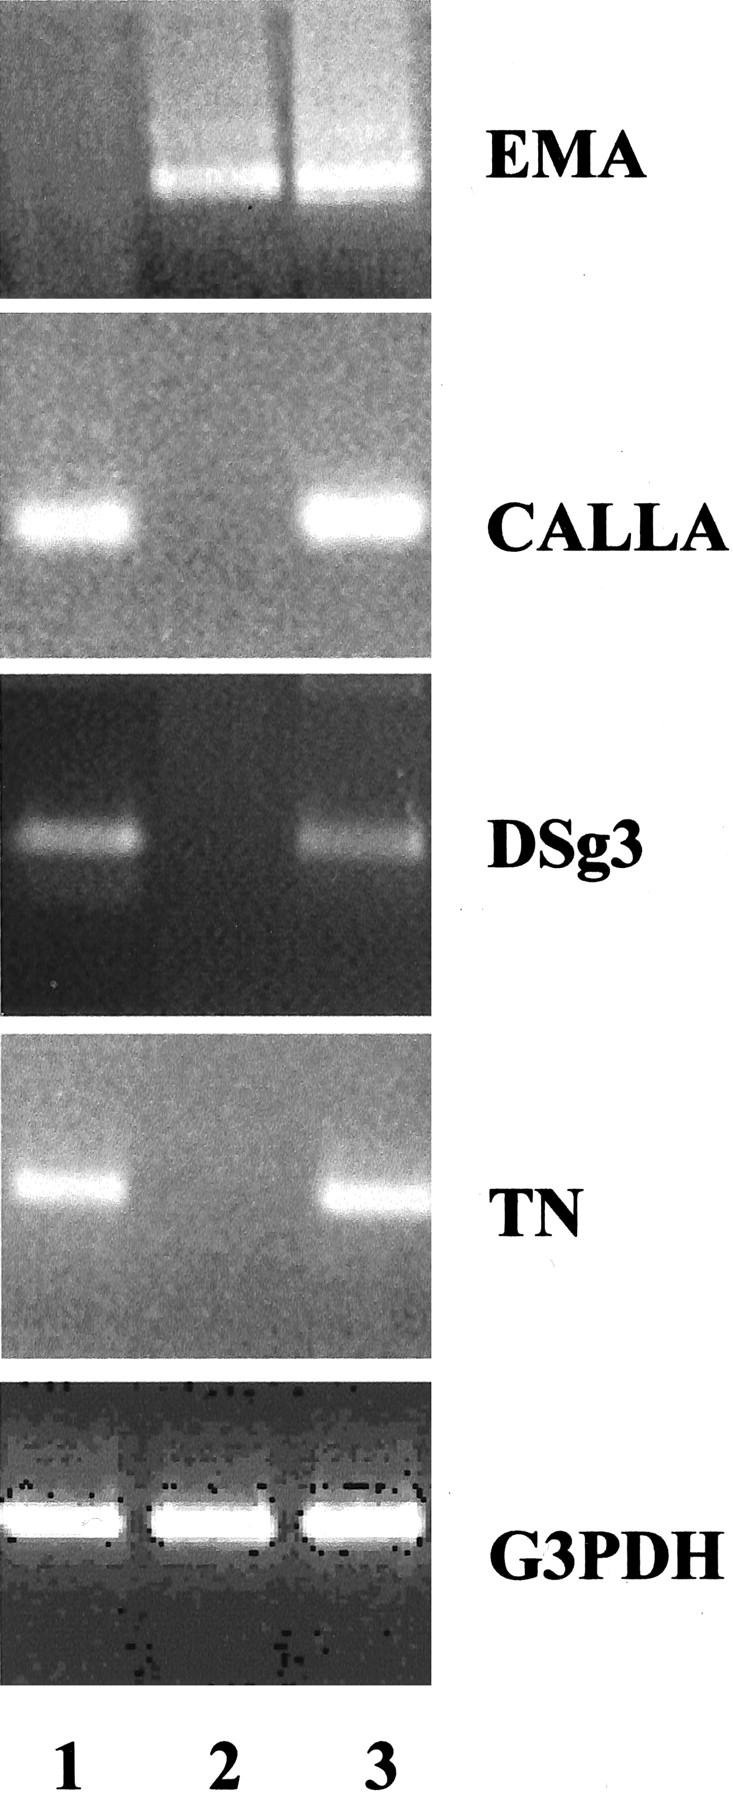
Expression profile of myoepithelial-related and luminal epithelial-related genes in isolated cell populations. The CALLA-isolated cells (lane 1) do not express EMA but express CALLA, DSg3, and tenascin (TN). The control EMA-isolated cells (lane 2) express EMA but do not express CALLA, DSg3, or TN. mRNA isolated from normal breast tissue that contains both luminal and myoepithelial cells show expression of all genes (lane 3).
Zinc Concentration in Culture Media
As zinc is a major inducer of MT, the zinc concentrations of the culture media used in the study were determined and found to be present in trace quantities and similar in amounts. The zinc concentrations of DMEM with 5% FCS, RPMI 1640 with 10% FCS, and 1:1 Ham’s F12:DMEM with 10% FCS were 0.36 ppm, 0.34 ppm, and 0.33 ppm, respectively.
MT mRNA Expression by Conventional RT-PCR
The expression ratios of the seven functional MT-1 and the MT-2A mRNA isoforms in the breast cancer and breast myoepithelial cell lines as evaluated by conventional RT-PCR methodology are shown in Table 2 ▶ and Figure 3 ▶ . All of the cell lines exhibited the expression of MT-1A, MT-1F, MT-1H, MT-1X, and MT-2A genes. The MT-2A isoform was the most highly expressed MT isoform mRNA. It must be noted that the number of PCR cycles required for amplification of MT-2A and MT-1E mRNA was lower than that of the other isoforms. In contrast, expression levels of the MT-1A and MT-1H isoforms were comparatively very low, necessitating double the amount of template for conventional RT-PCR detection. The expected 287-bp RT-PCR fragment of the MT-1B gene was not detected in all cell lines examined. This was confirmed by the absence of any detectable bands in a second-round PCR performed using the first-round PCR product as the template. Only myoepithelial cells but not breast cancer cells displayed expression of MT-1G gene. Although the MT-1E isoform was expressed in Hs578T, MDA-MB-231, and myoepithelial cells, no significant differences in expression levels of MT-1E were observed among the three cell lines (P = 0.4517). The expression level of MT-1A mRNA was significantly lower in Hs578T cells than that of MDA-MB-231 cells (P < 0.023) and myoepithelial cells (P < 0.027). MT-1F mRNA expression in T47D cells was significantly higher than that of Hs578T (P < 0.001), ZR75-1 (P < 0.001), and MCF7 cells (P < 0.021). There were no significant differences in the expression levels of the MT-1H gene in all of the cell lines. Expression of the MT-1X transcript in Hs578T cells was significantly higher than that that of ZR75-1 cells (P < 0.05). MT-2A mRNA expression level in MCF7 cells was significantly lower than that of Hs578T (P < 0.001), MDA-MB-231 (P < 0.001), T47D (P < 0.01), and myoepithelial cells (P < 0.05). Generally, MT-1A and MT-2A transcript levels were higher in the invasive compared to the less invasive breast cancer cell lines. The housekeeping G3PDH gene showed similar levels of expression in all cell lines evaluated. Negative controls consistently authenticated the absence of contaminating DNA. Expression ratios of the MT isoforms in breast tissues is shown in Table 3 ▶ . The MT-1B isoform was not detectable whereas the MT-2A isoform was the highest expressed in both cancer and adjacent benign tissues (the number of PCR cycles required for amplification of MT-2A and MT-1E being lower than the other isoforms). The MT-1G was expressed in benign tissues, which is similar to that observed in myoepithelial cells. However, MT-1G was also detected in breast cancer tissues although it was not present in the breast cancer cell lines.
Figure 3.
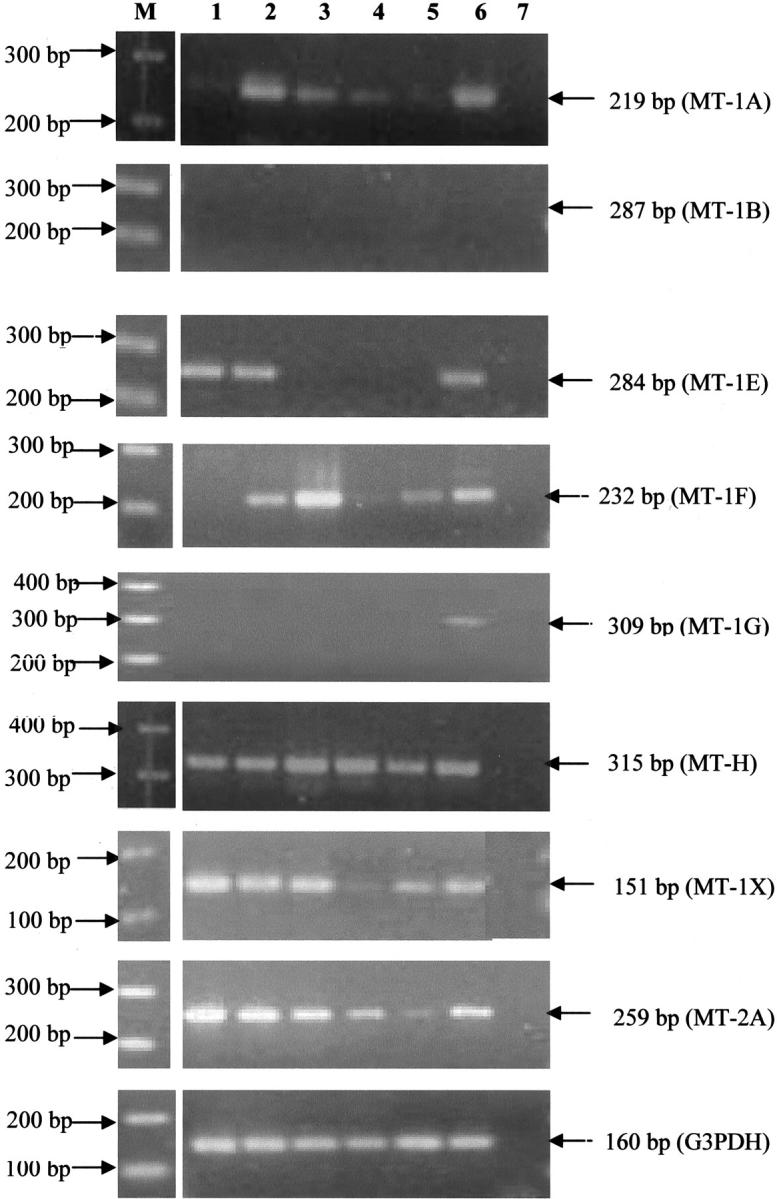
Expression of functional MT-1A, -1B, -1E, -1F, -1G, -1H, -1X, and -2A isoforms in breast cancer and myoepithelial cell lines by conventional RT-PCR. Lane M, DNA ladder marker; lane 1, Hs578T cDNA; lane 2, MDA-MB-231 cDNA; lane 3, T47D cDNA; lane 4, ZR75-1 cDNA; lane 5, MCF7 cDNA; lane 6, myoepithelial cell cDNA; lane 7, negative control.
Table 3.
Relative Expression Levels of MT Isoforms by Semiquantitative Conventional RT-PCR in Breast Cancer and Adjacent Benign Tissues (n = 20)
| Gene detected | PCR cycles | Benign tissues | Tumor tissues* |
|---|---|---|---|
| MT-1A | 35 | 1.68 ± 0.34 | 1.33 ± 0.10 |
| MT-1B | 40 | 0 | 0 |
| MT-1E | 25 | 0.66 ± 0.05 | 0.55 ± 0.09 |
| MT-1F | 30 | 0.36 ± 0.03 | 0.30 ± 0.02 |
| MT-1G | 40 | 2.66 ± 0.37 | 1.94 ± 0.25 |
| MT-1H | 40 | 1.99 ± 0.52 | 1.62 ± 0.20 |
| MT-1X | 35 | 1.91 ± 0.37 | 1.61 ± 0.17 |
| MT-2A | 25 | 1.04 ± 0.09 | 0.84 ± 0.07 |
| G3PDH | 25 | 1 | 1 |
*For tumor tissues, values are adapted from Jin et al. 40
MT Isoform Expression by Real-Time RT-PCR
The MT-1B transcript was not detected by real-time RT-PCR (concurring with the observation by conventional RT-PCR) (Tables 4 and 5) ▶ . However, in contrast to conventional RT-PCR, there were no MT-1A and MT-1H transcripts detected by real-time RT-PCR. This variance in results may be explained by the necessity for double the amount of template used in conventional RT-PCR to detect amplified bands compared to the other MT isoforms. For real-time RT-PCR, the amount of template used was kept constant for all MT isoforms. MT-1E was expressed in MDA-MB-231, Hs578T, and in myoepithelial cells but not in T47D, MCF7, and ZR75-1 cells. The expression of MT-2A mRNA was also higher in the more invasive breast cancer cell lines.
Table 4.
ΔCT Values of MT Isoforms by Real-Time RT-PCR
| Gene | MDA-MB-231 | Hs578T | T47D | ZR75-1 | MCF7 | Myoepithelial |
|---|---|---|---|---|---|---|
| MT-1A | NC | NC | NC | NC | NC | NC |
| MT-1B | NC | NC | NC | NC | NC | NC |
| MT-1E | 1.63 | 5.71 | NC | NC | NC | 3.62 |
| MT-1F | 11.62 | 13.13 | 7.14 | 10.53 | 8.99 | 8.12 |
| MT-1G | NC | NC | NC | NC | NC | 12.47 |
| MT-1H | NC | NC | NC | NC | NC | NC |
| MT-1X | 8.24 | 10.91 | 7.01 | 11.07 | 10.82 | 7.02 |
| MT-2A | 1.79 | 3.21 | 3.01 | 7.13 | 7.66 | 2.85 |
NC, Not computable.
Direct Sequencing of RT-PCR Products and Secondary Structure Analysis
MT-1A, MT-1H, and MT-1X mutations were detected in all of the cell lines whereas mutations of MT-1E and MT-1G isoforms were observed only in myoepithelial cells (Table 6) ▶ . Silent mutations at the third base of a codon such as those found in MT-1A, MT-1E, MT-1G, MT-1H, and MT-1X isoforms are not uncommon in human genes but bear little phenotypic significance. Sequencing of the myoepithelial MT-1G product also showed the insertion of three additional nucleotides (CAG) between the first and second bases of codon 10, adding an alanine residue. A comparison of the predicted secondary structures of the MT-1G wild-type versus its variant polypeptide according to the model of Garnier and colleagues 36 showed minor differences between the two proteins (Figure 4) ▶ . Sequencing of the MT-1H amplicons revealed multiple mutations at codons 8, 10, 13, 50, and within the 3′ and 5′ untranslated regions (Table 6) ▶ . Two cysteines at codons 13 and 50 were substituted by tyrosine and arginine, respectively, while glutamic acid at position 8 was replaced by alanine in the MT-1H amplicons. Furthermore, secondary structure predictions indicated several notable differences between the MT-1H wild-type polypeptide compared with its mutant counterpart (Figure 5) ▶ . These data imply the existence of a novel hitherto unreported mutant MT-1H gene whose sequence was deposited with GenBank under accession number AF3333888. The presence of the mutant isoforms was also observed in the surgically resected breast tissues.
Table 6.
Mutations in the MT Isoforms of the Amplified Products
| Product | Cell line | Codon region | Mutation | Amino acid change |
|---|---|---|---|---|
| MT-1A | All | 49 | ATA → ATC | No |
| MT-1E | Myoepithelial | 48 | TGC → TGT | No |
| MT-1G | Myoepithelial | 10 | GGT → GCAGGT | Gly → Ala Gly |
| 46 | CAA → CAG | No | ||
| 3′ UTR | ||||
| 50* | T → C | No | ||
| MT-1H | All | 5′ UTR | ||
| 19† | A → G | No | ||
| 22† | T → G | No | ||
| 8 | GAG → GCC | Glu → Ala | ||
| 10 | GGT → GGA | No | ||
| 13 | TGC → TAC | Cys → Tyr | ||
| 50 | TGC → CGC | Cys → Arg | ||
| 53 | GCG → GCT | No | ||
| 54 | TCA → TCG | No | ||
| 55 | GAG → GAA | No | ||
| 3′ UTR | ||||
| 10* | A → T | No | ||
| 19* | G → C | No | ||
| 22* | A → G | No | ||
| 47* | A → G | No | ||
| MT-1X | All | 39 | GTC → GTG | No |
Mutated nucleotides and amino acids are shown in bold.
*Nucleotide distance from stop codon.
†Nucleotide distance from start codon.
UTR; Untranslated region; Gly; glycine; Ala; alanine; Cys; cysteine; Tyr; tyrosine; Arg; arginine; Glu; glutamic acid.
Figure 4.

Comparison of the predicted secondary structure of the MT-1G wild-type (A) versus its variant polypeptide (B). A minor structural difference present in the variant polypeptide is highlighted, by #.
Figure 5.

Comparison of the predicted secondary structure of the MT-1H wild-type (A) versus its variant polypeptide (B). There was a radical structural alteration with the two coils in the vicinity of the mutation site (*codon 10) being replaced by a β-sheet, and another drastic change in the structure of the variant in which coils and β-sheets replaced two β-sheets in the prototype (**).
Detection of MT Proteins by Immunohistochemistry
Positive MT-staining was detected in all of the breast cell lines with both nuclear and cytoplasmic staining being observed in the cell (Figure 6; A to C) ▶ . MT staining was intense in all of the breast cell lines except ZR75-1 cells, which portrayed weaker and patchy staining (not shown). The negative controls did not exhibit any MT staining (Figure 6D) ▶ .
Figure 6.
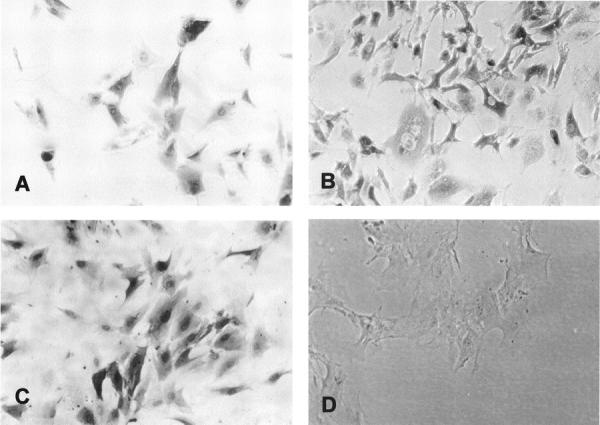
Light micrographs of MT staining in Hs578T (A), MDA-MB-231 (B), and myoepithelial (C) cells. A negative control of myoepithelial cells in which buffer was used instead of the primary E9 antibody is shown in D.
Discussion
Expression of specific MT isoforms may hold the key to the functional significance of MT overexpression in tumor tissues. 16 In this study, the functional MT-1 and MT-2 isoforms were analyzed by conventional and real-time RT-PCR. As opposed to conventional RT-PCR, which is semiquantitative and has a high variability, real-time RT-PCR allows reliable, accurate, and reproducible quantification of gene expression. 37,38
There was absence of MT-1B mRNA expression in breast cell lines and tissues concurring with earlier reports. 39,40 Although the MT-1B transcript is not detectable in human kidney, 21 the protein has been demonstrated in equine kidney, 41 implying that expression of MT-1B may be species-specific. However, the MT-1B transcript has also been observed to be induced by zinc in erythrocyte precursors in human cord blood, 42 thereby suggesting that the MT-1B isoform is probably an inducible minor isoform in humans, which may play a role against metal detoxification.
The expression profile of isoforms was examined in myoepithelial cells. Immunohistochemistry and RT-PCR confirms a myoepithelial phenotype in CALLA-isolated cells (CK14, β4-integrin-positive cells expressing the myoepithelial-associated DSg3, and the myoepithelial and stromal-related protein tenascin), and a luminal phenotype in EMA-isolated cells (CK18-positive cells lacking the myoepithelial-related CK14, DSg3, and tenascin). In this study, we observed that the MT-1G isoform was expressed only in myoepithelial cells but not in any of the five breast cancer cell lines. This finding was also verified in adjacent benign breast tissues from mastectomy specimens. However, we are still unclear as to the significance of the detection of MT-1G isoform in breast cancer tissues.
Although the function of breast myoepithelial cells is to expel milk from the secretory acini, loss of myoepithelial cells has been observed to be one of the characteristics of invasive breast cancer. 43 It is believed that myoepithelial cells suppress tumor invasion by virtue of their high constitutive expression of proteinase inhibitors and they have also been shown to modulate tumor cell gene expression. 33,44 The fact that MT-1G is expressed only in myoepithelial cells but not in cancer cell lines in vitro warrants further investigations into the significance of this observation. Analysis of the myoepithelial MT-1G sequence revealed additional three nucleotides (CAG) between the first and second bases of codon 10. This may have resulted from alternative RNA splicing at the acceptor site of intron 1 because there exists a GT dinucleotide immediately downstream of CAG. These three nucleotides are predicted to generate an extra alanine residue at codon 10. Because alanine is a nonpolar, uncharged, and hydrophobic amino acid, it may have little influence on the biochemical properties of MT-1G protein. The predicted secondary structure of the mutant MT-1H isoform showed only minor changes.
MT-1E mRNA was expressed in Hs578T, MDA-MB-231, and myoepithelial cells and in breast tissues. A common feature of Hs578T and MDA-MB-231 cells is their estrogen receptor (ER)-negative status whereas T47D, ZR75-1, and MCF7 cells are ER-positive. These results are consistent with that reported by Friedline and colleagues 39 in which differential expression of the MT-1E gene was observed in ER-positive and ER-negative human breast cancer cell lines and that reported by Jin and colleagues 45 in ER-negative human invasive ductal breast cancer tissues. However, Barnes and co-workers 46 detected a low level of MT-1E mRNA in the ER-positive PMC42 human breast cancer cell line. Interestingly, PMC42 cells are believed to show stem cell features 47 and have been shown to exhibit myoepithelial differentiation, 48 hence it is possible that the MT-1E isoform was detected in cells that have undergone myoepithelial differentiation. ER-negative breast tumors are reported to be more aggressive than their ER-positive counterparts. 49 As transformation from a hormone-dependent ER-positive to a hormone-independent ER-negative tumor is believed to be a crucial step in breast cancer progression, MT-1E isoform expression may be an alternative mechanism that replaces the function of ER. 43,50 It is also interesting that myoepithelial cells are known to express the ERβ protein but not the ERα protein. 51
Constitutive expression of MT-1A was not detectable by real-time RT-PCR in all of the cell lines. Because MT-1A expression is associated with exposure to heavy metals such as zinc, 52 its expression level may be cell-type-specific and inducible. Silent mutations of MT-1A observed were similar to that reported by Sato and colleagues 53 who detected MT-1A mRNAs that harbor several silent mutations in Japanese patients with age-related macular degeneration. Recently, we reported that MT-1F mRNA expression correlated with histological grade in breast carcinoma. 54 In that study, MT-1F mRNA expression was found to be significantly higher in grade 3 tumors as compared to grade 1 and 2 tumors. However, no definite pattern of expression with regard to the invasiveness of the breast cancer cell lines was observed in this present study. Down-regulation of the MT-1X isoform has been documented in advanced prostate cancers. 55 Although the levels of MT-1X expression in this study were generally higher in the more invasive breast cancer cell lines when analyzed by conventional RT-PCR, this trend was not obvious when the MT-1X isoforms were analyzed by real-time RT-PCR. Lack of correlation of the MT-1X isoform in the breast cell lines and the prostate tissues could in part be explained by their different embryonic origins. 16
MT-2A gene expression has been linked with the basic process of cell proliferation. 40 In addition, Abdel-Mageed and Agrawal 34 have demonstrated that down-regulation of MT-2A induces growth arrest in MCF7 breast cancer cells suggesting close involvement of MT-2A in the proliferative activity of breast cancer cells. MT-2A mRNA transcripts in MCF7 cells were significantly lower when compared with those in Hs578T, MDA-MB-231, and T47D cells by semiquantitative RT-PCR. The ranking of MT-2A mRNA expression in the five breast cancer cell lines was as follows: MDA-MB-231 > Hs578T > T47D > ZR75-1 > MCF7. A similar trend in MT-2A expression was also observed by real-time PCR. The MT-2A data seems to suggest a possible relationship between invasiveness of breast cancer cells and expression of the MT-2A isoform.
Similar to the MT-1A isoform, the expression levels of MT-1H mRNA were low and similar in all of the cell lines. A significant variant MT-1H isoform was detected and the sequence of this mutant MT-1H mRNA was deposited in GenBank under “MT-1H-like gene, mRNA” under accession number AF333388. To our knowledge, this is the first report describing mutations with amino acid replacements in an MT isoform. Although all mammalian MTs are reported to contain 20 cysteines, 2 this variant MT-1H isoform contains 18 cysteine residues. The substitution with aromatic amino acid tyrosine appears to exclude this mutant MT-1H as a typical MT. 56 The mutated MT-1H in this study may represent a new member of MT-1, because its amino acid at position 11 is glycine rather than aspartic acid. 57 On the other hand, amplification of this variant by primers specific for MT-1H also makes it possible that MT-1H is polymorphic or has an RNA-editing variant. It is unlikely that the mutant MT-1H isoform is an artifact of long-term cultured cells because the mutant isoform was detected in the breast tissues. It is also likely that the mutant 1H isoform is a polymorphic variant rather than the result of somatic mutation, 58 because it was present in both cancerous and adjacent benign breast tissues.
In this study, we have demonstrated the differential expression of MT-1E and MT-2A isoforms in the more malignant breast cancer phenotypes. The MT-1E isoform may mediate invasiveness by influencing the expression of the ER. Expression levels of the MT-2A isoform seem to be associated with the degree of invasiveness of the breast cancer cell lines. Of interest is the finding that similar high levels of MT-1E, MT-2A, and MT-1X are detected in normal myoepithelial cells. It is widely accepted that the majority of breast carcinomas are derived from luminal epithelial cells, although it is increasingly evident from tissue studies that a variable proportion of breast carcinomas may express markers that are more characteristic of myoepithelial cells, including CK14 59 and P-cadherin, 60 and expression of these markers is associated with a more aggressive phenotype. Perou and colleagues 61 performed cDNA microarray analysis on a series of 65 carcinomas and using hierarchical clustering analysis, demonstrated a subset of ER-negative tumors that expressed myoepithelial-related genes. There is thus a growing body of evidence to suggest that a proportion of breast carcinomas may exhibit a myoepithelial phenotype and this is associated with more aggressive behavior.
Given the acknowledged tumor-suppressor role of myoepithelial cells in the breast, the correlation of MT isoform expression profile with the more invasive ER-negative breast cancer cells appears anomalous. However, we have recently shown that the invasive capacity of breast cancer cell lines correlates closely with features of the myoepithelial phenotype. 32 Some workers have suggested that carcinomas showing a more myoepithelial phenotype are aggressive because they contain a stem-cell population. 62 However, the myoepithelial phenotype that confers the ability to express matrix metalloproteinases and matrix proteins such as tenascin, as well as β4-integrin, which has been related to tumor invasive capacity, 63 may also contribute to the aggressive phenotype. The biological roles of the different MT isoforms and mechanism by which differential expression of the MT-2A isoform may regulate invasiveness of breast cancer cells remain to be elucidated. In this context, another interesting finding of this study was that the MT-1G isoform was expressed only in breast myoepithelial cells but not in cancer cells in vitro. Whether this contributes to the nonmalignant nature of the myoepithelial cell, and the significance of lack of expression in other cancer cell lines exhibiting an otherwise similar MT isoform profile to myoepithelial cells requires further studies.
This study provides further insight in the biology of breast cancer metastasis, and may pave the way for novel approaches to diagnosis and therapy of metastatic breast disease. We have also demonstrated the presence of a significant MT-1H variant with amino acid substitutions in its protein sequence, opening up a new avenue of research in the regulation, expression, specificity, and functions of mutant MT isoforms.
Table 5.
ΔΔCT Values of MT Isoforms by Real-Time RT-PCR with Myoepithelial Cells as the Reference Cell Line
| Gene | MDA-MB-231 | Hs578T | T47D | ZR75-1 | MCF7 |
|---|---|---|---|---|---|
| MT-1E | −1.99 | 2.09 | NC | NC | NC |
| MT-1F | 3.5 | 5.01 | −0.98 | 2.41 | 0.87 |
| MT-1X | 1.22 | 3.89 | −0.01 | 4.05 | 3.80 |
| MT-2A | −1.06 | 0.36 | 0.16 | 4.28 | 4.81 |
NC, Not computable.
Acknowledgments
We thank Valerie Lin and Hyunh Hung for providing breast cancer cell lines; and S. T. Dheen, E. S. Yong, and C. P. Low for assistance.
Footnotes
Address reprint requests to Boon-Huat Bay, M.B.B.S., Ph.D., Department of Anatomy, Faculty of Medicine, National University of Singapore, 4 Medical Dr., Blk MD10, S 117 597, Singapore. E-mail: antbaybh@nus.edu.sg.
Supported by the National Medical Research Council, Singapore (grant 0612/2001).
S.-K. T. and O. J.-K. T. contributed equally to this article.
References
- 1.Kagi JH, Schaffer A: Biochemistry of metallothionein. Biochemistry 1988, 27:8509-8515 [DOI] [PubMed] [Google Scholar]
- 2.Miles AT, Hawksworth GM, Beattie JH, Rodilla V: Induction, regulation, degradation, and biological significance of mammalian metallothioneins. Crit Rev Biochem Mol Biol 2000, 35:35-70 [DOI] [PubMed] [Google Scholar]
- 3.Nagel WW, Vallee BL: Cell cycle regulation of metallothionein in human colonic cancer cells. Proc Natl Acad Sci USA 1995, 92:579-583 [DOI] [PMC free article] [PubMed] [Google Scholar]
- 4.Jayasurya A, Bay BH, Yap WM, Tan NG, Tan BKH: Proliferative potential in nasopharyngeal carcinoma: correlations with metallothionein expression and tissue zinc levels. Carcinogenesis 2000, 21:1809-1812 [DOI] [PubMed] [Google Scholar]
- 5.Jayasurya A, Bay BH, Yap WM, Tan NG: Correlation of metallothionein expression with apoptosis in nasopharyngeal carcinoma. Br J Cancer 2000, 82:1198-1203 [DOI] [PMC free article] [PubMed] [Google Scholar]
- 6.Ebadi M, Leuschen MP, El Refaey H, Hamada FM, Rojas P: The antioxidant properties of zinc and metallothionein. Neurochem Int 1996, 29:159-166 [DOI] [PubMed] [Google Scholar]
- 7.Roesijadi G: Metal transfer as a mechanism for metallothionein-mediated metal detoxification. Cell Mol Biol 2000, 46:393-405 [PubMed] [Google Scholar]
- 8.Kelly SL, Basu A, Teicher BA, Hacker MP, Hamer DH, Lazo JS: Over expression of metallothionein confers resistance to anticancer drugs. Science 1988, 241:1813-1815 [DOI] [PubMed] [Google Scholar]
- 9.Satoh M, Cherian MG, Imura N, Shimizu H: Modulation of resistance to anticancer drugs by inhibition of metallothionein synthesis. Cancer Res 1994, 54:5255-5257 [PubMed] [Google Scholar]
- 10.Kling PG, Olsson P: Involvement of differential metallothionein expression in free radical sensitivity of RTG-2 and CHSE-214 cells. Free Radic Biol Med 2000, 28:1628-1637 [DOI] [PubMed] [Google Scholar]
- 11.Cai L, Cherian MG: Zinc-metallothionein protects from DNA damage induced by radiation better than glutathione and copper- or cadmium-metallothioneins. Toxicol Lett 2003, 136:193-198 [DOI] [PubMed] [Google Scholar]
- 12.Nartey N, Cherian MG, Banerjee D: Immunohistochemical localization of metallothionein in human thyroid tumors. Am J Pathol 1987, 129:177-182 [PMC free article] [PubMed] [Google Scholar]
- 13.Cherian MG, Huang PC, Klaassen CD, Liu YP, Longfellow DG, Waalkes MP: National Cancer Institute Workshop on the possible roles of metallothionein in carcinogenesis. Cancer Res 1993, 53:922-925 [PubMed] [Google Scholar]
- 14.Cherian MG, Howell SB, Imura N, Klaassen CD, Koropatnick J, Lazo JS, Waalkes MP: Role of metallothionein in carcinogenesis. Toxicol Appl Pharmacol 1994, 126:1-5 [DOI] [PubMed] [Google Scholar]
- 15.Goulding H, Jasani B, Pereira H, Reid A, Galea M, Bell JA, Elston CW, Robertson JF, Blaney RW, Nicholson RA, Schmid KW: Metallothionein expression in human breast cancer. Br J Cancer 1995, 72:968-972 [DOI] [PMC free article] [PubMed] [Google Scholar]
- 16.Jasani B, Schmid KW: Significance of metallothionein overexpression in human tumours. Histopathology 1997, 3:211-214 [DOI] [PubMed] [Google Scholar]
- 17.Fan LZ, Cherian MG: Potential role of p53 on metallothionein induction in human epithelial breast cancer cells. Br J Cancer 2002, 87:1019-1026 [DOI] [PMC free article] [PubMed] [Google Scholar]
- 18.Palmiter RD, Findley SD, Whitmore TE, Durnam DM: MT-III, a brain-specific member of the metallothionein gene family. Proc Natl Acad Sci USA 1992, 89:6333-6337 [DOI] [PMC free article] [PubMed] [Google Scholar]
- 19.Quaife CJ, Findley SD, Erickson JC, Froelick GJ, Kelly EJ, Zambrowicz BP, Palmiter RD: Induction of a new metallothionein isoform (MT-IV) occurs during differentiation of stratified squamous epithelia. Biochemistry 1994, 33:7250-7259 [DOI] [PubMed] [Google Scholar]
- 20.Stennard FA, Holloway AF, Hamilton J, West AK: Characterisation of six additional human metallothionein genes. Biochim Biophys Acta 1994, 1218:357-365 [DOI] [PubMed] [Google Scholar]
- 21.Mididoddi S, McGuirt JP, Sens MA, Todd JH, Sens DA: Isoform-specific expression of metallothionein mRNA in the developing and adult human kidney. Toxicol Lett 1996, 685:17-27 [DOI] [PubMed] [Google Scholar]
- 22.Karin M, Eddy RL, Henry WM, Haley LL, Byers MG, Shows TB: Human metallothionein genes are clustered on chromosome 16. Proc Natl Acad Sci USA 1984, 81:5494-5498 [DOI] [PMC free article] [PubMed] [Google Scholar]
- 23.West AK, Stallings R, Hildebrand CE, Chiu R, Karin M, Richards RI: Human metallothionein genes: structure of the functional locus at 16q13. Genomics 1990, 8:513-518 [DOI] [PubMed] [Google Scholar]
- 24.Jahroudi N, Foster R, Price-Huaghey J, Beitel G, Gedamu L: Cell-type specific and differential regulation of the human metallothionein genes: correlation with DNA methylation and chromatin structure. J Biol Chem 1990, 265:6506-6511 [PubMed] [Google Scholar]
- 25.Foster R, Gedamu L: Functional analyses of promoter elements responsible for the differential expression of the human metallothionein (MT)-IG and MT-IF genes. J Biol Chem 1991, 266:9866-9875 [PubMed] [Google Scholar]
- 26.Samson SL, Paramchuk WJ, Shworak NW, Gedamu L: Functional analyses of the human metallothionein-IG gene. In vitro and in vivo studies. J Biol Chem 1995, 270:25194-25199 [DOI] [PubMed] [Google Scholar]
- 27.De Larco JE, Wuertz BR, Manivel C, Furcht LT: Progression and enhancement of metastatic potential after exposure of tumor cells to chemotherapeutic agents. Cancer Res 2000, 61:2857-2861 [PubMed] [Google Scholar]
- 28.Henrikson KP, Salazar SL, Fenton JW, II, Pentecost BT: Role of thrombin receptor in breast cancer invasiveness. Br J Cancer 1999, 79:401-406 [DOI] [PMC free article] [PubMed] [Google Scholar]
- 29.Thompson EW, Paik S, Brunner N, Sommers CL, Zugmaier G, Clarke R, Shima TB, Torri J, Donahue S, Lippman ME, Dickson RB: Association of increased basement membrane invasiveness with absence of estrogen receptor and expression of vimentin in human breast cancer cell lines. J Cell Physiol 1992, 150:534-544 [DOI] [PubMed] [Google Scholar]
- 30.Jin R, Bay BH, Chow VTK, Tan PH, Dheen ST: Significance of metallothionein expression in breast myoepithelial cells. Cell Tissue Res 2001, 303:221-226 [DOI] [PubMed] [Google Scholar]
- 31.Gomm JJ, Browne PJ, Coope RC, Lin QY, Bulawela L, Coomes RC: Isolation of pure populations of epithelial and myoepithelial cells from the normal human mammary gland using immunogenetic separation with Dynabeads. Anal Biochem 1995, 225:91-99 [DOI] [PubMed] [Google Scholar]
- 32.Gordon LA, Mulligan KT, Maxwell-Jones H, Adams M, Walker RA, Jones JL: Breast cell invasive potential relates to the myoepithelial phenotype. Int J Cancer 2003, 106:8-16 [DOI] [PubMed] [Google Scholar]
- 33.Jones JL, Shaw JA, Pringle JH, Walker RA: Primary breast myoepithelial cells exert an invasion-suppressor effect on breast cancer cells via paracrine down-regulation of MMP expression in fibroblasts and tumour cells. J Pathol , (in press) [DOI] [PubMed]
- 34.Abdel-Mageed AB, Agrawal KC: Antisense down-regulation of metallothionein induces growth arrest and apoptosis in human breast carcinoma cells. Cancer Gene Ther 1997, 4:199-207 [PubMed] [Google Scholar]
- 35.Burger H, Foekens JA, Look MP, Meijer-van Gelder ME, Klijn JG, Wiemer EA, Stoter G, Nooter K: RNA expression of breast cancer resistance protein, lung resistance-related protein, multidrug resistance-associated proteins 1 and 2, and multidrug resistance gene 1 in breast cancer: correlation with chemotherapeutic response. Clin Cancer Res 2003, 9:827-836 [PubMed] [Google Scholar]
- 36.Garnier J, Osguthorpe DJ, Robson BJ: Analysis of the accuracy and implications of simple methods for predicting the secondary structure of globular proteins. J Mol Biol 1978, 120:97-120 [DOI] [PubMed] [Google Scholar]
- 37.Bustin SA: Absolute quantification of mRNA using real-time reverse transcription polymerase chain reaction assays. J Mol Endocrinol 2000, 25:169-193 [DOI] [PubMed] [Google Scholar]
- 38.Schrader AJ, Lauber J, Lechner O, Heidenreich A, Hofmann R, Buer J: Application of real-time reverse transcriptase-polymerase chain reaction in urological oncology. J Urol 2003, 169:1858-1864 [DOI] [PubMed] [Google Scholar]
- 39.Friedline JA, Garrett SH, Somji S, Todd JH, Sens DA: Differential expression of the MT-1E gene in estrogen-receptor-positive and -negative human breast cancer cell lines. Am J Pathol 1998, 152:23-27 [PMC free article] [PubMed] [Google Scholar]
- 40.Jin R, Chow VTK, Tan PH, Dheen ST, Duan W, Bay BH: Metallothionein 2A expression is associated with cell proliferation in breast cancer. Carcinogenesis 2002, 23:81-86 [DOI] [PubMed] [Google Scholar]
- 41.Chassaigne H, Lobinski R: Characterization of horse kidney metallothionein isoforms by electrospray MS and reversed-phase HPLC-electrospray MS. Analyst 1998, 123:2125-2130 [DOI] [PubMed] [Google Scholar]
- 42.Rahman MT, De Ley M: Metallothionein isogene transcription in red blood cell precursors from human cord blood. Eur J Biochem 2001, 268:849-856 [DOI] [PubMed] [Google Scholar]
- 43.Ysaziji H, Gown AM, Sneige N: Detection of stromal invasion in breast cancer: the myoepithelial markers. Adv Anat Pathol 2000, 7:100-109 [DOI] [PubMed] [Google Scholar]
- 44.Sternlicht MD, Kedeshian P, Shao ZM, Safarians S, Barsky SH: The human myoepithelial cell is a natural tumor suppressor. Clin Cancer Res 1997, 3:1949-1958 [PubMed] [Google Scholar]
- 45.Jin R, Bay BH, Chow VT, Tan PH, Lin VC: Metallothionein 1E mRNA is highly expressed in estrogen receptor-negative human invasive ductal breast cancer. Br J Cancer 2000, 83:319-323 [DOI] [PMC free article] [PubMed] [Google Scholar]
- 46.Barnes NL, Ackland ML, Cornish EJ: Metallothionein isoform expression by breast cancer cells. Int J Biochem Cell Biol 2000, 32:895-903 [DOI] [PubMed] [Google Scholar]
- 47.Whitehead RH, Quirk SJ, Vitali AA, Funder JW, Sutherland RL, Murphy LC: A new human breast carcinoma cell line (PMC42) with stem cell characteristics. III. Hormone receptor status and responsiveness. J Natl Cancer Inst 1984, 73:643-648 [PubMed] [Google Scholar]
- 48.Dempsey PJ, de Kretser TA, Brown RW, Whitehead RH, Jose DG: A monoclonal antibody CIBr17 recognizes a myoepithelium-specific antigen in human mammary gland. Int J Cancer 1986, 37:857-866 [DOI] [PubMed] [Google Scholar]
- 49.Carmeci C, Thompson DA, Kuang WW, Lightdale N, Furthmayr H, Weigel RJ: Moesin expression is associated with the estrogen receptor-negative breast cancer phenotype. Surgery 1998, 124:211-217 [PubMed] [Google Scholar]
- 50.Mckenzie K, Sukumar S: Cellular and Molecular Mechanisms of Hormonal Carcinogenesis: Environmental Influences. Huff J Boyd J Barrett JC eds. 1996:pp 183-209 Wiley-Liss New York
- 51.Shaw JA, Udokang K, Mosquera J-M, Chauhan H, Jones JL, Walker RA: Oestrogen receptors alpha and beta differ in normal human breast and breast carcinomas. J Pathol 2002, 198:450-457 [DOI] [PubMed] [Google Scholar]
- 52.Garrett SH, Somji S, Todd JH, Sens MA, Sens DA: Differential expression of human metallothionein isoform I mRNA in human proximal tubule cells exposed to metal. Environ Health Perspect 1998, 106:825-832 [DOI] [PMC free article] [PubMed] [Google Scholar]
- 53.Sato M, Abe T, Tamai M: Analysis of the metallothionein gene in age-related macular degeneration. Jpn J Ophthalmol 2000, 44:115-121 [DOI] [PubMed] [Google Scholar]
- 54.Jin R, Bay BH, Chow VTK, Tan PH: Metallothionein 1F mRNA expression correlates with histological grade in breast carcinoma. Breast Cancer Res Treat 2001, 1933:1-8 [DOI] [PubMed] [Google Scholar]
- 55.Garrett SH, Sens MA, Shukla D, Flores L, Somji S, Todd JH, Sens DA: Metallothionein isoform 1 and 2 gene expression in the human prostate: downregulation of MT-1X in advanced prostate cancer. Prostate 2000, 43:125-135 [DOI] [PubMed] [Google Scholar]
- 56.Kojima Y, Binz PA, Kagi JHR: Nomenclature of metallothionein: proposal for a revision. Klaassen CD eds. Metallothionein IV. 1999:pp 3-6 Birkhauser Verlag Basel
- 57.Binz PA, Kagi JHR: Metallothionein: molecular evolution and classification. Klaassen CD eds. Metallothionein IV. 1999:pp 7-13 Birkhauser Verlag Basel
- 58.Jasani B, Campbell F, Navabi H, Schnid KW, Williams GT: Clonal overexpression of metallothionein is induced by somatic mutation in morphologically normal colonic mucosa. J Pathol 1998, 184:144-147 [DOI] [PubMed] [Google Scholar]
- 59.Wetzels RHW, Holland R, van Haelst UJGM, Lane EB, Leig IM, Ramaekers FCS: Detection of basement membrane components and basal cell keratin 14 in non-invasive and invasive carcinomas of the breast. Am J Pathol 1989, 134:571-579 [PMC free article] [PubMed] [Google Scholar]
- 60.Peralta Soler A, Knudsen KA, Salazar H, Han AC, Keshgegian AA: P-Cadherin in breast carcinoma indicates poor survival. Cancer 1999, 86:1263-1272 [DOI] [PubMed] [Google Scholar]
- 61.Perou CM, Sorlie T, Eisen MB, van de Rijn M, Jeffrey SS, Rees CA, Pollack JR, Ross DT, Johnsen H, Akslen LA, Fluge O, Pergamenschikov A, Williams C, Zhu SX, Lonning PE, Borresen-Dale AL, Brown PO, Botstein D: Molecular portraits of human breast tumours. Nature 2000, 406:747-752 [DOI] [PubMed] [Google Scholar]
- 62.Taylor-Papidimitriou J, Berdichevsky F, D’Souza B, Burchill J: Human models of breast cancer. Cancer Surv 1993, 16:59-78 [PubMed] [Google Scholar]
- 63.Rabinovitz I, Mercurio AM: The integrin alpha 6 beta 4 functions in carcinoma cell migration on laminin-1 by mediating the formation and stabilization of actin-containing motility structures. J Cell Biol 1997, 139:1873-1884 [DOI] [PMC free article] [PubMed] [Google Scholar]