

Abstract
Glucose transporter protein type 1 (GLUT1) is a major glucose transporter of the fertilized egg and preimplantation embryo. Haploinsufficiency for GLUT1 causes the GLUT1 deficiency syndrome in humans, however the embryo appears unaffected. Therefore, here we produced heterozygous GLUT1 knockout murine embryonic stem cells (GT1+/−) to study the role of GLUT1 deficiency in their growth, glucose metabolism, and survival in response to hypoxic stress. GT1(−/−) cells were determined to be nonviable. Both the GLUT1 and GLUT3 high-affinity, facilitative glucose transporters were expressed in GT1(+/+) and GT1(+/−) embryonic stem cells. GT1(+/−) demonstrated 49 ± 4% reduction of GLUT1 mRNA. This induced a posttranscriptional, GLUT1 compensatory response resulting in 24 ± 4% reduction of GLUT1 protein. GLUT3 was unchanged. GLUT8 and GLUT12 were also expressed and unchanged in GT1(+/−). Stimulation of glycolysis by azide inhibition of oxidative phosphorylation was impaired by 44% in GT1(+/−), with impaired up-regulation of GLUT1 protein. Hypoxia for up to 4 hours led to 201% more apoptosis in GT1(+/−) than in GT1(+/+) controls. Caspase-3 activity was 76% higher in GT1(+/−) versus GT1(+/+) at 2 hours. Heterozygous knockout of GLUT1 led to a partial GLUT1 compensatory response protecting nonstressed cells. However, inhibition of oxidative phosphorylation and hypoxia both exposed their increased susceptibility to these stresses.
The first facilitative glucose transporter identified, characterized, and cloned was the HepG2 cell/erythrocyte/brain glucose transporter protein type 1 (GLUT1). 1 This is now the best characterized of 12 identified GLUT isoforms. 2 GLUT1 is believed to play a key role in maintaining basal glucose uptake for metabolism in many cell types. 3-6 Its expression is detectable throughout preimplantation development from the oocyte through the blastocyst stage, 7-9 and it increases 11-fold in developing embryos from the two-cell stage to the blastocyst. 7 This suggests it plays an important nutritional role in development, and previous studies indicated GLUT1 may be important in supplying glucose for the glycolytic pathway. 10-14 Another high-affinity glucose transporter expressed in embryos at the blastocyst stage is GLUT 3, although this transporter is not present at the beginning of gestation in rodents. GLUT3 may also supply glucose for maintenance of cell nutrition. 3,5,15,16 The tissue-specific expressions and different kinetic properties of GLUT isoforms indicate their potential for unique roles in cell glucose metabolism, and this has stimulated further research to determine their roles in normal and neoplastic growth, diabetes, apoptosis, and other conditions. 3,5,17-21
In the GLUT1 deficiency syndrome (GLUT1-DS), also known as glucose transporter protein syndrome, 22 affected individuals have haploinsufficiency for GLUT1 23,24 because of missense, nonsense, splice site, insertional, or deletional mutations. 25 The disorder manifests from childhood onwards, with developmental impairment and seizures because of hypoglycorrachia. 24 The ability of the GLUT1-DS embryos to survive gestation without obvious impairment suggests a compensatory mechanism exists to allow this.
Although GLUT1-DS infants typically appear normal at birth, they may later exhibit childhood seizures of multiple different types, developmental delay, acquired microcephaly, and a variety of motor disturbances with impaired coordination. 23,26
Therefore, in the current report we have produced heterozygous GLUT1 deficiency (gene knockout) in murine embryonic stem (ES) cells derived from the blastocyst stage embryo to characterize the responses of these ES cells to the deficiency. We identified a compensatory mechanism that could minimize damage to the nonstressed ES cells during gestation, and an impaired capacity of these ES cells to adapt to chemical inhibition of oxidative phosphorylation or hypoxia, exposing their vulnerability to such stresses.
Materials and Methods
Cloning of Mouse GLUT1 Genomic Fragments
A partial digest SauI mouse genomic library from strain DBA-2J in phage vector EMBL-3 (Clontech, Palo Alto, CA) was screened by hybridization with a 32P-labeled human GLUT1 cDNA probe to isolate four partial GLUT1 clones, two overlapping. One of these DNA clones, later used to build gene-targeting constructs, was partially sequenced by the Sanger method (35S) with 5′ and 3′ 25-mer synthetic oligonucleotide primers, to confirm its identity as GLUT1.
Mapping of GLUT1 Genomic Clones and Assembly of a Gene-Targeting Construct
The GLUT1 genomic fragments were mapped by restriction fragment analysis to determine the plan for construction. HindIII restriction sites inside and 3′ to exon 6 were identified, which could be used to excise the 3′ portion of the exon, and create a mutant, nonfunctional coding sequence. The gene fragment was first subcloned into a plasmid vector pBS SKII+ (Stratagene, La Jolla, CA) that was modified by removing the HindIII cloning site. This allowed for excision of the HindIII fragment in the GLUT1 genomic insert, which is the 3′ portion of exon 6, without excising other portions of the genomic insert from the plasmid. A blunt-end phosphoglycerate kinase promoter-neomycin resistance gene (PGKneoR) cassette was ligated into the site where the 3′ end of exon 6 had been removed. Phosphoglycerate kinase promoter-thymidine kinase gene (PGKTK) was then excised by XbaI from its carrier plasmid pBS SKII+. This PGKTK cassette was then blunted and ligated to the 3′ end of the GLUT1 fragment. The entire construct then consisted of pBS SKII+ containing a GLUT1 genomic fragment with 5.7 kb of homology, plus a deletion mutation in exon 6, PGKneoR disrupting exon 6, and PGKTK at the 3′ end of the fragment. The construct was then linearized by XhoI at the 5′ end, leaving the carrier plasmid as a 3′ cap over PGKTK. This linearized gene-targeting construct was used to transfect ES cells by electroporation.
A 1.66-kb human GLUT1 cDNA probe that binds to genomic GLUT1 DNA immediately 3′ to the point of insertion of the targeting construct was used as an adjacent probe to confirm insertion of the targeting construct inside the endogenous GLUT1 gene of ES cells after homologous recombination. HindIII restriction sites inside the construct and 3′ to the construct allowed excision of a 5.3-kb fragment containing both a portion of the targeting construct with PGKneoR inside it, and a 1.92-kb 3′ fragment of endogenous, ES cell genomic GLUT1 DNA. Both GLUT1 and PGKneoR 32P-labeled probes bound to this 5.3-kb band on the Southern blots, confirming the targeting construct had inserted within the GLUT1 gene (not shown). The relative quantities of targeted and nontargeted GLUT1 alleles as determined by optical scanning densitometry of the 3.4- and 5.3-kb bands, were identical as would be expected for a single copy gene with one normal allele and one targeted allele. Two additional targeted clones were identified similarly, for a targeting frequency of 3 of 450 or 0.67%. Examination of cell and colony morphology revealed no visible change in targeted ES cells at the light microscopic level. No visible evidence of cell differentiation was present in either nontargeted or targeted cells, and the latter continued to form the rounded, raised colonies typical of normal, totipotent ES cells.
Transfection of Mouse ES Cells with the GLUT1 Gene-Targeting Construct
CC1.2 mouse ES cells (2 × 10⁷) were transferred to 0.8 ml of Capecchi buffer 27 containing 1 pmol of the linearized HR construct. This mixture was transferred to a sterile electroporation cuvette (Bio-Rad Gene Pulser; Bio-Rad, Richmond, CA), where the cells were shocked with 400 V. They were then seeded to gelatinized culture plates and grown in selective media for isolation of G418- and Ganciclovir-resistant clones (positive to negative selection).
Isolation of GLUT1-Targeted ES Cell Clones
Individual, G418- and Ganciclovir-resistant colonies were picked and transferred to separate wells of 24-well culture plates. The clones were grown until nearly confluent and then transferred to individual wells of six-well culture plates. Again the clones were allowed to become nearly confluent, whereupon they were divided into two fractions, one to be frozen, and one to be passed to new six-well plates. DNA was isolated from each clone by high-salt precipitation. 28 Southern analysis using a 32P-labeled human GLUT1 cDNA probe that bound to genomic GLUT1 DNA adjacent (3′) to the insertion site of the targeting construct, resulted in the appearance of a new band of larger size (5.3 kb versus 3.4 kb), which was used to verify homologous recombination within the GLUT1 gene. The remaining, nontargeted GLUT1 allele at 3.4 kb was also identified by the probe as expected. The corresponding targeted cell clones were retrieved from the freezer and their DNA reanalyzed by Southern analysis to confirm the targeting events.
Northern Analysis of GLUT mRNAs in Targeted and Nontargeted ES Cell Clones
Cells were seeded at a density of 5 × 10⁵ cells per 150-mm culture plate, and grown until 90 to 100% confluent (7 days). On the final day of growth total RNA was harvested using a commercial preparation of guanidinium and phenol (RNA STAT-60; Tel-Test Inc., Friendswood, TX). The total RNA from each sample was isolated by following the manufacturer’s instructions. RNA was resuspended in diethyl pyrocarbonate-treated double-distilled water, and stored at −80°C until use. RNA samples (20 μg each) were denatured in glyoxal/dimethyl sulfoxide at 55°C for 1 hour, then loaded to individual wells of a 10 mmol/L sodium phosphate/1% agarose gel. Gels were run at 90 V overnight. Subsequently, they were stained with ethidium bromide, destained, and photographed. Integrity and equal lane loading of RNA was confirmed by inspection of ribosomal RNA bands. Gels were blotted to Genescreen membranes (Perkin Elmer Life Sciences, Boston, MA) for 36 hours with 10× standard saline citrate using a standard method 28 (1× standard saline citrate = 150mmol/L NaCl, 15mmol/L sodium citrate, pH 7.0). Blots were then UV-fixed, prehybridized, and probed for individual GLUT isoforms and β-tubulin, using the respective cDNAs. The latter were 32P-labeled by the random hexamer priming method (PRIME-1 kit; Sigma-Aldrich, St. Louis, MO). Blots were washed in 2× standard saline citrate with 1% sodium dodecyl sulfate at room temperature for 30 minutes for two times, then in 0.2× standard saline citrate with 1% sodium dodecyl sulfate at 55°C for 20 minutes for two times. They were then exposed to Kodak XAR-5 film (Eastman-Kodak, Rochester, NY) for periods of 3 to 14 days, and autoradiograms were analyzed by optical scanning densitometry (Howtek, ScanMaster 3+; Howtek, Inc., Hudson, NH) with the NIH Image gel plotting software (version 1.52; National Technical Information Service, Springfield, VA). Relative quantities of GLUT mRNAs in nontargeted versus targeted ES cells were compared after normalization to mRNA for the housekeeping gene, β-tubulin.
Immunoblotting of GLUTs in Targeted and Nontargeted ES Cells
Sodium dodecyl sulfate-polyacrylamide gel electrophoresis gels (10%) were used to run 100 μg of total protein per lane, as determined for each sample by the Lowry assay. 29 Equal lane loading was further confirmed on some immunoblots with antibody to β-tubulin or by quantitative copper/silver staining. A chemiluminescent immunoblot assay (ECL Western blot kit; Amersham Life Sciences, Buckinghamshire, UK) was used in which luminol was used to detect GLUT protein bands identified by specific, rabbit anti-rat GLUT1 (reacts also with mouse GLUT1) and rabbit anti-mouse GLUT3 polyclonal antibodies (East Acres Biologicals, Southbridge, MA). These antibodies are directed against the 12 C-terminal peptides of the GLUT1 and GLUT3 proteins. Identification of GLUT1 and GLUT3 bands on immunoblots was confirmed by determination of band size, followed by competition experiments in which preadsorption of either the GLUT1 or GLUT3 antibody with the respective C-terminal peptide antigen was observed to block appearance of the band. Additional antibodies for GLUTs 4, 8, 9, and 12 were also obtained for immunoblotting in GT1(+/+) and GT1(+/−) cells. The GLUT4 and GLUT8 antibodies were obtained from Dr. Maureen Charron, Albert Einstein School of Medicine, Bronx, New York; the GLUT9 antibody was obtained from Dr.’s Jeffrey and Kelle Moley, Washington University, St. Louis, MO; and the GLUT12 antibody was obtained from A.D.I., Inc. (Alpha Diagnostics Inc., San Antonio, TX). Detection of GLUT8 protein required modification of our standard immunoblotting protocol as described by Dr. M. Charron’s laboratory. Addition of a combination of protease inhibitors to the extraction buffer was important because of the potential for rapid degradation of GLUT8 protein: aprotinin (2 μg/ml), leupeptin (5 μg/ml), and pepstatin (0.5 μg/ml) were included along with phenylmethyl sulfonyl fluoride (34 mg/ml) in this solution. In addition, dithiothreitol was added to the loading dye solution (400 μl dithiothreitol per 600 μl loading dye solution to make a 4× loading mix), to take advantage of the stabilizing effect reducing agents have on GLUT8. Samples for GLUT8 were incubated at 55°C for 1 hour in the presence of the loading mix. GLUT8 detection was performed with a rabbit polyclonal GLUT8 antibody directed against the C-terminal 11 amino acids, 30 using the Pierce ECL Detection Kit following the manufacturer’s instructions (Pierce, Rockford, IL).
Determination of GLUT1 Protein Half-Lives
Cycloheximide (10 μg/ml = 36 μmol/L; Sigma-Aldrich) was used to inhibit protein synthesis as previously described. 31 The decay curves and half-lives of GLUT1 in targeted and nontargeted cells were determined by quantitating changes in GLUT1 protein on immunoblots at preselected time points after addition of cycloheximide to the standard growth medium.
Measurement of 3H2-Deoxyglucose (3H2-DOG) Uptake Rates
The 3H2-DOG uptake rates were determined in targeted and nontargeted ES cells using a modification of the method of Haneda and colleagues. 32 ES cells were seeded to 35-mm culture plates at 50% confluence and allowed to attach for 24 hours. They were then washed twice with phosphate-buffered saline (PBS), and 1 ml of 3H2-DOG (Perkin Elmer Life Sciences) in PBS (3.27 pmol, 0.1 μCi/ml) was added to each plate for 5 minutes, followed by rapid aspiration of the isotope, and two washes with PBS. Cells from individual plates were then dissolved in 1 ml of 1 N NaOH, one third of which went for protein measurements, and two thirds of which were transferred to scintillation vials for counting. Preliminary time course experiments indicated that the 5-minute time point was within the linear portion of the uptake curve. Dose-response experiments of the 5-minute glucose uptake rates versus medium glucose concentration were used to generate Lineweaver-Burk plots from which Km and Vmax values were determined for ES cell glucose transporters in the two cell types.
Cell Growth Curves for Targeted versus Nontargeted Clones
Cells (1 × 10⁴) were seeded to 0.79-cm 2 wells of gelatinized eight-well glass chamber slides and allowed to grow from 1 to 15 days. Cell counts were performed and averaged on four wells for each cell type and day, on multiple days throughout this 15-day period. The growth curves of nontargeted and targeted cells were then compared.
Stimulation of Glycolysis by Inhibition of Oxidative Phosphorylation
Sodium azide (5 mmol/L, Sigma-Aldrich) was added to media of cells for 12 hours as previously described. 11,12 This compound inhibits oxidative phosphorylation and thereby stimulates glycolysis. A modification of the method of Shetty and colleagues 12 was used, and media was collected after 12 hours for measurements of lactate concentration. Equal numbers of cells were seeded to each 150-mm plate (5 × 10⁵). Lactate release to the medium was determined from total lactate measurements by subtracting the baseline concentration of lactate in the medium. Lactate measurements were expressed as μmol/mg cell protein. All lactate measurements were performed with a standard assay kit (Sigma-Aldrich), following the manufacturer’s instructions.
Model for Hypoxic Stress of ES Cells
Cell-culture dishes (60 mm) were coated with 0.1% gelatin for 30 minutes, then the excess gelatin was removed and the dishes allowed to dry for 30 minutes. ES cells (8 × 10⁴) were then seeded to the dishes with 2 ml of media. They were allowed to grow to 30 to 50% confluence, then the media was changed and 1 ml of fresh media added. Hypoxia was induced by placing the cells in a Plexiglas chamber with a continuous flow of water-saturated 95% N2 and 5% CO2 maintained over the cells at 37°C. 33 The PO2 was lowered to less than 5 mmHg by adding Oxyrase (bacterial monooxygenases and dioxygenases; Oxyrase Inc., Ashland, OH) to the culture medium at a final concentration of 6% as previously described. 33 The control cells were placed in the regular cell-culture incubator at 37°C where they were exposed to air plus 5% CO2 without oxyrase. The cells were incubated for 1, 2, and 4 hours, before propidium iodide staining and the terminal dUTP nick-end labeling (TUNEL) assay to assess them for apoptosis.
Propidium Iodide Staining of ES Cells to Detect Apoptosis
At the selected time points (1, 2, and 4 hours), the media was collected from the dishes and transferred to a 15-ml tube on ice. Then 0.5 ml of trypsin was added to the dishes for 3 to 5 minutes at room temperature to release the cells. One ml of media was then added to the cells to inhibit the trypsin effect, and the cells were transferred to the 15-ml tube on ice to be combined with the previous media. The cells were then centrifuged at 1000 rpm for 1 minute at 4°C in a Beckman centrifuge with a GS-6R rotor. Next, they were resuspended in 30% methanol with PBS for 5 minutes. The cells were then centrifuged again at 1000 rpm for 1 minute at 4°C. They were resuspended in 100 μl of 1:1000 propidium iodide (PI) (no. P-4170, Sigma Chemical Co.) in PBS and stained for 1 minute. Subsequently, 20 to 30 μl of this mix was placed on a glass slide with coverslip and the edges sealed with Permount (ProSciTech, Kelso, Australia). The cells were then counted and the percentage of cells with apoptotic nuclear morphology, including condensed and fragmented nuclei as previously described, 34 was determined for GLUT1-targeted (GT1+/−) and nontargeted (GT1+/+) ES cells exposed to hypoxic and normoxic conditions.
TUNEL Assay for Apoptosis in ES Cells
The TUNEL assay was performed using a commercial assay on adherent cells after paraformaldehyde fixation and permeabilization, following the manufacturer’s instructions (Roche Diagnostics, Basel, Switzerland). The incorporated fluorescein-dUTP in the assay allowed detection of TUNEL-positive ES cells by fluorescence microscopy. The percentage of TUNEL-positive cells was determined for GLUT1-targeted (GT1 +/−) and nontargeted (GT1 +/+) ES cells with a 1-hour exposure to hypoxia or normoxia.
Caspase-3 Activity Assay
Measurements of ES cell caspase-3 activity were performed using a previously published method 35 to complement the propidium iodide and TUNEL apoptosis assays. ES cells were plated into 60-mm tissue-culture dishes (0.1% gelatin-coated). Subsequently, the cells were washed once with 1 ml of 1× PBS (pH 7.4). They were then trypsinized with 1 ml of Trypsin-EDTA (1×) for 2 to 5 minutes, and transferred to a new 15-ml tube. The culture dishes were rinsed with 1 ml of PBS and this was transferred into the same tube. The cells were centrifuged at 3,000 to 4,000 rpm for 5 minutes, then the supernatant was discarded. The cells were washed again with 1 ml of PBS, then recentrifuged, and the supernatant discarded. Fifty μl of lysis buffer (142 mmol/L KCl, 5 mmol/L MgCl2, 10 mmol/L Hepes, 1 mmol/L EGTA, 0.2% Nonidet P-40, pH 7.4, plus a protease inhibitor (Complete, Roche Co.) was added to each pellet, then the cells were allowed to sit on ice for 30 minutes. The cells were then transferred into a microfuge tube and centrifuged at 14,000 rpm for 30 minutes at 4°C. The supernatant was transferred to a new tube, and the pellet was discarded. Thirty μl of protein was added to the reaction solution (2 ml of PBS plus 2.5 μl of substrate). Control tubes with only PBS or the reaction solution (2 ml of PBS plus 2.5 μl of substrate) were also prepared. The protein was incubated with the reaction solution for 1 hour at 37°C, then transferred to a cuvette for readings with excitation at 380 and emission at 460. Caspase-3 activity was compared for GT1(+/+) versus GT1(+/−) ES cells exposed for 0 and 2 hours to the same hypoxic environment used for the propidium iodide and TUNEL apoptosis assays. Activity results were plotted as percentage of the 0-hour activity of GT1(+/+) control cells.
Statistics
The Student’s t-test was used for comparisons between two experimental groups, with P < 0.05 required for significance. One-way analysis of variance was performed to determine significance for data involving more than two groups. The Bonferroni t-test correction or Scheffé’s posthoc test were used to confirm statistical differences in situations in which more than one group comparison was made. P < 0.05 was considered significant. Polynomial regression analyses were performed for comparisons of paired curves, with P < 0.05 considered significant. Data are presented as mean ± SEM in the text and graphs.
Results
Murine ES cells (CC1.2 line, 36 ) were targeted at the GLUT1 gene as described in Materials and Methods, to produce the GT1(+/−) heterozygous GLUT1 knockout ES cells (Figure 1, A and B) ▶ . This knockout of GLUT1 was confirmed with internal and adjacent probes on Southern analysis. In contrast, no viable double-knockout ES cells could be obtained. A high G418 selection procedure (2 mg/ml) that typically gives 2 to 54% double-knockout cell clones for nonlethal genes, 37 gave 0% viable double knockouts for the GLUT1 gene in 450 screened cell clones, indicating homozygous GLUT1 knockout was lethal.
Figure 1.

A: This diagram depicts the restriction map and modifications made to a cloned GLUT1 mouse genomic DNA fragment containing exon 6, to build the final targeting (homologous recombination) construct shown. The original fragment was 12.2 kb long. A 0.8-kb HindIII fragment including the 3′ end of exon 6 was removed, and the PGKneoR cassette inserted here in the 3′ to 5′ orientation. The pGKTK cassette was ligated to the 3′ end of the genomic fragment. The finished product was carried in pBS SKII+. This circular DNA was linearized at a unique 5′ XhoI site to produce the final homologous recombination construct as shown. The plasmid flanks the pGKTK gene at the 3′ end of the linearized construct. B: This Southern blot of HindIII-digested genomic DNA from four ES cell clones was hybridized with an adjacent 1.66-kb GLUT1 cDNA probe that would recognize both the normal gene at 3.4 kb and the targeted gene at 5.3 kb. The clone in lane 3 demonstrates the expected genotype for successful gene targeting at the GLUT1 locus. The homologous recombination construct inserts into one copy of the GLUT1 gene. The HindIII restriction enzyme cuts both inside the construct, and beyond the 3′ end of the construct in adjacent ES cell genomic GLUT1 DNA. This allows the GLUT1 probe to recognize the same HindIII band (at 5.3 kb) as a PGKneoR probe when the homologous recombination construct containing the PGKneoR sequence has successfully inserted into the ES cell GLUT1 gene. C: Northern blots of GLUT1 and GLUT3 mRNAs in ES cells are shown here. The GT1(+/+) ES cells are the nontargeted cells, whereas the GT1(+/−) ES cells are the heterozygous GLUT1-targeted ES cells. The β-tubulin transcript is shown for the same lanes to confirm even lane loading and normalize GLUT1 transcript levels to the β-tubulin housekeeping mRNA level. Optical scanning densitometry was used to determine the 49 ± 4% decrease of GLUT1 mRNA with heterozygous targeting of the GLUT1 gene. In contrast, no significant change in GLUT3 mRNA was detected in these targeted ES cells. D: GLUT1 protein in ES cells was detected as a band at ∼46 kd, and this band competed away with 25 μg/ml of the specific GLUT1 peptide antigen. GLUT3 protein was identified at 44 to 46 kd, possibly because of variations in glycosylation, and these bands competed away with 25 μg/ml of specific GLUT3 peptide antigen. GT1(+/+) ES cells are the nontargeted ES cells, and GT1(+/−) are the heterozygous GLUT1-targeted ES cells.
GT1(+/−) ES cells and their control, nontargeted GT1(+/+) ES cells were therefore used to study the effects of GLUT1 deficiency on cell growth, glucose metabolism, and susceptibility to hypoxic stress. The effects of heterozygous GLUT1 knockout in ES cells were first assessed by Northern analyses (Figure 1C) ▶ of targeted and nontargeted ES cells, which detected a single 2.8-kb GLUT1 transcript. A single 4.0-kb transcript was identified for GLUT3, another high-affinity, facilitative glucose transporter detected in the ES cells. The sizes of the GLUT1 and GLUT3 transcripts detected were consistent with previous reports in the literature. 4,38 GLUT mRNA levels were normalized to the endogenous β-tubulin mRNA levels for comparisons. The GLUT1 mRNA level was reduced by 49 ± 4% in targeted cells (expected 50% lower; n = 5 each group, P < 0.001), versus no significant change in the GLUT3 mRNA level (Figure 3 ▶ , top). This result was consistent with targeted inactivation of one GLUT1 allele. Northern analyses for GLUT2 and GLUT4 in targeted and nontargeted ES cells detected no mRNAs.
Figure 3.
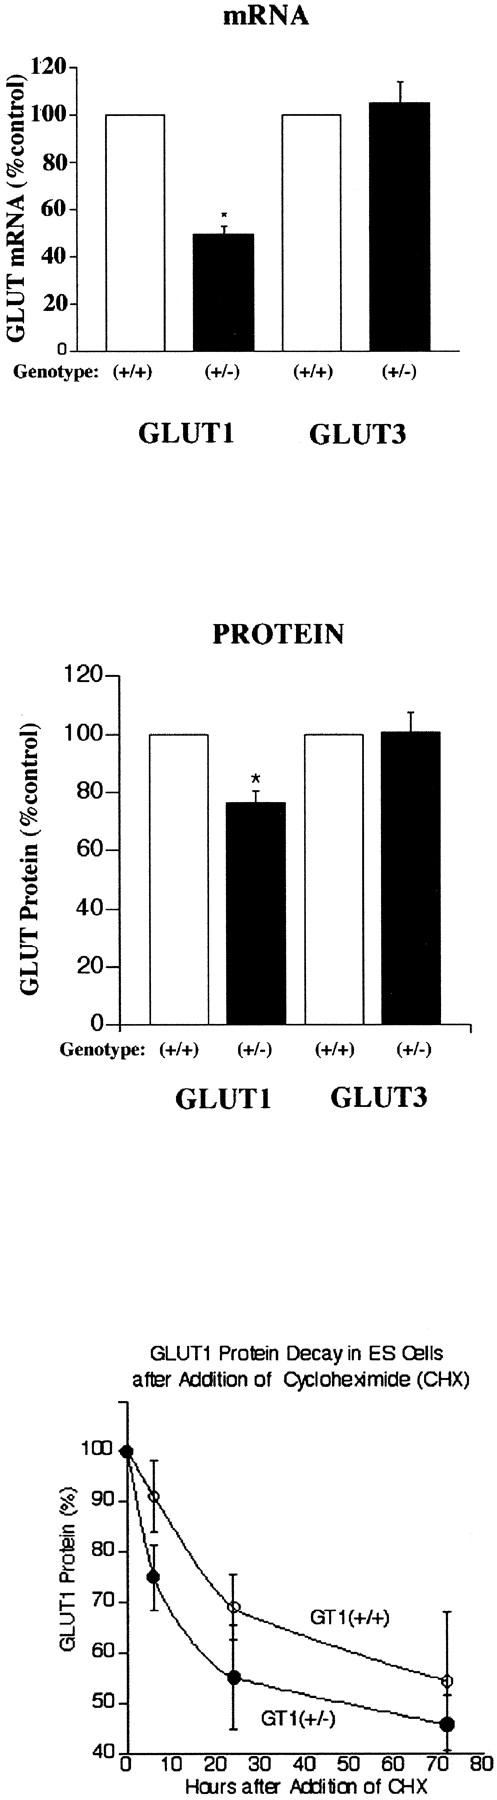
Top: GLUT1 and GLUT3 mRNA levels in GT1(+/+) and GT1(+/−) ES cells. *, P < 0.001 versus GLUT1 mRNA in GT1(+/+). Middle: GLUT1 and GLUT3 protein levels in GT1(+/+) and GT1(+/−) ES cells. *, P < 0.005 versus GLUT1 protein in GT1(+/+). Bottom: GLUT1 protein decay curves in GT1(+/+) and GT1(+/−) ES cells treated with 10 μg/ml of cycloheximide (CHX). Polynomial regression analysis indicated no statistical difference between the two curves for GT1(+/+) cells (open circles) and GT1(+/−) cells (closed circles), P = 0.661, n = 4 to 10 at each time point.
Subsequent immunoblotting of GLUT1 protein in the two types of cells identified the transporter at ∼46 kd (Figure 1D) ▶ , and indicated partial GLUT1 compensation by the heterozygous targeted cells. Instead of the expected 50% decrease in GLUT1 protein, there was only a 24 ± 4% decrease (n = 5 each group, P < 0.005), as shown in Figure 3 ▶ , middle. This indicated a posttranscriptional, partial compensatory mechanism for maintenance of GLUT1 protein levels, consistent with increased translation of the remaining GLUT1 mRNA and/or increased stability of the GLUT1 protein. Cycloheximide (10 μg/ml) treatment of the ES cells revealed no significant difference in the GLUT1 protein decay curves in GT1(+/−) versus GT1(+/+) cells as determined from immunoblots (Figure 3 ▶ , bottom); half life ∼72 hours in both cell types, P = 0.661 for GT1(+/−) versus GT1(+/+) decay curves, with n = 4 to 10 at each time point. Cell killing throughout 72 hours with cycloheximide was similar for the two cell types: 57.6 ± 5.6% and 73.4 ± 10.2% for GT1(+/+) and GT1(+/−) cells, respectively, P > 0.1. After washing of the cultured cells, 93 to 99% of the cells harvested from each group for immunoblotting were viable by the trypan blue exclusion test. This suggested the GLUT1 partial compensatory response was due to increased synthesis of GLUT1 polypeptide via a posttranscriptional mechanism, rather than a prolonged GLUT1 half life. GLUT3 protein was identified at 44 to 46 kd (Figure 1D) ▶ with variable degrees of glycosylation. The GLUT3 protein level was unchanged in GT1(+/−) ES cells as determined by immunoblotting (mean increase, 0.8 ± 6.6%; P > 0.5; Figure 1D ▶ and Figure 3 ▶ , middle). Additional immunoblots were performed to test for expression of GLUT4, GLUT8 (recently described in preimplantation embryos), GLUT9, and GLUT12. GLUT4 and GLUT9 were undetectable in both GT1(+/+) and GT1(+/−) ES cells. In contrast, GLUT8 (Figure 2 ▶ , 33 kd) and GLUT12 (Figure 2 ▶ , 50 kd) were identified in both cell types, with no significant changes in the GT1(+/−) cells. This detection of GLUT8 and GLUT12 in ES cells is to our knowledge the first demonstration of their expression in this cell type, and is consistent with a previous report identifying GLUT8 in whole preimplantation embryos. 39 The sizes of the GLUT1, GLUT3, GLUT8, and GLUT12 proteins described here in ES cells are consistent with previous reports in the literature. 39-43
Figure 2.

Immunoblots of GLUT12, GLUT8, and β-tubulin proteins from GT1(+/+) and GT1(+/−) ES cells. This figure identifies for the first time the expression of GLUT12 and GLUT8 in ES cells. Neither isoform was significantly altered in GT1(+/−) cells that have heterozygous inactivation of the GLUT1 gene. GLUT12 was identified at ∼50 kd and GLUT8 at ∼33 kd, consistent with their previously reported sizes in other cell types as described in the text.
The mean initial (5 minute) glucose uptake rate was 19 ± 9% lower in GLUT1-targeted cells (689.1 ± 76.9 versus 850.3 ± 76.6 fmol 3H2-DOG/mg protein/5 minutes, n = 9 in each group), using trace (3.27 pmol/ml) quantities of extracellular glucose (not shown), however the difference was not statistically significant (P < 0.2), consistent with the partial GLUT1 compensatory response detected by immunoblotting (Figure 1D ▶ and Figure 3 ▶ , middle). Examination of the 5-minute glucose uptake rates throughout a range of extracellular glucose concentrations demonstrates a tendency of GT1(+/−) cells for reduced glucose uptake (Figure 4 ▶ , top). The majority of glucose transport in both cell types was inhibited by cytochalasin B (20 μmol/L), as expected for cells expressing predominantly facilitative glucose transporters (GLUTs). Glucose uptake was inhibited to similar extents in GT1(+/+) and GT1(+/−) ES cells: 86.2 ± 2.7% in GT1(+/+), and 87.8 ± 1.7% in GT1(+/−), P > 0.5. The Vmax values for glucose uptake were 109.2 ± 24.6 nmol/mg/minute in GT1(+/+) cells versus 84.0 ± 17.0 nmol/mg/minute in GT1(+/−) cells (values are means from three separate experiments, mean Vmax 23.1% lower in GT1(+/−) cells but not statistically significant: P < 0.5). The Km values were 3.2 ± 0.2 mmol/L for GT1(+/+) cells and 2.4 ± 0.5 mmol/L for GT1(+/−) cells (means from three experiments, P < 0.2). In addition, although GT1(+/−) cells exhibited an initial growth lag (Figure 4 ▶ , bottom), the growth curves for cells adapted to the 37°C incubator environment were otherwise similar for the two cell types (P = 0.744). Therefore, by responding to heterozygous knockout of GLUT1 with a partial recovery of GLUT1 protein expression, the GT1(+/−) cells were able to maintain near normal growth and glucose transport activities in normal media. The affinities of GLUT proteins for glucose in the two cell types were similar as indicated by the similar Km values. Relative amounts of the high-affinity GLUT1 and GLUT3 proteins were not determined, however both are known to have low Km values in the 1 to 7 mmol/L range 5 consistent with the Km values determined here.
Figure 4.
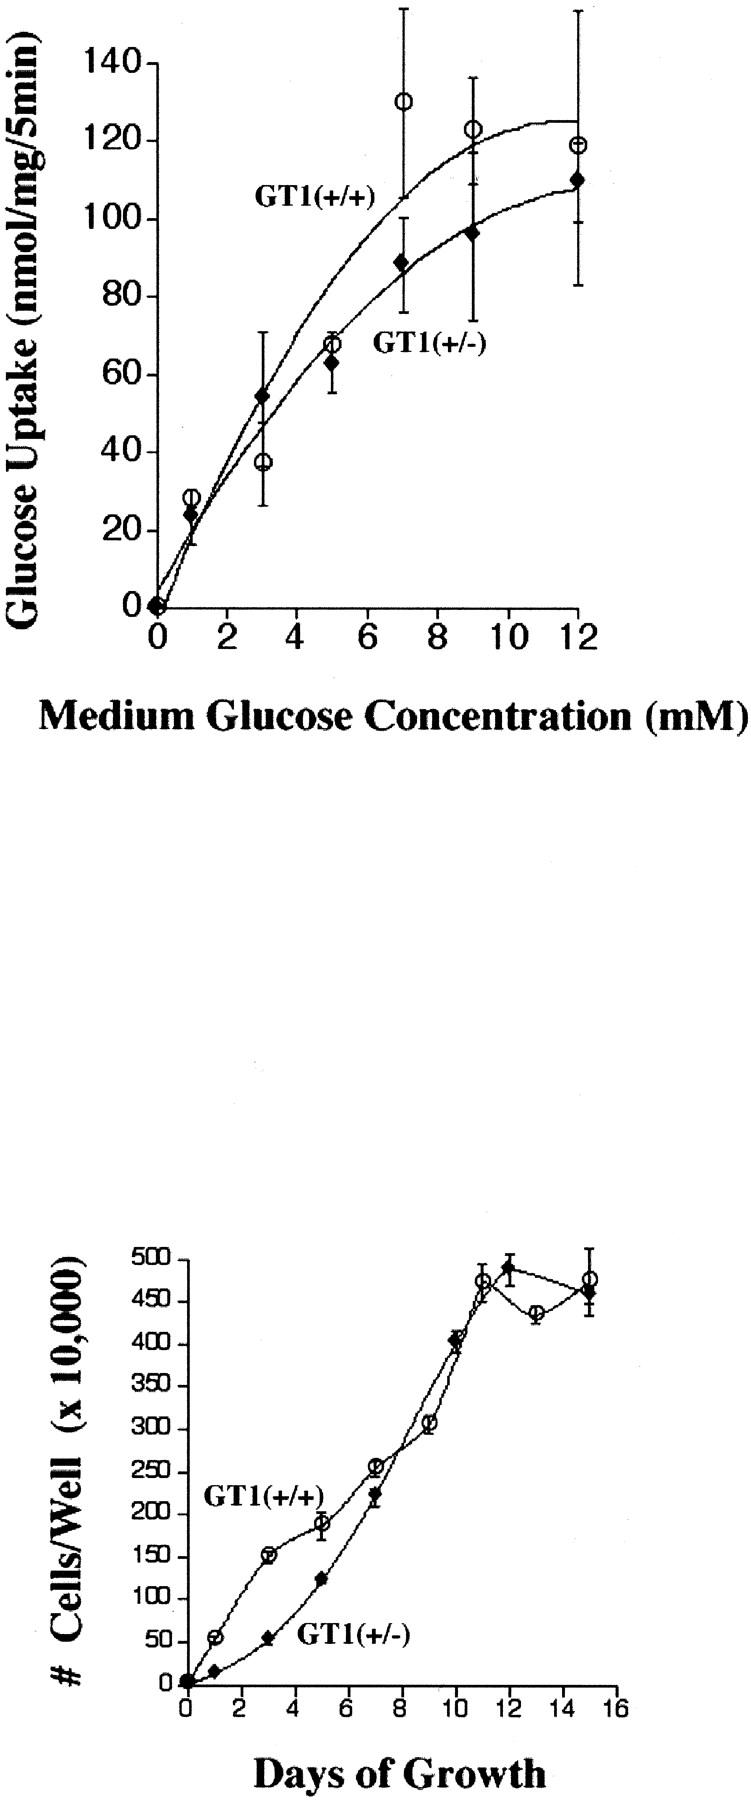
Top: The 5-minute 3H2-DOG uptake rates are shown for extracellular glucose concentrations ranging from 0 to 12 mmol/L. Although there was a tendency for lower glucose uptake in GT1(+/−) ES cells, the difference in the initial 5-minute glucose uptake rates using trace quantities of 3H2-DOG was not statistically significant (P < 0.2, see text). Bottom: Growth of GT1(+/+) and GT1(+/−) ES cells throughout 15 days in culture. The growth curves of the two cell types were similar except at the early time points (days 1 to 5) when initial growth of the GT1(+/−) ES cells appeared to be mildly delayed.
Subsequently, we tested in two different ways the capability of GT1(+/−) ES cells to respond to stress, and compared their responses to those of the control GT1(+/+) ES cells. When nontargeted (GT1+/+) and targeted (GT1+/−) cells were treated with 5 mmol/L of sodium azide for 12 hours to inhibit oxidative phosphorylation and stimulate glycolysis, the GT1(+/−) cells demonstrated an impaired capacity to increase glycolysis. This was displayed by a smaller increase in lactate release from the GT1(+/−) cells (Figure 5 ▶ , top). Although lactate release increased significantly in response to sodium azide in both the GT1(+/−) and GT1(+/+) cells, the mean lactate release increased 1746 μmol/mg protein in GT1(+/+) cells (153 ± 4.5% increase, n = 4 each group, P < 0.002), versus an increase of only 980 μmol/mg protein in GT1(+/−) cells (83.8 ± 4.2% increase, n = 4 each group, P < 0.002). The increase in sodium azide-stimulated lactate release from GT1(+/−) cells was 44% less than that from GT1(+/+) cells (P < 0.005), despite the fact that baseline nonstressed (without azide) lactate release was similar in the two groups (1140 ± 44.6 μmol/mg cell protein from GT1(+/+) cells versus 1170 ± 23 μmol/mg cell protein from GT1(+/−) cells, P > 0.5). The degree of cell killing from sodium azide exposure throughout the 12-hour treatment period was similar for GT1(+/+) and GT1(+/−) ES cells: 53.4 ± 5.7% and 43.3 ± 6.2%, respectively (P > 0.2). After washing the cells, 95 to 99% of the cells harvested for measurement of total protein were viable by the trypan blue exclusion test. The extended viability of ES cells similarly treated with sodium azide for 12 hours was also examined by trypan blue exclusion at 72 hours after azide removal, and their capacity to recover was tested by passing them to new culture plates. The percent viable cells in each group at 72 hours were as follows: 53 ± 25% of GT1(+/+) ES cells and 28 ± 3% of GT1(+/−) ES cells were viable by the trypan blue exclusion test, P > 0.05. In addition, ES cells of each genotype that had been observed for 72 hours after removal of the azide were trypsinized and reseeded to new plates. Both the GT1(+/+) and GT1(+/−) ES cells grew to confluence without obvious difficulty, confirming their capacity to recover after the azide exposure. Changes in GLUT1 and GLUT3 protein levels were determined in GT1(+/+) and GT1(+/−) ES cells with and without 12 hours of sodium azide treatment (Figure 5 ▶ , bottom, and Figure 6 ▶ ). GLUT1 protein increased 387% (P < 0.02) in GT1(+/+) ES cells in response to sodium azide treatment (Figure 5 ▶ , bottom, and Figure 6 ▶ ) versus a 56% increase in GT1(+/−) ES cells (P < 0.02). GLUT3 protein levels did not significantly change in response to sodium azide treatment of either cell type (Figure 5 ▶ , bottom, and Figure 6 ▶ ). The mean GLUT3 protein level was reduced 10 ± 14% in GT1(+/+) cells with sodium azide, and increased 8 ± 16% in GT1(+/−) cells with sodium azide, P > 0.1 versus control in each case. Therefore, heterozygous knockout of GLUT1 in ES cells led to an impaired capacity for up-regulation of this transporter in response to inhibition of oxidative phosphorylation. This effect was associated with impairment of glycolytic capacity as described.
Figure 5.

Top: Graph of lactate release from GT1(+/+) and GT1(+/−) ES cells with and without 12 hours of 5 mmol/L sodium azide treatment to inhibit oxidative phosphorylation. *, P < 0.002 versus lactate release by GT1(+/+) cells without sodium azide treatment. **, P < 0.002 versus lactate release by GT1(+/−) cells without sodium azide treatment. Bottom: Graph of GLUT protein levels in GT1(+/+) and GT1(+/−) ES cells, in response to 12 hours of 5 mmol/L of sodium azide treatment (closed bar) to inhibit oxidative phosphorylation. GLUT1 protein was significantly increased by azide in both the GT1(+/+) cells [*, P < 0.02 versus (−) azide control] and the GT1(+/−) cells [**, P < 0.02 versus (−) azide control] (n = 10 in each group). However, the increase of GLUT1 protein in GT1(+/−) cells was substantially less. GLUT3 protein levels were unchanged with sodium azide treatment in both cell types, P > 0.1 for azide versus control in both GT1(+/+) and GT1(+/−) ES cells, n = 7 in each group. GLUT protein levels are shown as percent, where the (−) azide control for each group (open bar) is set at 100%.
Figure 6.

Top: Western blots of GLUT1 protein in GT1(+/+) and GT1(+/−) ES cells with and without sodium azide treatment (5 mmol/L, 12 hours) to inhibit oxidative phosphorylation. Sodium azide treatment stimulated significant increases of GLUT1 protein in both GT1(+/+) and GT1(+/−) cells. Bottom: Western blots of GLUT3 protein in GT1(+/+) and GT1(+/−) ES cells with and without sodium azide treatment (5 mmol/L, 12 hours) to inhibit oxidative phosphorylation. GLUT3 protein levels were unchanged with sodium azide treatment of both cell types. (A summary graph of the Western blot data is shown in Figure 5 ▶ and described in the text.)
We subsequently tested the susceptibility of the ES cells to hypoxic stress by measuring their frequencies of apoptosis under such conditions. ES cells were exposed to hypoxia (PO2 < 5 mmHg) for 1, 2, or 4 hours with a hypoxia chamber as previously described. 33 Detection of apoptosis in the cells was first performed by propidium iodide staining to identify condensed/fragmented nuclei. The baseline (nonhypoxic) frequency of apoptosis in GT1(+/−) ES cells was not significantly different from the frequency in control GT1(+/+) ES cells at each time point examined, ie, 1, 2, and 4 hours (Figure 7 ▶ , top). In contrast, with hypoxic stress the GT1(+/−) cells demonstrated a significantly higher rate of apoptosis at each time point: 33% higher at 1 hour, 77% higher at 2 hours, and 201% higher at 4 hours (P < 0.002 for each, Figure 7 ▶ , top); n = 12 for each group in Figure 7 ▶ , top. Therefore, the GT1(+/−) ES cells were much more susceptible to hypoxic stress, despite normal baseline rates of apoptosis. In separate experiments the TUNEL assay confirmed the propidium iodide findings: at 1 hour of hypoxia the GT1(+/−) cells had 40% more apoptosis than the GT1(+/+) control cells (P < 0.002, Figure 7 ▶ , bottom). Finally, the GT1(+/+) and GT1(+/−) ES cells were tested for caspase-3 activity after exposure to 0 and 2 hours of hypoxia. The results demonstrated that at 0 hours there was a trend for higher caspase-3 activity in the GT1(+/−) cells, although this was not statistically significant. However, at 2 hours of hypoxia caspase-3 activity had significantly increased in both cell types, and the activity was 76% higher in the GT1(+/−) cells than in the GT1(+/+) cells (Figure 8) ▶ , consistent with the findings of greater apoptosis in GT1(+/−) cells by the propidium iodide and TUNEL assays.
Figure 7.
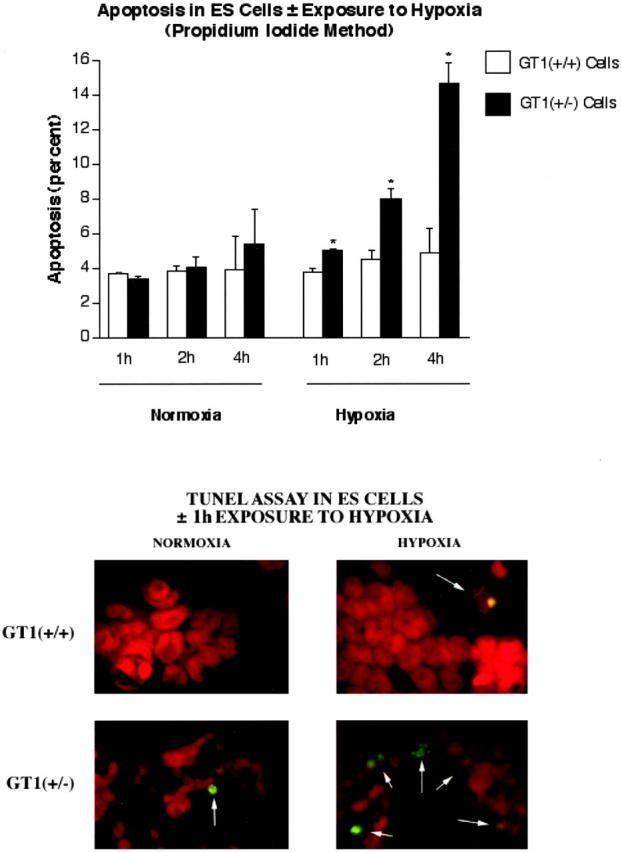
Top: Graph of the frequency of apoptosis in GT1(+/+) and GT1(+/−) ES cells with and without hypoxia for 1, 2, or 4 hours. Propidium iodide staining (red fluorescence) was used to examine nuclear morphology and detect apoptosis as condensed/fragmented nuclei (see Materials and Methods). *, P < 0.002 versus GT1(+/+) ES cells at the same time points, n = 12 for each group. Bottom: Identification of apoptosis in GT1(+/+) and GT1(+/−) ES cells ± exposure to 1 hour of hypoxia, using the TUNEL assay (green fluorescence). The ES cell nuclei were also stained with propidium iodide (red fluorescence). Original magnification for analysis of apoptosis was ×200. TUNEL-positive nuclei were significantly more frequent in the GT1(+/−) ES cells when both cell types were exposed to hypoxia, P < 0.002 versus GT1(+/+) cells, n = 12 for each group.
Figure 8.

Caspase-3 activity was measured in GT1(+/+) and GT1 (+/−) ES cells in response to 0 and 2 hours hypoxia, n = 3 to 5 in each group. At 0 hours, the GT1(+/−) cells demonstrated a trend for increased caspase-3 activity although the difference was not significant. Two hours of hypoxia significantly increased caspase-3 activity in both cell types (∂, P < 0.001 versus nonhypoxic for each), and the increase was 76% greater (*, P = 0.012) in the GT1(+/−) cells versus GT1(+/+). Staurosporine (2 μmol/L) shown on the right side of the graph was used as a positive control treatment to induce caspase-3 activity in each cell type.
Discussion
GLUT1 is a major glucose transporter of the preimplantation embryo, and blastocyst embryos develop apoptosis if GLUT1 protein is sufficiently suppressed. 44 However, embryos of GLUT1-haploinsufficient humans appear to be unaffected, and the signs and symptoms of the GLUT1-deficiency syndrome do not appear until childhood. 22,23,26,45 This suggests a protective compensatory mechanism is functioning during the development of these embryos. Therefore, in the present study we developed an in vitro model for GLUT1-haploinsufficient ES cells by gene targeting, to investigate how these cells derived from the inner cell mass of the blasotocyst would adapt to such a deficiency. The roles of GLUT1 in ES cell growth, glucose metabolism, and responses to selected stresses were assessed with and without heterozygous inactivation of the GLUT1 gene.
In the present report, cultured mouse ES cells were submitted to the stress of chemical inhibition of oxidative phosphorylation in the presence of normoxia, and to a hypoxic stress that secondarily impairs oxidative phosphorylation. GLUT1 glucose transporter transcription is reported to increase in response to both types of stress in other cell types, 11,12,46-50 whereas GLUT3 transcription does not typically respond to inhibition of oxidative phosphorylation in the absence of hypoxia. 51,52 Both GLUT1 and GLUT3 have been proposed to feed glycolysis and to play nutritional roles for maintenance of basal cell metabolism in cells in which they are expressed, in part based on their low Km values and predominant localization in plasma membranes. 3,3,14,16,53,54 There is substantial evidence to suggest this is the case for GLUT1, and evidence to support this proposal for GLUT3 is also accumulating. However, the patterns of GLUT1 and GLUT3 expression in mammals differ, with GLUT3 much more restricted in its distribution than GLUT1. 3,55 Within the preimplantation embryo, particularly the blastocyst, the patterns of GLUT1 and GLUT3 expression are substantially different, 56,57 as described below. One important functional difference between them is that GLUT3 may transport glucose at a higher rate than GLUT1, 58,59 potentially seven times faster, and therefore may be better suited to transport maternal glucose into the preimplantation embryo that encounters a low-glucose (1 mmol/L) environment. 56,60 GLUT1 is then proposed to transport glucose into the embryonic cells for metabolism. 56
Our investigations of facilitative glucose transporters in ES cells found that both GLUT1 and GLUT3 were expressed, whereas GLUTs 2, 4, and 9 were not. On additional testing, we found that both ES cell types expressed the recently described GLUT8 and GLUT12 proteins, with no significant change in expression of these transporters in the GT1(+/−) ES cells. The precise roles these latter two transporters play in embryonic glucose metabolism are not yet known, although GLUT8 has been shown to be important for survival of the whole preimplantation embryo. 42 To the best of our knowledge, the present report is the first to identify GLUT8 and GLUT12 expression in ES cells. GLUT8 was recently identified in whole mouse preimplantation embryos, in the trophectoderm and primitive endoderm. 42 GLUT12 was also recently discovered 43 and is expressed in multiple fetal and adult tissues. 43,61 However, it apparently has not been studied in preimplantation embryos before. The precise roles of GLUT8 and GLUT12 in glucose metabolism have not yet been defined in any cell type, however future studies of their roles in ES cell glucose metabolism will be of interest. Expression of GLUT1 and GLUT3 in ES cells has previously been observed by Iyer and colleagues. 62 GLUT1 and GLUT3 are both low Km, high-affinity, facilitative glucose transporters. Subsequent studies in the present report of GT1(+/+) control ES cells demonstrated a lack of GLUT3 response to chemical inhibition of oxidative phosphorylation under the normoxic condition, whereas GLUT1 was stimulated to increase. The control ES cells therefore appeared to behave similar to other cell types in this respect 11,12,47,51,52 : in contrast to GLUT1, inhibition of oxidative phosphorylation without hypoxia does not stimulate GLUT3 expression.
In addition, a novel finding in the GLUT1-targeted ES cells was that GLUT1 deficiency did not induce a compensatory increase in GLUT3, either with or without a stress exposure. This indicated that GLUT1 and GLUT3 in ES cells are regulated differently and may play different roles. In fact, the compensatory response to heterozygous knockout of GLUT1 came from GLUT1 itself, allowing the targeted ES cells to transport glucose, proliferate, and perform glycolysis at near normal levels in the basal, nonstressed condition. Their rate of apoptosis in the nonstressed condition was also similar to the rate of apoptosis in the nonstressed, control ES cells.
The phenotype of GLUT1 deficiency in the GLUT1-targeted ES cells (ie, GT1(+/−) cells) was first displayed by their responses to chemical inhibition of oxidative phosphorylation, which is expected to stimulate glycolysis. The GT1(+/−) cells displayed impaired capacity for anaerobic glycolysis by their reduced ability to produce lactate in this situation. The increase of GLUT1 protein was substantially greater in the control ES cells with this treatment than in the heterozygous GLUT1-targeted cells, which may explain the impaired capacity for enhancement of glycolysis in the targeted cells. Sodium azide- or 2-dinitrophenol treatment to inhibit oxidative phosphorylation in other cell types has been reported to induce compensatory increases in GLUT1 expression 11-13,47,51 as we observed in our control ES cells. This compensatory increase of GLUT1 presumably is induced to stimulate anaerobic glycolysis and ATP production, with the resultant production of lactate. Therefore, GLUT1 appears to be particularly important for glycolysis in the ES cells, as it is in multiple other cell types.
The second method that exposed the GLUT1-deficient phenotype in the GLUT1-targeted ES cells was exposure to hypoxia. This stress has previously been described to stimulate both GLUT1 and GLUT3 transcription in other cell types. 46,49,63-65 The mechanism is believed to involve hypoxic induction of the HIF-1α transcription factor that activates these genes. 62,66 Hypoxia also secondarily inhibits oxidative phosphorylation, which is a known stimulus for GLUT1 but not GLUT3 expression in other cell types. 11,12,47,51,52 GLUT1 was the first gene described to have dual regulation of its expression by hypoxia, both through the HIF-1α pathway and through inhibition of oxidative phosphorylation. 64 The current studies indicate a significant and progressive increase of apoptosis in heterozygous GLUT1-targeted ES cells with exposure to hypoxia, whereas control ES cells demonstrated no significant increase in apoptosis with up to 4 hours of hypoxia. The GLUT1-targeted cells also exhibited higher caspase-3 activity compared with nontargeted cells, when both cell types were exposed to hypoxia. In addition, the heterozygous GLUT1-targeted ES cells with partial compensation from GLUT1 itself demonstrated no significant increase of apoptosis in the nonhypoxic condition, although there was a trend for increased caspase-3 activity. The increased susceptibility ofGLUT1-targeted ES cells to hypoxia may have been because of, at least in part, their impaired capacity to increase GLUT1 protein to supply anaerobic (lactate-producing) glycolysis, as shown in the experiments with sodium azide.
Previous studies in GLUT1-deficient embryos 67 and in GLUT1-deficient cultured hematopoietic cells 20,68 demonstrated that apoptosis was increased, suggesting GLUT1 was protecting them from programmed cell death. GLUT1 deficiency was linked to the development of apoptosis in blastocyst embryos despite the fact that they express additional GLUT isoforms, including GLUT3, GLUT8, and GLUT2. 67,69 This may reflect in part, the finding that GLUT1 is the major glucose transporter in the inner cell mass (ES cells) of the preimplantation embryo. 56 The stress of hypoxia has previously been studied in nonembryonic cells, 33,46,49,63,64,70 where it led to increases of GLUT1 expression that may have been protective. Without this GLUT1 response the cells may have been more susceptible to develop apoptosis. 20,33 Increased GLUT1 expression presumably would allow hypoxic cells to increase their rate of anaerobic glycolysis for ATP production. Therefore, the current results in hypoxic, GLUT1-deficient ES cells are consistent with previous literature reports indicating that GLUT1 deficiency predisposes to apoptosis.
As noted above, studies in murine embryos have demonstrated that GLUT1 is the major glucose transporter in the inner cell mass (ICM) that contains the ES cells. 56 It is also expressed in the basolateral membranes of blastocyst trophectoderm cells, and may participate with GLUT3 in the uptake of maternal glucose into the preimplanation embryo. 56 GLUT1 is now known to be expressed throughout preimplantation embryonic development from the oocyte through the blastocyst stage. 7-9,56 In contrast, other embryonic glucose transporters first appear at later stages than GLUT1. GLUT3, another high-affinity glucose transporter, is detectable as early as the late four-cell stage, 56 whereas GLUT2, a lower affinity glucose transporter, is first detected at the eight-cell stage. GLUT8, a recently identified embryonic glucose transporter becomes detectable at the blastocyst stage when the trophectoderm (first epithelial layer) develops. 39
GLUT3 is expressed predominantly in the apical membrane of trophectoderm cells, and in this position this high-affinity glucose transporter is proposed to mediate the uptake of maternal glucose into the preimplantation embryo. 56,57 GLUT2 expression in the blastocyst is restricted to the basal plasma membrane of trophectoderm cells, but this low-affinity glucose transporter is thought not to play a significant role in the uptake of glucose from the oviductal or uterine fluid. 9,39 GLUT8 is located in trophectoderm cells, and in primitive endoderm cells surrounding the blastocoel. 39 GLUT8 has an intracellular location until stimulated by insulin to translocate to the plasma membrane. 39 The present report is the first identifying GLUT8 expression in ES cells.
The simultaneous expression of GLUT1, GLUT2, GLUT3, and GLUT8 at the blastocyst stage has been proposed to occur because of a switch from oxidative phosphorylation to anaerobic glycolysis at this stage. With this switch in metabolism, the preferred substrates for the embryo change from pyruvate and lactate to glucose, and an accompanying need for increased glucose transport is evident. 71 This switch to anaerobic glycolysis for ATP production in the blastocyst may be necessary preparation for the low-oxygen environment the blastocyst will encounter at the uterine implantation site. 71
In summary, the current report demonstrates that GLUT1-haploinsufficiency in ES cells induces a protective, GLUT1 compensatory response that primarily preserves their capacity for glucose uptake, growth, and glycolysis in the nonstressed condition. In contrast, their capacity to compensate is insufficient to protect them from the stress of hypoxia, as indicated by their increased frequency of apoptosis in this condition.
Acknowledgments
We thank Dr. Maureen Charron and Dr. Kelle Moley for their helpful advice, and Uri Avissar and Mohammed Miri for technical assistance.
Footnotes
Address reprint requests to Dr. Charles W. Heilig, Division of Nephrology, Johns Hopkins University School of Medicine, 720 Rutland Ave., Ross 947, Baltimore, MD. 21205. E-mail: cheilig@jhmi.edu.
Supported by the National Institutes of Health (RO1 DK54507 to C. H.); the American Diabetes Association (research award 2002-2005 to C. H.); the American Heart Association (research award 2002-2004 to C. H.); the National Kidney Foundation of Upstate New York (research award to C. H.); a University of Rochester Buswell award (to C. H.); the Fund of Henry Ford Hospital Award (to C. H.); the Howard Hughes Research Center, Department of Genetics, Harvard Medical School (C.H., D.C.); the Baxter Healthcare Corporation (research award to F. B.), and the National Kidney Foundation of Michigan (research award to F. B.).
References
- 1.Fukumoto H, Seino S, Hiro I, Seino Y, Bell G: Characterization and expression of human HepG2 /erythrocyte glucose transporter gene. Diabetes 1988, 37:657-661 [DOI] [PubMed] [Google Scholar]
- 2.Joost HG, Bell GI, Best JD, Birnbaum M, Charron M, Chen Y, Doege H, James D, Lodish H, Moley K, Moley J, Mueckler M, Rogers S, Schurmann A, Seino S, Thorens B: Nomenclature of the GLUT/SLC2A family of sugar/polyol transport facilitators. Am J Physiol 2002, 282:E974-E976 [DOI] [PubMed] [Google Scholar]
- 3.Bell GI, Burant CF, Takeda J, Gould GW: Structure and function of mammalian facilitative sugar transporters. J Biol Chem 1993, 268:19161-19164 [PubMed] [Google Scholar]
- 4.Devaskar S, Mueckler M: The mammalian glucose transporters. Pediatr Res 1992, 31:1-13 [DOI] [PubMed] [Google Scholar]
- 5.Gould GW, Holman GD: The glucose transporter family: structure, function and tissue-specific expression. Biochem J 1993, 295:329-341 [DOI] [PMC free article] [PubMed] [Google Scholar]
- 6.Thorens B, Charron MJ, Lodish HF: Molecular physiology of glucose transporters. Diabetes Care 1990, 13:209-218 [DOI] [PubMed] [Google Scholar]
- 7.Morita Y, Tsutsumi O, Oka Y, Taketani Y: Glucose transporter GLUT1 mRNA expression in the ontogeny of glucose incorporation in mouse preimplantation embryos. Biochem Biophys Res Commun 1994, 199:1525-1531 [DOI] [PubMed] [Google Scholar]
- 8.Hogan A, Heyner S, Charron MJ, Copeland N, Gilbert D, Jenkins N, Thorens B, Schultz G: Glucose transporter gene expression in early mouse embryos. Development 1991, 113:363-372 [DOI] [PubMed] [Google Scholar]
- 9.Aghayan M, Rao LV, Smith RM, Jarett L, Charron M, Thorens B, Heyner S: Developmental expression and cellular localization of glucose transporter molecules during mouse preimplantation development. Development 1992, 115:305-312 [DOI] [PubMed] [Google Scholar]
- 10.Bashan N, Burdett E, Hundal H, Klip A: Regulation of glucose transport and GLUT1 glucose transporter expression by O2 in muscle cells in culture. Am J Physiol 1992, 262:C682-C690 [DOI] [PubMed] [Google Scholar]
- 11.Shetty M, Ismail-Beigi N, Loeb JN, Ismail-Beigi F: Induction of GLUT1 mRNA in response to inhibition of oxidative phosphorylation. Am J Physiol 1993, 265:C1224-C1229 [DOI] [PubMed] [Google Scholar]
- 12.Shetty M, Loeb JN, Vikstrom K, Ismail-Beigi F: Rapid activation of GLUT-1 glucose transporter following inhibition of oxidative phosphorylation in clone 9 cells. J Biol Chem 1993, 268:17225-17232 [PubMed] [Google Scholar]
- 13.Shetty M, Loeb JN, Ismail-Beigi F: Enhancement of glucose transport in response to inhibition of oxidative metabolism: pre- and posttranslational mechanisms. Am J Physiol 1992, 262:C527-C532 [DOI] [PubMed] [Google Scholar]
- 14.Heilig C, Zaloga C, Lee M, Zhao X, Riser B, Cortes P: Immunogold localization of high affinity GLUT isoforms in normal rat kidney. Lab Invest 1995, 73:674-684 [PubMed] [Google Scholar]
- 15.Kayano T, Fukumoto H, Eddy RL, Fan Y, Byers M, Shows T, Bell G: Evidence for a family of human glucose transporter-like proteins. Sequence and gene localization of a protein expressed in fetal skeletal muscle and other tissues. J Biol Chem 1988, 263:15245-15248 [PubMed] [Google Scholar]
- 16.Chih CP, Lipton P, Roberts EL, Jr: Do active cerebral neurons really use lactate rather than glucose? Trends Neurosci 2001, 24:573-578 [DOI] [PubMed] [Google Scholar]
- 17.Boden G, Murer E, Mozzoli M: Glucose transporter proteins in human insulinoma. Ann Intern Med 1994, 121:109-112 [DOI] [PubMed] [Google Scholar]
- 18.Flier JS, Mueckler MM, Usher P, Lodish HF: Elevated levels of glucose transport and transporter messenger RNA are induced by ras or src oncogenes. Science 1987, 235:1492-1495 [DOI] [PubMed] [Google Scholar]
- 19.Kahn B: Facilitative glucose transporters: regulatory mechanisms and dysregulation by diabetes. J Clin Invest 1992, 13:548-564 [DOI] [PMC free article] [PubMed] [Google Scholar]
- 20.Vander Heiden MG, Plas DR, Rathmell JC, Fox CJ, Harris MH, Thompson CB: Growth factors can influence cell growth and survival through effects on glucose metabolism. Mol Cell Biol 2001, 21:5899-5912 [DOI] [PMC free article] [PubMed] [Google Scholar]
- 21.Greene D, Lattimer S: Altered sorbitol and myo-inositol metabolism as the basis for defective protein kinase C and sodium-potassium ATPase regulation in diabetic neuropathy. Ann NY Acad Sci 1986, :334-340 [DOI] [PubMed] [Google Scholar]
- 22.Klepper J, Wang D, Fischbarg J, Vera J, Jarjour I, O’Driscoll K, De Vivo D: Defective glucose transport across brain tissue barriers: a newly recognized neurological syndrome. Neurochem Res 1999, 24:587-594 [DOI] [PubMed] [Google Scholar]
- 23.Seidner G, Alvarez MG, Yeh JI, O’Driscoll K, Klepper J, Stump T, Wang D, Spinner N, Birnbaum M, De Vivo D: GLUT-1 deficiency syndrome caused by haploinsufficiency of the blood-brain barrier hexose carrier. Nat Genet 1998, 18:188-191 [DOI] [PubMed] [Google Scholar]
- 24.Klepper J, Voit T: Facilitated glucose transporter protein type 1 (GLUT1) deficiency syndrome: impaired glucose transport into brain—a review. Eur J Pediatr 2002, 161:295-304 [DOI] [PubMed] [Google Scholar]
- 25.Wang D, Kranz-Eble P, De Vivo DC: Mutational analysis of GLUT1 (SLC2A1) in Glut-1 deficiency syndrome. Hum Mutat 2000, 16:224-231 [DOI] [PubMed] [Google Scholar]
- 26.De Vivo DC, Trifiletti RR, Jacobson RI, Ronen GM, Behmand RA, Harik SI: Defective glucose transport across the blood-brain barrier as a cause of persistent hypoglycorrhachia, seizures, and developmental delay. N Engl J Med 1991, 325:703-709 [DOI] [PubMed] [Google Scholar]
- 27.Thomas KR, Capecchi MR: Site-directed mutagenesis by gene targeting in mouse embryo-derived stem cells. Cell 1987, 51:503-512 [DOI] [PubMed] [Google Scholar]
- 28.Ausebel F, Brent R, Kingston R, Moore D, Sedman J, Smith J, Struhl K: Current Protocols in Molecular Biology. 1994. John Wiley & Sons, New York
- 29.Lowry O, Rosebrough N, Farr A, Randall R: Protein measurement with the folin phenol reagent. J Biol Chem 1951, 193:265-275 [PubMed] [Google Scholar]
- 30.Reagan LP, Gorovits N, Hoskin EK, Alves S, Katz E, Grillo C, Piroli G: Localization and regulation of GLUTx1 glucose transporter in the hippocampus of streptozotocin diabetic rats. Proc Natl Acad Sci USA 2001, 98:2820-2825 [DOI] [PMC free article] [PubMed] [Google Scholar]
- 31.Karnieli E, Garvey WT, Olefsky JM, Hueckstead T, Harel C, Maianu L, Armoni M: Potential role for insulin and cycloheximide in regulating the intrinsic activity of glucose transporters in isolated rat adipocytes. Endocrinology 1993, 133:2943-2950 [DOI] [PubMed] [Google Scholar]
- 32.Haneda M, Kikkawa R, Togawa M, Koya D, Kajiwara N, Shigeta Y: Metabolic actions of insulin-like growth factor-1 in cultured glomerular mesangial cells. Metabolism 1991, 40:1311-1316 [DOI] [PubMed] [Google Scholar]
- 33.Malhotra R, Brosius FC: Glucose uptake and glycolysis reduce hypoxia-induced apoptosis in cultured neonatal rat cardiac myocytes. J Biol Chem 1999, 274:12567-12575 [DOI] [PubMed] [Google Scholar]
- 34.Welham SJ, Wade A, Woolf AS: Protein restriction in pregnancy is associated with increased apoptosis of mesenchymal cells at the start of rat metanephrogenesis. Kidney Int 2002, 61:1231-1242 [DOI] [PubMed] [Google Scholar]
- 35.Zou H, Henzel WJ, Liu X, Lutschg A, Wang X: Apaf-1, a human protein homologous to C. elegans CED-4, participates in cytochrome c-dependent activation of caspase-3. Cell 1997, 90:405-413 [DOI] [PubMed] [Google Scholar]
- 36.Bradley A, Evans M, Kaufman MH, Robertson E: Formation of germ-line chimaeras from embryo-derived teratocarcinoma cell lines. Nature 1984, 309:255-256 [DOI] [PubMed] [Google Scholar]
- 37.Mortensen RM, Conner DA, Chao S, Geisterfer-Lowrance AA, Seidman JG: Production of homozygous mutant ES cells with a single targeting construct. Mol Cell Biol 1992, 12:2391-2395 [DOI] [PMC free article] [PubMed] [Google Scholar]
- 38.Yano H, Seino Y, Inagaki N, Hinokio Y, Yamamoto T, Yasuda K, Masuda K: Tissue distribution and species difference of the brain type glucose transporter (GLUT3). Biochem Biophys Res Commun 1991, 174:470-477 [DOI] [PubMed] [Google Scholar]
- 39.Carayannopoulos MO, Chi MM, Cui Y, Pingsterhaus J, McKnight R, Mueckler M, Devaskar S: GLUT8 is a glucose transporter responsible for insulin-stimulated glucose uptake in the blastocyst. Proc Natl Acad Sci USA 2000, 97:7313-7318 [DOI] [PMC free article] [PubMed] [Google Scholar]
- 40.Kumagai AK, Dwyer KJ, Pardridge WM: Differential glycosylation of the GLUT1 glucose transporter in brain capillaries and choroid plexus. Biochim Biophys Acta 1994, 1193:24-30 [DOI] [PubMed] [Google Scholar]
- 41.Shepherd PR, Gould GW, Colville CA, McCoid SC, Gibbs EM, Kahn BB: Distribution of GLUT3 glucose transporter protein in human tissues. Biochem Biophys Res Commun 1992, 188:149-154 [DOI] [PubMed] [Google Scholar]
- 42.Pinto AB, Carayannopoulos MO, Hoehn A, Dowd L, Moley KH: Glucose transporter 8 expression and translocation are critical for murine blastocyst survival. Biol Reprod 2002, 66:1729-1733 [DOI] [PubMed] [Google Scholar]
- 43.Rogers S, Macheda M, Docherty S, Carty M, Henderson M, Soeller W, Gibbs E: Identification of a novel glucose transporter-like protein-GLUT-12. Am J Physiol 2002, 282:E733-E738 [DOI] [PubMed] [Google Scholar]
- 44.Chi MM, Pingsterhaus J, Carayannopoulos M, Moley KH: Decreased glucose transporter expression triggers BAX-dependent apoptosis in the murine blastocyst. J Biol Chem 2000, 275:40252-40257 [DOI] [PubMed] [Google Scholar]
- 45.Simpson IA, Appel NM, Hokari M, Oki J, Holman G, Maher F, Koehler-Stec E, Vannucci S, Smith Q: Blood-brain barrier glucose transporter: effects of hypo- and hyperglycemia revisited. J Neurochem 1999, 72:238-247 [DOI] [PubMed] [Google Scholar]
- 46.Vannucci SJ, Seaman LB, Vannucci RC: Effects of hypoxia-ischemia on GLUT1 and GLUT3 glucose transporters in immature rat brain. J Cerebral Blood Flow Metab 1996, 16:77-81 [DOI] [PubMed] [Google Scholar]
- 47.Hamrahian AH, Zhang JZ, Elkhairi FS, Prasad R, Ismail-Beigi F: Activation of Glut1 glucose transporter in response to inhibition of oxidative phosphorylation. Arch Biochem Biophys 1999, 368:375-379 [DOI] [PubMed] [Google Scholar]
- 48.Bruckner BA, Ammini CV, Otal MP, Raizada MK, Stacpoole PW: Regulation of brain glucose transporters by glucose and oxygen deprivation. Metabolism 1999, 48:422-431 [DOI] [PubMed] [Google Scholar]
- 49.Takagi H, King GL, Aiello LP: Hypoxia upregulates glucose transport activity through an adenosine-mediated increase of GLUT1 expression in retinal capillary endothelial cells. Diabetes 1998, 47:1480-1488 [DOI] [PubMed] [Google Scholar]
- 50.Vannucci SJ, Reinhart R, Maher F, Bondy C, Lee W, Vannucci R, Simpson I: Alterations in GLUT1 and GLUT3 glucose transporter gene expression following unilateral hypoxia-ischemia in the immature rat brain. Brain Res Dev Brain Res 1998, 107:255-264 [DOI] [PubMed] [Google Scholar]
- 51.Khayat ZA, McCall AL, Klip A: Unique mechanism of GLUT3 glucose transporter regulation by prolonged energy demand: increased protein half-life. Biochem J 1998, 333:713-718 [DOI] [PMC free article] [PubMed] [Google Scholar]
- 52.Taha C, Tsakiridis T, McCall A, Klip A: Glucose transporter expression in L6 muscle cells: regulation through insulin- and stress-activated pathways. Am J Physiol 1997, 273:E68-E76 [DOI] [PubMed] [Google Scholar]
- 53.Thorens B, Lodish HF, Brown D: Differential localization of two glucose transporter isoforms in rat kidney [corrected and republished with original paging, article originally printed in J Am Physiol 1990 Aug;259(2 Pt 1): C286–294]. Am J Physiol 1990, 259:C286-C294 [DOI] [PubMed] [Google Scholar]
- 54.Gerhart DZ, Leino RL, Taylor WE, Borson ND, Drewes LR: GLUT1 and GLUT3 gene expression in gerbil brain following brief ischemia: an in situ hybridization study. Brain Res Mol Brain Res 1994, 25:313-322 [DOI] [PubMed] [Google Scholar]
- 55.Hamlin GP, Cernak I, Wixey JA, Vink R: Increased expression of neuronal glucose transporter 3 but not glial glucose transporter 1 following severe diffuse traumatic brain injury in rats. J Neurotrauma 2001, 18:1011-1018 [DOI] [PubMed] [Google Scholar]
- 56.Pantaleon M, Harvey MB, Pascoe WS, James DE, Kaye PL: Glucose transporter GLUT3: ontogeny, targeting, and role in the mouse blastocyst. Proc Natl Acad Sci USA 1997, 94:3795-3800 [DOI] [PMC free article] [PubMed] [Google Scholar]
- 57.Pantaleon M, Kaye PL: Glucose transporters in preimplantation development. Rev Reprod 1998, 3:77-81 [DOI] [PubMed] [Google Scholar]
- 58.Maher F, Davies-Hill TM, Simpson IA: Substrate specificity and kinetic parameters of GLUT3 in rat cerebellar granule neurons. Biochem J 1996, 315:827-831 [DOI] [PMC free article] [PubMed] [Google Scholar]
- 59.Vannucci SJ, Maher F, Simpson IA: Glucose transporter proteins in brain: delivery of glucose to neurons and glia. Glia 1997, 21:2-21 [DOI] [PubMed] [Google Scholar]
- 60.Edirisinghe WR, Wales RG: Influence of environmental factors on the metabolism of glucose by preimplantation mouse embryos in vitro. Aust J Biol Sci 1985, 38:411-420 [DOI] [PubMed] [Google Scholar]
- 61.Macheda ML, Kelly DJ, Best JD, Rogers S: Expression during rat fetal development of GLUT12—a member of the class III hexose transporter family. Anat Embryol (Berl) 2002, 205:441-452 [DOI] [PubMed] [Google Scholar]
- 62.Iyer N, Kotch L, Agani F, Leung S, Laughner E, Wenger R, Gassmann M, Gearhart J, Lawler A, Yu A, Semenza G: Cellular and developmental control of O2 homeostasis by hypoxia-inducible factor 1 alpha. Genes Dev 1998, 12:149-162 [DOI] [PMC free article] [PubMed] [Google Scholar]
- 63.Loike JD, Cao L, Brett J, Ogawa S, Silverstein SC, Stern D: Hypoxia induces glucose transporter expression in endothelial cells. Am J Physiol 1992, 263:C326-C333 [DOI] [PubMed] [Google Scholar]
- 64.Zhang JZ, Behrooz A, Ismail-Beigi F: Regulation of glucose transport by hypoxia. Am J Kidney Dis 1999, 34:189-202 [DOI] [PubMed] [Google Scholar]
- 65.Royer C, Lachuer J, Crouzoulon G, Roux J, Peyronnet J, Mamet J, Pequignot J, Dalmaz Y: Effects of gestational hypoxia on mRNA levels of Glut3 and Glut4 transporters, hypoxia inducible factor-1 and thyroid hormone receptors in developing rat brain. Brain Res 2000, 856:119-128 [DOI] [PubMed] [Google Scholar]
- 66.Behrooz A, Ismail-Beigi F: Stimulation of glucose transport by hypoxia: signals and mechanisms. News Physiol Sci 1999, 14:105-110 [DOI] [PubMed] [Google Scholar]
- 67.Chi MM, Pingsterhaus J, Carayannopoulos M, Moley KH: Decreased glucose transporter expression triggers BAX-dependent apoptosis in the murine blastocyst. J Biol Chem 2000, 275:40252-40257 [DOI] [PubMed] [Google Scholar]
- 68.Moley KH, Mueckler MM: Glucose transport and apoptosis. Apoptosis 2000, 5:99-105 [DOI] [PubMed] [Google Scholar]
- 69.Moley KH, Chi MM, Mueckler MM: Maternal hyperglycemia alters glucose transport and utilization in mouse preimplantation embryos. Am J Physiol 1998, 275:E38-E47 [DOI] [PubMed] [Google Scholar]
- 70.Vannucci SJ, Seaman LB, Vannucci RC: Effects of hypoxia-ischemia on GLUT1 and GLUT3 glucose transporters in immature rat brain. J Cereb Blood Flow Metab 1996, 16:77-81 [DOI] [PubMed] [Google Scholar]
- 71.Chi MM, Hoehn A, Moley KH: Metabolic changes in the glucose-induced apoptotic blastocyst suggest alterations in mitochondrial physiology. Am J Physiol 2002, 283:E226-E232 [DOI] [PubMed] [Google Scholar]