

Abstract
Telomere length analysis has aroused considerable interest in biology and oncology. However, most published data are pan-genomic Southern-blot-based estimates. We developed T/C-FISH (telomere/centromere-FISH), allowing precise measurement of individual telomeres at every single chromosome arm. Metaphase preparations are co-hybridized with peptide nucleic acid probes for telomeric sequences and the chromosome 2 centromere serving as internal reference. Metaphase images are captured and karyotyped using dedicated software. A software module determines the absolute integrated fluorescence intensities of the p- and q-telomeres of each chromosome and the reference signal. Normalized data are derived by calculating the ratio of absolute telomere and reference signal intensities, and descriptive statistics are calculated. T/C-FISH detects even small differences in telomere length. Using T/C-FISH we have discovered an epigenetic process occurring in the human male postzygote or early embryo: in umbilical cord blood lymphocytes, telomeres on male Xqs are around 1100 bp shorter than female Xqs.
Telomeres are the physical ends of chromosomes composed of repetitive hexanucleotide DNA sequences (TTAGGG in all vertebrates) and associated proteins. 1-3 During gametogenesis, reprogramming of the germ cells leads to elongation of telomeres up to their species-specific maximum. 4,5 Henceforward, telomeres of somatic cells are shortened during each division. 6 It is a common belief that cells enter senescence once a critical minimal telomere length has been attained. In vivo, this alleged critical length has not yet been precisely determined. 7
Recent studies in mammalian cells suggest interchromosomal heterogeneity in telomere lengths 8-14 and review. 15 Furthermore, critically short telomeres on different chromosomes may be specifically involved in various types of chromosomal aberrations. 16 To be able to address these and related questions, quantification of chromosome-specific telomere length is essential. Here we describe a method, T/C-FISH (telomere/centromere-FISH), which allows precise measurement of individual telomeres at every single chromosome arm and which is faster and more reliable than any other comparable method. 14
Materials and Methods
Cell Culture
Altogether 70 (5 male and 5 female per decade) peripheral blood samples were collected from donors who ranged from newborn to 70 years of age. In addition, umbilical cord blood samples from 55 male and 53 female newborns were used. Heparinized blood was cultured in RPMI with 20% fetal calf serum (FCS), glutamine, penicillin/streptomycin and phytohemagglutinine in the usual manner. Twenty metaphases from each individual were examined. All cell culture reagents were obtained from Biochrom/Seromed (Berlin, Germany). Human embryonic kidney cells (HEK293) were grown in RPMI supplemented with 10% FCS, glutamine, and antibiotics as mentioned above.
PNA Probes
The peptide nucleic acid (PNA) probe for telomeric sequences is a ready-to-use probe included in the Telomere PNA FISH Kit/Cy3 (K5326 from DAKO, Glostrup, Denmark). The PNA centromeric probe for chromosome 2 was generated by DAKO and is commercially available on request. The PNA probe for the centromere 2 was added as 1 μl to 10 μl ready-to-use telomere probe solution resulting in a final concentration of 2 ng/μl. The hybridization buffer contained 70% formamide.
Fluorescence in Situ Hybridization (FISH)
Chromosome preparations of lymphocytes were made using standard procedures. The hybridization was performed according to the manufacturer’s instructions. In brief, this procedure includes the following steps: slides were washed twice with TBS buffer (Tris-buffered saline, pH 7.5), treated with proteinase K for 10 minutes at room temperature, fixed in ethanol and air-dried. PNA probes were denaturated together with the slide at 80°C for 3 minutes and hybridized for 30 to 60 minutes at room temperature. After extensive washing, first at 65°C and then at room temperature, the slides were mounted with antifade solution (Vector Laboratories, Burlingame, CA).
Southern Blot Analysis
Corresponding DNA samples were prepared using a DNA extraction kit (Stratagene, La Jolla, CA). DNA was digested with HinfI restriction enzyme, electrophoretically resolved and transferred to a nylon membrane. After incubation with a telomere-specific, 32P-labeled (C3TA2)3 DNA probe, the DNA was exposed to X-ray film and analyzed using Aida software (Raytest, Straubenhardt, Germany). Telomere peak values were measured by radiodensitometry, estimating the band-size corresponding to the point with the highest optical density within the peak.
Quantitative Image Analysis on T/C-FISH
Metaphases are captured with a fluorescence microscope (Axioscope 2; Zeiss, Jena, Germany) with individual excitation filter sets for DAPI and Cy3, equipped with a CCD-camera (resolution 752 × 576 pixels, 11-μm pixel size, on-chip integration) and linked to the ISIS software (MetaSystems, Altlussheim, Germany). The exposure time is automatically controlled by the software for each individual image and each of the captured color channels (fluorochromes) to ensure maximum quality (dynamic range) at the first shot. To allow quantitative comparisons of absolute fluorescence intensities between different images, the integration times used for the individual color channels are automatically saved with each image.
The chromosomes are then segmented by automatic thresholding of the DAPI image. The intensity threshold is derived from the histogram of the DAPI channel, which exhibits a large background peak and a broader distribution of the pixels at higher intensity corresponding to the chromosomes and cell nuclei. The threshold intensity is determined by the point of the histogram curve having the maximum orthogonal distance to the straight line connecting the background peak and the maximum intensity point of the histogram. If desired, the automatic threshold can be interactively corrected.
Following the segmentation step, non-chromosome objects are deleted from the metaphase image. Touching and overlapping chromosomes need to be separated by means of interactive separation and dislapping functions. Once separated, the chromosomes are transferred to the karyotype window. To avoid losing parts of the telomere signals, the DAPI mask is automatically dilated by a definable number of pixels and applied to the Cy3 channel. Chromosome classification is performed using an automatic DAPI banding classifier followed by interactive corrections where necessary. Automatic banding enhancement functions, including digital filtering and contrast optimizing, facilitate chromosome identification.
The telomere measurement algorithm displays two horizontal lines overlaid to each chromosome in the karyogram, which define the telomere measurement areas (for p- and q-arms) of each chromosome (Figure 1) ▶ . The measurement area of the reference probe is equally displayed as two horizontal lines on the respective chromosome. For the initial line positions, the software uses default parameters. Again, interactive corrections of the line positions defining the measurement areas can be performed if necessary. Within the measurement area the integrated fluorescence intensity in the Cy3 channel is measured. Background correction is performed by subtracting the mean background level of the Cy3 image from each pixel within the measuring area. The mean background level corresponds to the most frequent intensity level (ie, the maximum of the Cy3 intensity histogram of all pixels within the extended chromosome mask). The integrated fluorescence intensity of the reference signal is calculated in the same way. The absolute integrated fluorescence intensities of the p- and q-telomeres of each chromosome and the integrated fluorescence intensity of the reference signal are stored as raw data. Normalized data are derived by calculating the ratio of the absolute telomere intensities and the absolute reference signal intensities. As the analysis is repeated for additional metaphases, the telomere data are appended to the result file and statistical parameters are automatically calculated and displayed: mean telomere intensity of the p- and q-arms of each chromosome, standard deviations, median and the interquartile range representing the range between the first and the third quartile of measured intensities. Mean telomere intensities are displayed as telomere length histograms.
Figure 1.

Karyogram with thresholds. Chromosomes are stained with DAPI. Red thresholds enclose the reference signal on chromosome 2, green thresholds mark the limits of upper and lower borderline of the telomere signals on the chromosomes.
Results
Pangenomic T/C-FISH Values Strictly Correlate with TRFs
T/C-FISH is performed by measuring the total fluorescence intensity of the signals of telomeres and the centromere of chromosome 2. This integrated fluorescence intensity is proportional to telomeric and centromeric length. Pangenomically compiled T/C-FISH data and classical telomere restriction fragment (TRF) of different individuals by Southern blot are in a tight linear relationship (r2 = 0.83). Thus T/C ratios can be quite precisely expressed in terms of bp and compared interindividually. We therefore concluded that the centromere 2 DNA sequence which the probe recognizes is of sufficiently stable length to be used as a reference for interindividual telomere length analysis using T/C-FISH. To draw conclusions from T/C-FISH values to TRFs, we examined telomere intensities of chromosome preparations in peripheral blood lymphocytes (PBLs) and TRFs from 56 persons (30 male, 26 female) between 0 and 60 years of age. Twenty metaphases from each individual were examined and the median of the T/C-FISH value was calculated. The mean coefficient of variation was 0.18, which we consider satisfactory. To determine TRF values from T/C-FISH data, simple regression analysis (y = c + m × x) of medians was applied. In this formula, y are bp, c is y-intercept, m represents slope, and x is the T/C-value (Figure 2) ▶ . As demonstrated in Figure 2 ▶ , a tight linear relationship (goodness of fit: r2 = 0.83) exists between the two techniques: the equation of the computed regression line is: y = 2507 + 204 × x, the correlation coefficient between T/C-FISH and TRF is r = √0.83 = 0.91. The point of intersection with the y axis is at 2.5 kb.
Figure 2.

Regression analysis of PBLs of 56 persons aged 0 to 60 years. Each square represents the median derived from 20 metaphases of one individual. To correlate T/C-FISH values with TRF data, simple regression analysis (y = c + m × x) of medians was applied. y = bp, c = y-intercept, m = slope, x = T/C value. The equation of the computed regression line is: y = 2507 + 204 × x with a correlation coefficient of r2 = 0.83.
Testing T/C-FISH Data for Precision and Accuracy
The difference in T/C-values of homologous chromosomes in one paradigmatic metaphase in umbilical cord lymphocytes is in median 7.9 with SD of 12.9. The difference in T/C values of sister chromatids in the same metaphase is in median 3.5 with SD of 2.5. In Figure 3A ▶ the corresponding box and whisker plots are shown with minimum, 25th percentile, 50th percentile (median), 75th percentile, and maximum. Thus, T/C-FISH values showed little variance for homologous chromosomes and even less for sister chromatids.
Figure 3.
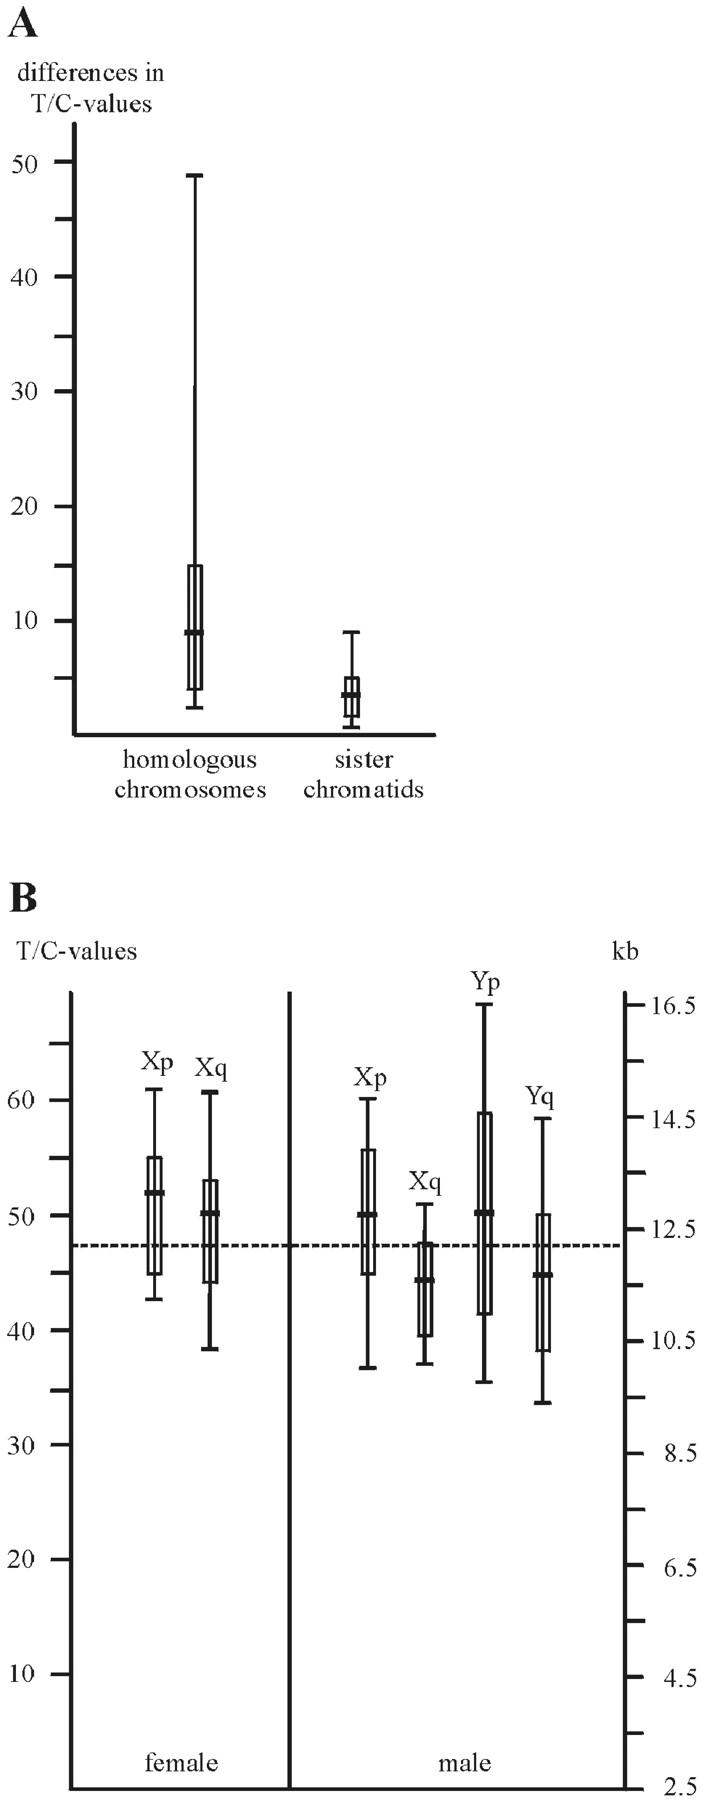
Box plots of T/C-values of the differences of homologous chromosomes and sister chromatids of one exemplary metaphase. The dashed line is the median difference of homologous chromosomes and their sister chromatids, respectively. Box plots with minimum, 25th percentile, 50th percentile (median), 75th percentile, and maximum. B: Box plots of median T/C values of sex chromosomes of altogether 108 newborns. Male Xqs have shorter telomeres (P = 0.0004) in Wilcoxon test. Dashed line: median T/C value of all autosomes. Exemplary for all chromosome arms, the box plots of the telomere length of these sex chromosome arms are included. Box plots with minimum, 25th percentile, 50th percentile (median), 75th percentile, and maximum.
Next we performed a cell culture experiment with clonal human embryonic kidney cells (HEK293) to test the sensitivity of our instrument in detecting telomere erosion in long-term cultures. As shown in Table 1 ▶ , HEK293 cells featured some degree of interchromosomal variation in telomere lengths. HEK293 cells lost about 1.8 kb telomeric DNA per passage. In this experimental setting HEK293 cells had a doubling time of 8 hours. This means that HEK293 cells lost around 600 bp per single telomere per cycle.
Table 1.
T/C-FISH Data on Telomere Lengths of HEK293 in Subsequent Passages
| Passage No. | Median of whole chromosomes (± SD) | Median of p-arms (± SD) | Median of q-arms (± SD) |
|---|---|---|---|
| 2 | 111.2 (± 18.4) | 112.2 (± 16.4) | 106.9 (± 20.4) |
| 5 | 85.8 (± 17.7) | 88.1 (± 16.7) | 84.8 (± 18.8) |
| 7 | 59.4 (± 10.3) | 57.7 (± 10.7) | 60.4 (± 9.9) |
Xq Telomeres are Shorter in Newborn Boys than in Girls
To investigate the telomere length of each individual chromosome arm, we compared the T/C-FISH values of autosomes and sex chromosomes from PBLs from 55 male and 53 female newborns. Twenty metaphases were investigated per newborn (a total of 2160 metaphases) and the median of the T/C-FISH values per individual was determined. We found no differences between males and females in the telomere lengths of homologue autosomes, regardless of whether we compared whole chromosomes or only chromosome arms. Within the sex chromosomes, we detected no statistically significant differences in the p-arms of X and Y, but striking and consistent differences in the q-arms: in male newborns the median T/C value of Xq telomeres was 45 compared to 50 in female counterparts (Figure 3B) ▶ . Converted to bp, this means that, on average, male Xq-telomeres were 1100 bp shorter than female Xq-telomeres. This difference was statistically significant using the two-sample Wilcoxon test (P = 0.0004). As altogether 48 statistical tests were carried out, the P value after Bonferroni-adjustment is 0.0004 × 48 = 0.019, which is still significant on the 5% significance level. In Figure 3B ▶ the corresponding box and whisker plots are shown with minimum, 25th percentile, 50th percentile (median), 75th percentile, and maximum. Thus, by T/C-FISH, we were able to detect the first evidence of an as yet undefined in vivo process leading to shortening of chromosome-specific telomeres.
17p Telomeres are Not Particularly Shortened with Age
Having shown that our method is reliably able to detect even small differences in telomere lengths, we set out to reproduce results published by Martens et al 12 who also applied individual telomere length measurements. These authors applied a different software, and did not use an internal standard. This investigation led to data suggesting that, with age, 17p telomeres are shortened to a larger extent than those of all other chromosome ends. 12 We analyzed peripheral blood lymphocytes of cohorts of 10 persons per decade, starting with cord blood lymphocytes up to the seventh decade. As shown in Figure 4 ▶ , there is a steady decline of the medians of pan-genomic telomere lengths (green color; equation of the trend line: y = 47.4 − 3.09 × x; r2 = 0.87), pan-genomic p-telomere lengths (red color; equation of the trend line: y = 47.1 − 3.14 × x; r2 = 0.89), and pan-genomic q-telomere lengths (blue color; equation of the trend line: y = 47.5 − 3.07 × x; r2 = 0.90). The shortening of 17p telomeres (plotted in yellow; equation of the trend line: y = 44.1 − 3.07 × x; r2 = 0.88) is perfectly in line with the above data. Actually, the 17p telomeres are among the shorter ones, although not the shortest (data not shown), and erosion occurs at the same rate, as shown by the trend lines. We thus conclude that, with age, all telomeres of the human genome are subjected to a process leading to a linear decline in length, starting with an overall telomere length of 12.2 kbp at the time of birth and ending up at an overall telomere length of 7.1 kbp at the age of 70.
Figure 4.

Box plots and trend lines of medians of pan-genomic telomeres (green color), pan-genomic p-telomeres (red color), pan-genomic q-telomeres (blue color) and 17p-telomeres (yellow color) from PBLs of newborns to 70-year-old individuals (5 males and 5 females per decade).
Discussion
Telomere length determines the proliferative capacity of mammalian cells. Until recently, telomere lengths were analyzed using the standard Southern blot technique. Considerable progress has been achieved with T/C-FISH, which is performed by measuring the Cy3-fluorescence intensity of every single telomere normalized to the Cy3-fluorescence intensity of the chromosome 2 centromere in metaphases serving as internal standard in each metaphase. This internal standard minimizes hybridization and preparation-dependent deviations. Telomeres and the centromere of chromosome 2 are co-hybridized with PNA probes in one step. This method can quantify chromosome-specific telomere lengths in all proliferating cell types, but not in non-dividing, resting cells.
In Figure 2 ▶ the regression line is shown. The goodness of fit (r2 = 0.83) demonstrates a tight linear relationship between the standard Southern blot technique and the T/C-FISH for telomere length quantification. With the equation of the regression line (y = 2507 + 204 × x), the T/C values can be expressed in terms of bp. The point of intersection with the y axis is at 2.5 kb and represents the mean length of the distance between the cut of the restriction enzyme HinfI within the subtelomeric region and the actual beginning of the telomeric sequences. This value is lower than described in other publications. 17-19 The slope of the line is 204 and is thus comparable with the results of other authors. 19 As described even earlier, telomere length can vary within a metaphase. 14 Even between homologous chromosomes 10,22 and sister chromatids 20 differences have been observed. In concordance with these publications we have demonstrated in preliminary statistical investigations that differences between homologous chromosomes and sister chromatids can occur in human lymphocytes. However, heterogeneity in sister chromatids is considerably less than in homologous chromosomes (Figure 3A) ▶ .
Comparing the telomere lengths of male and female newborns we found no differences between males and females in the telomere lengths of homolog autosomes. However, among the sex chromosomes, we detected statistically significant differences in the q-arms: male Xq-telomeres were 1100 bp shorter than female Xq-telomeres. Considering the fact that in the male zygote the X chromosome derives from the female germline, this phenomenon can probably be interpreted by an epigenetic event, eg, recombination between subtelomeres. 21 Strikingly, these male Xqs are the same size as Yq-telomeres. An alternative hypothesis could be a shortening due to intrachromatid telomere-repeat deletion (TRD), 22 a process first described as occurring in yeast. 23 By T/C-FISH we were able to detect the first evidence of an, as yet, undefined in vivo process leading to shortening of chromosome-specific telomeres.
In a methodologically comparable albeit much more extensive and T/C-FISH-based study, we attempted to reproduce Q-FISH-based results published by Martens et al. 12 Although we concur with the authors that 17p-telomeres are in median shorter than the median pan-genomic telomeres, in none of the cases we analyzed were 17p telomeres the shortest. Our data indicate that 17p-telomere shortening occurs at the same rate as the median pan-genomic average.
In critical conclusion, T/C-FISH is a new, very sensitive, and reliable method and hopefully will promote telomere research in the human system.
Acknowledgments
We thank Caroline Higginson for editorial work.
Footnotes
Address reprint requests to Peter Möller, M.D., Department of Pathology, University of Ulm, Allbert-Einstein-Allee 11, D-89081 Ulm, Germany. E-mail: peter.moeller@medizin.uni-ulm.de.
S. Perner and S. Brüderlein contributed equally to this work.
References
- 1.Saldanha SN, Andrews LG, Tollefsbol TO: Assessment of telomere length and factors that contribute to its stability. Eur J Biochem 2003, 270:389-403 [DOI] [PubMed] [Google Scholar]
- 2.Greider CW: Cellular responses to telomere shortening: cellular senescence as a tumor suppressor mechanism. Harvey Lect 2000, 96:33-50 [PubMed] [Google Scholar]
- 3.de Lange T: Protection of mammalian telomeres. Oncogene 2002, 21:532-540 [DOI] [PubMed] [Google Scholar]
- 4.Achi MV, Ravindranath N, Dym M: Telomere length in male germ cells is inversely correlated with telomerase activity. Biol Reprod 2000, 63:591-598 [DOI] [PubMed] [Google Scholar]
- 5.Rideout WM, III, Eggan K, Jaenisch R: Nuclear cloning and epigenetic reprogramming of the genome. Science 2001, 293:1093-1098 [DOI] [PubMed] [Google Scholar]
- 6.Kang MK, Swee J, Kim RH, Baluda MA, Park NH: The telomeric length and heterogeneity decrease with age in normal human oral keratinocytes. Mech Ageing Dev 2002, 123:585-592 [DOI] [PubMed] [Google Scholar]
- 7.Goyns MH, Lavery WL: Telomerase and mammalian ageing: a critical appraisal. Mech Ageing Dev 2000, 114:69-77 [DOI] [PubMed] [Google Scholar]
- 8.Hemann MT, Strong MA, Hao LY, Greider CW: The shortest telomere, not average telomere length, is critical for cell viability and chromosome stability. Cell 2001, 107:67-77 [DOI] [PubMed] [Google Scholar]
- 9.Zijlmans JM, Martens UM, Poon SS, Raap AK, Tanke HJ, Ward RK, Lansdorp PM: Telomeres in the mouse have large inter-chromosomal variations in the number of T2AG3 repeats. Proc Natl Acad Sci USA 1997, 94:7423-7428 [DOI] [PMC free article] [PubMed] [Google Scholar]
- 10.Londono-Vallejo JA, DerSarkissian H, Cazes L, Thomas G: Differences in telomere length between homologous chromosomes in humans. Nucleic Acids Res 2001, 29:3164-3171 [DOI] [PMC free article] [PubMed] [Google Scholar]
- 11.Hao YH, Tan Z: Telomeres at the chromosome X(p) might be critical in limiting the proliferative potential of human cells. Exp Gerontol 2001, 36:1639-1647 [DOI] [PubMed] [Google Scholar]
- 12.Martens UM, Zijlmans JM, Poon SS, Dragowska W, Yui J, Chavez EA, Ward RK, Lansdorp PM: Short telomeres on human chromosome 17p. Nat Genet 1998, 18:76-80 [DOI] [PubMed] [Google Scholar]
- 13.Surralles J, Hande MP, Marcos R, Lansdorp PM: Accelerated telomere shortening in the human inactive X chromosome. Am J Hum Genet 1999, 65:1617-1622 [DOI] [PMC free article] [PubMed] [Google Scholar]
- 14.Lansdorp PM, Verwoerd NP, van de Rijke FM, Dragowska V, Little MT, Dirks RW, Raap AK, Tanke HJ: Heterogeneity in telomere length of human chromosomes. Hum Mol Genet 1996, 5:685-691 [DOI] [PubMed] [Google Scholar]
- 15.Slijepcevic P: Telomere length regulation: a view from the individual chromosome perspective. Exp Cell Res 1998, 244:268-274 [DOI] [PubMed] [Google Scholar]
- 16.Deng W, Tsao SW, Guan XY, Lucas JN, Cheung AL: Role of short telomeres in inducing preferential chromosomal aberrations in human ovarian surface epithelial cells: a combined telomere quantitative fluorescence in situ hybridization and whole-chromosome painting study. Genes Chromosomes Cancer 2003, 37:92-97 [DOI] [PubMed] [Google Scholar]
- 17.Hultdin M, Rosenquist R, Thunberg U, Tobin G, Norrback KF, Johnson A, Sundstrom C, Roos G: Association between telomere length and V(H) gene mutation status in chronic lymphocytic leukaemia: clinical and biological implications. Br J Cancer 2003, 88:593-598 [DOI] [PMC free article] [PubMed] [Google Scholar]
- 18.Roos G, Hultdin M: Flow cytometric determination of telomere length. Cytometry 2001, 45:79-80 [DOI] [PubMed] [Google Scholar]
- 19.Law H, Lau Y: Validation and development of quantitative flow cytometry-based fluorescence in situ hybridization for intercenter comparison of telomere length measurement. Cytometry 2001, 43:150-153 [PubMed] [Google Scholar]
- 20.Bekaert S, Koll S, Thas O, Van Oostveldt P: Comparing telomere length of sister chromatids in human lymphocytes using three-dimensional confocal microscopy. Cytometry 2002, 48:34-44 [DOI] [PubMed] [Google Scholar]
- 21.Kass-Eisler A, Greider CW: Recombination in telomere-length maintenance. Trends Biochem Sci 2000, 25:200-204 [DOI] [PubMed] [Google Scholar]
- 22.Li B, Lustig AJ: A novel mechanism for telomere size control in Saccharomyces cerevisiae. Genes Dev 1996, 10:1310-1326 [DOI] [PubMed] [Google Scholar]
- 23.Murnane JP, Sabatier L, Marder BA, Morgan WF: Telomere dynamics in an immortal human cell line. EMBO J 1994, 13:4953-4962 [DOI] [PMC free article] [PubMed] [Google Scholar]