

SUMMARY
In the postabsorptive state, certain tissues, including the brain, require glucose as the sole source of energy. After an overnight fast, hepatic glycogen stores are depleted, and gluconeogenesis becomes essential for preventing life-threatening hypoglycemia. Mice with a targeted deletion of KLF15, a member of the Krüppel-like family of transcription factors, display severe hypoglycemia after an overnight (18 hr) fast. We provide evidence that defective amino acid catabolism promotes the development of fasting hypoglycemia in KLF15−/− mice by limiting gluconeogenic substrate availability. KLF15−/− liver and skeletal muscle show markedly reduced mRNA expression of amino acid-degrading enzymes. Furthermore, the enzymatic activity of alanine aminotransferase (ALT), which converts the critical gluconeogenic amino acid alanine into pyruvate, is decreased (~50%) in KLF15−/− hepatocytes. Consistent with this observation, intraperitoneal injection of pyruvate, but not alanine, rescues fasting hypoglycemia in KLF15−/− mice. We conclude that KLF15 plays an important role in the regulation of gluconeogenesis.
INTRODUCTION
Mice deficient in factors that regulate the activity of gluconeogenic pathway enzymes (e.g., PEPCK) exhibit fasting hypoglycemia (Rhee et al., 2003; Koo et al., 2004; Herzig et al., 2001). However, gluconeogenesis relies upon not only the appropriate expression/function of key regulatory enzymes but also a steady supply of small carbon precursors for use as substrate. A major source of substrate is the catabolism of muscle protein to amino acids. While most amino acids are broken down in the liver, the breakdown of leucine, isoleucine, and valine (the branched-chain amino acids, or BCAAs) in skeletal muscle provides perhaps the most important source of gluconeogenic substrate, alanine. During fasting, the blood is enriched with alanine synthesized in skeletal muscle using amino groups donated from BCAAs. Alanine is the predominant amino acid released from muscle and taken up by the liver (Felig et al., 1969), where it is converted to pyruvate and used for gluconeogenesis (Felig et al., 1970).
The Krüppel-like family of transcription factors is a subclass of Cys2/His2 zinc-finger DNA-binding proteins. Krüppel-like factors are critical regulators of growth and development in a wide variety of tissues (reviewed in Bieker, 2001; Kaczynski et al., 2003). KLF15 is expressed in multiple tissues, including liver, white and brown adipose, kidney, heart, and skeletal muscle, with strongest expression occurring in the liver and kidney (Gray et al., 2002). KLF15 has previously been shown to regulate the expression of genes involved in glucose uptake and adipogenesis, such as GLUT4 (Gray et al., 2002) and PPARγ (Mori et al., 2005). To understand the role of KLF15 in the regulation of glucose homeostasis in vivo, we performed a targeted deletion of this gene in mice by homologous recombination (targeting described in Fisch et al., 2007). KLF15−/− mice exhibit severe hypoglycemia after an overnight (18 hr) fast. To determine the cause of the fasting hypoglycemia, we first assessed whether alterations in hepatic glucose production and/or peripheral glucose disposal contributed to the phenotype. Hyperinsulinemic-euglycemic clamp studies showed normal glucose utilization in peripheral tissues, and no defects were found in the major mechanisms of hepatic energy production, including glycogen storage/breakdown, fatty acid oxidation, and expression of gluconeogenic pathway enzymes. We provide in vivo evidence that in KLF15−/− mice, the gluconeogenic pathway is intact, but inefficient amino acid catabolism limits the availability of gluconeogenic substrate.
RESULTS AND DISCUSSION
Metabolic Phenotype of KLF15-Deficient Mice
Northern analysis of liver and quadriceps skeletal muscle tissue indicated that KLF15 mRNA is undetectable in KLF15−/− mice (Figure 1A). As shown in Figure 1B, there was a small but statistically significant decrease in blood glucose in KLF15−/− males and females compared to same-sex WT controls in the ad libitum-fed state. After an 18 hr fast, KLF15−/− mice show severe hypoglycemia (male: WT = 102 ± 5.8 mg/dl, KLF15−/− = 58 ± 3.2 mg/dl, p < 0.0001; female: WT = 83 ± 5.2 mg/dl, KLF15−/− = 45 ± 2.6 mg/dl, p < 0.0001). Glucose tolerance tests (GTTs) performed on mice that had been fasted for 16 hr and had received an intraperitoneal (i.p.) injection of 1 g glucose/kg body weight indicated that KLF15−/− mice clear glucose more efficiently than WT mice (Figure 1C). The integrated glucose concentrations, calculated as area under the curve, were significantly lower in KLF15−/− mice compared to WT controls. Serum insulin levels of WT and KLF15−/− mice during a separate GTT were not significantly different (see Figure S1 in the Supplemental Data available with this article online), indicating that increased glucose clearance in KLF15−/− mice does not result from enhanced insulin secretion. To directly examine the effect of KLF15 deficiency on insulin sensitivity, we performed a 2 hr hyperinsulinemic-euglycemic clamp study (Figure 1D) at an insulin infusion rate of 2.5 mU/kg/min in awake WT and KLF15−/− mice in the postabsorptive state (5 hr after food removal). As shown in Figure 1D, KLF15−/− mice exhibited a small but statistically insignificant reduction in hepatic glucose production (HGP) in the basal state. However, during the insulin clamp, HGP was reduced by more than 60% in KLF15−/− mice compared to WT controls, which resulted in a significantly elevated glucose infusion rate in the KLF15−/− mice. Finally, whole-body glucose turnover rates were similar in the WT and KLF15−/− groups. These results indicate increased hepatic insulin sensitivity in the KLF15−/− mice and suggest that the enhanced glucose clearance during the GTT results mainly from reduced hepatic glucose production rather than increased peripheral glucose disposal.
Figure 1. Glycemic Responses in Wild-Type versus KLF15-Deficient Mice.
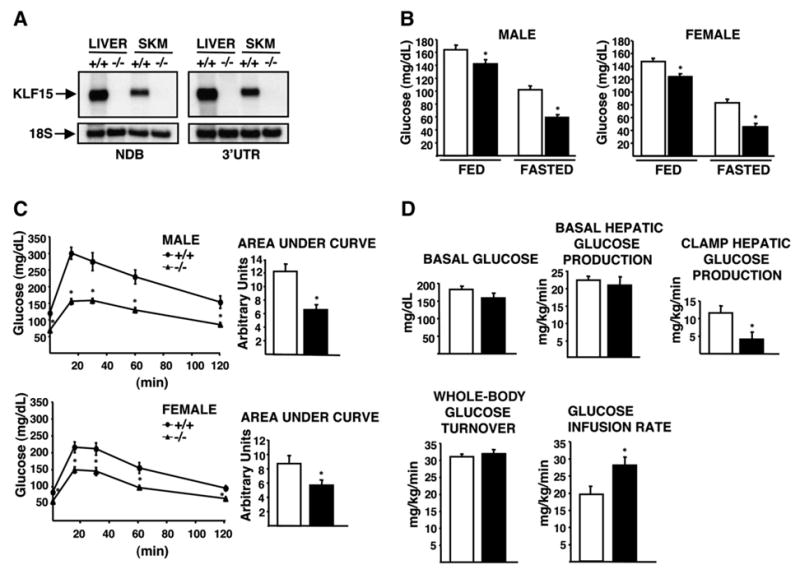
White bars = wild-type; black bars = KLF15−/−. Mice are 2.5–3.5 months old unless otherwise stated.
(A) Representative northern analysis of KLF15 expression in WT (+/+) and KLF15 null (−/−) tissues using probes against the non-DNA-binding domain (NDB) and 3′ untranslated region (3′UTR) of KLF15. Ten micrograms of total RNA was loaded per lane.
(B) Blood glucose levels of WT and KLF15−/− mice in the ad libitum-fed or 18 hr-fasted states; n = 15–20 mice per group. In this and all other figures, error bars represent ± SEM.
(C) Blood glucose concentrations during a glucose tolerance test. Mice were fasted for 16 hr and received an intraperitoneal (i.p.) injection of 1 g glucose/kg body weight. Tail-vein blood samples were assessed for glucose concentration immediately before injection (time 0) and at 15, 30, 60, and 120 min postinjection; n = 7–11 mice per group.
(D) Hyperinsulinemic-euglycemic clamp study in WT and KLF15−/− 4-month-old male mice. Top left: basal plasma glucose levels after a 5 hr fast. Top middle: basal hepatic glucose production after a 5 hr fast. Top right: hepatic glucose production during insulin clamp. Bottom left: insulin-stimulated whole-body glucose turnover. Bottom right: glucose infusion rate during insulin clamp. n = 7 mice per group. Statistical comparisons were made by repeated-measures ANOVA (C) and Student’s t test for unpaired samples (B–D). *p ≤ 0.05 compared to WT control.
Mechanisms of Decreased Hepatic Glucose Production
Thus, we focused on potential causes of decreased hepatic glucose/energy production in order to further understand the mechanism behind the fasting hypoglycemia phenotype. As a first step, we determined the mRNA expression levels of key enzymes involved in fatty acid oxidation (FAO) and gluconeogenesis in WT and KLF15−/− mice. As shown in Figure 2A, the expression levels of carnitine palmitoyltransferase (CPT I) and medium-chain acyl-CoA dehydrogenase (MCAD), two key rate-limiting enzymes of FAO, were not decreased in either liver or skeletal muscle (quadriceps) of KLF15−/− mice. In addition, circulating levels of β-hydroxybutyrate were markedly increased in KLF15−/− mice in the fasted state (Table 1). This hyperketonemia strongly argues against impaired FAO as a contributor to the hypoglycemia, as the substrate for ketone bodies during fasting is derived mainly from acetyl-CoA produced by FAO. Free fatty acid (FFA) levels in fed KLF15−/− mice were increased 2-fold compared to fed WT mice (Table 1). While β-hydroxybutyrate levels were not increased in fed KLF15−/− mice, we consistently observed elevated urine acetoacetate levels (≥ 160 mg/dl) in both fed and fasted KLF15−/− mice (data not shown). A recent study has shown that KLF15 induces PEPCK, one of the main rate-limiting enzymes of gluconeogenesis, in cultured hepatocytes (Teshigawara et al., 2005). However, we found no decrease in the mRNA levels of PEPCK (Figure 2A) or glucose-6-phosphatase/fructose-1,6-bisphosphatase (data not shown) in KLF15−/− mice compared to WT mice in the fed or fasted state. WT and KLF15−/− mice showed no difference in hepatic glycogen content in the fed state; however, after an 18 hr fast, KLF15−/− livers contained ~3.5-fold less glycogen than WT controls (Table 1). This increased capacity for glycogenolysis with fasting may be a compensatory response to the hypoglycemia. No significant difference was detected in serum insulin levels between WT and KLF15−/− mice in both the fed and fasted states, while KLF15−/− mice showed increased fed/fasted glucagon levels, again suggesting a compensatory response (Table 1). Importantly, no significant differences in weight were found between WT and KLF15−/− mice for both males and females at ages 1, 2, 2.5, 3, or 3.5 months (n = 15–20 mice per group; data not shown).
Figure 2. Effect of KLF15 Level on Metabolic Enzyme Expression and Serum Amino Acid Concentrations.
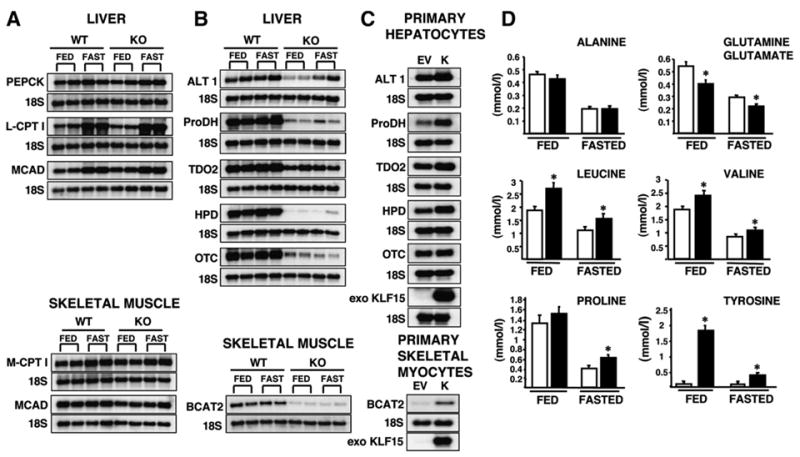
(A and B) Northern analysis of enzymes of gluconeogenesis and fatty acid oxidation (A) and amino acid catabolism (B) in liver and skeletal muscle (quadriceps) isolated from 3- to 4-month-old female WT and KLF15−/− (KO) ad libitum-fed or 18 hr-fasted mice. Ten micrograms of total RNA was loaded per lane. Each column represents an individual mouse; two representative mice (out of six total) are shown for each condition. PEPCK, phosphoenolpyruvate carboxykinase; L-CPT I, liver carnitine palmitoyltransferase 1; M-CPT I, muscle carnitine palmitoyltransferase 1; MCAD, medium-chain acyl-CoA dehydrogenase; ALT 1, alanine aminotransferase 1; ProDH, proline dehydrogenase; TDO2, tryptophan 2,3-dioxygenase; HPD, 4-hydroxyphenylpyruvate dioxygenase; OTC, ornithine transcarbamylase; BCAT2, branched-chain aminotransferase 2.
(C) Northern analysis of enzymes of amino acid catabolism in wild-type primary hepatocytes and skeletal myocytes infected with either empty vector (EV) or KLF15 (K) adenovirus at 30 moi (~10-fold overexpression of KLF15).
(D) Serum amino acid levels in ad libitum-fed or 18 hr-fasted WT and KLF15−/− mice. Blood was collected from the orbital sinus of 2.5- to 3.5-month-old female mice, and serum was analyzed for amino acid content using gas chromatography/mass spectrometry (see Experimental Procedures). White bars = wild-type; black bars = KLF15−/−. n = 16–20 per group; *p ≤ 0.05 compared to WT control (Student’s t test for unpaired samples).
Table 1.
Metabolic Parameters of Wild-Type and KLF15−/− Mice
| Fed
|
Fasted
|
||||
|---|---|---|---|---|---|
| WT | KLF15−/− | WT | KLF15−/− | n | |
| Hepatic glycogen content (mg/g liver) | 41.09 ± 3.24 | 40.87 ± 3.17 | 1.98 ± 0.60 | 0.57 ± 0.17* | 7 |
| FFA (mEq/l) | 0.52 ± 0.04 | 0.97 ± 0.04* | 1.11 ± 0.06 | 1.15 ± 0.05 | 15–18 |
| β-hydroxybutyrate (mmol/l) | 0.28 ± 0.02 | 0.30 ± 0.03 | 1.26 ± 0.15 | 3.04 ± 0.28* | 5–10 |
| Glycerol (mg/dl) | 0.79 ± 0.05 | 1.34 ± 0.08* | 0.83 ± 0.05 | 1.68 ± 0.08* | 17–20 |
| Lactate (mmol/l) | 3.96 ± 0.15 | 3.05 ± 0.18* | 2.18 ± 0.09 | 1.76 ± 0.07* | 17–19 |
| Insulin (ng/ml) | 2.78 ± 0.31 | 2.45 ± 0.28 | 0.08 ± 0.02 | 0.06 ± 0.01 | 12–17 |
| Glucagon (pg/ml) | 51.78 ± 2.00 | 79.47 ± 6.67* | 38.05 ± 1.29 | 54.00 ± 2.84* | 10–18 |
Mice were 3–4 months old for all measurements. Assays of blood samples were performed on isolated serum, except β-hydroxybutyrate values, which were determined on whole blood. Values are means ± SEM.
Significantly different compared to WT control (Student’s t test for unpaired samples; p < 0.05). FFA, free fatty acids; Fed, animals bled or sacrificed between 9:00 and 10:00 a.m.; Fasted, animals fasted overnight (18 hr).
Regulation of Amino Acid-Degrading Enzymes by KLF15
Affymetrix microarray analyses on liver and skeletal muscle (quadriceps) mRNA from 18 hr-fasted WT and KLF15−/− mice revealed reduced expression of multiple genes encoding amino acid-degrading enzymes in KLF15−/− mice (four WT versus four KLF15−/− females [4–5 months old] for each tissue type). Results for several of these genes were confirmed by northern analyses, as shown in Figure 2B. In the liver, a strong reduction was seen in the expression levels of alanine aminotransferase 1 (ALT1), proline dehydrogenase (ProDH), tryptophan 2,3-dioxygenase (TDO2) and 4-hydroxyphenylpyruvic acid dioxygenase (HPD), which catabolize alanine, proline, tryptophan, and tyrosine, respectively. Notably, there are two murine isoforms of alanine aminotransferase, ALT1 and ALT2. Both ALT1 and ALT2 mRNAs are expressed at high levels in the liver; however, in skeletal muscle, ALT2 is strongly expressed, while ALT1 is barely detectable (Jadhao et al., 2004). We found no decrease in the mRNA level of ALT2 in KLF15−/− mice in either liver or skeletal muscle (data not shown). The mRNA level of mitochondrial branched-chain aminotransferase 2 (BCAT2), which catalyzes the first step in the oxidation of the BCAAs, is greatly reduced in skeletal muscle of KLF15−/− mice. Finally, KLF15−/− mice showed a dramatic decrease in the mRNA level of ornithine transcarbamylase (OTC), one of the six enzymes of the urea cycle (Figure 2B).
Adenovirus-mediated overexpression of KLF15 in WT primary hepatocytes induced expression of ALT1, ProDH, TDO2, and HPD. Similarly, overexpression of KLF15 in WT primary skeletal myocytes induced BCAT2 expression (Figure 2C). These results suggest that KLF15 regulates the expression of these genes. The fact that KLF15 over-expression does not induce OTC (Figure 2C) suggests that decreased OTC expression in KLF15−/− mice may reflect a slowdown in the urea cycle secondary to decreased amino acid breakdown.
Effect of KLF15 Deficiency on Serum Amino Acid Concentrations
Given the reduced expression of amino acid breakdown enzymes in KLF15−/− mice, we determined serum amino acid concentrations using gas chromatography/mass spectrometry (Figure 2D; isoleucine and tryptophan were undetectable in this assay). As expected, we found increased concentrations of several amino acids in KLF15−/− serum, including proline, tyrosine, and the BCAAs leucine and valine. As with alanine, the formation of glutamine depends largely upon donation of amino groups from the breakdown of BCAAs in skeletal muscle. The decreased levels of glutamine seen in KLF15−/− mice may therefore result from inefficient BCAA catabolism. Glutamine contributes mainly to renal gluconeogenesis, a source of glucose secondary to hepatic gluconeogenesis (Kida et al., 1978). Thus, reduced circulating levels of glutamine may contribute to the observed phenotype. Surprisingly, there was no significant difference in serum alanine levels between WT and KLF15−/− mice in either the fed or fasted state. One possible explanation for this finding is that, while reduced BCAT2 expression in skeletal muscle may decrease alanine production, reduced ALT1 expression in liver may slow the rate of alanine catabolism, resulting in minimal net change in serum alanine concentration. This result led to the hypothesis that utilization, rather than circulating levels, of alanine may be decreased in KLF15−/− mice.
Alanine Utilization in KLF15-Deficient Mice
Alanine catabolism in the liver involves a one-step conversion of alanine to the gluconeogenic substrate pyruvate via the enzyme alanine aminotransferase. We reasoned that if the gluconeogenic pathway were still intact in KLF15−/− mice, then administration of exogenous pyruvate would rescue fasting hypoglycemia. However, if KLF15−/− mice have a blunted capacity to convert alanine to pyruvate, little or no improvement in hypoglycemia should occur upon administration of alanine. In the first experiment, 4- to 5-month-old WT and KLF15−/− females were fasted for 18 hr, and both groups received an i.p. injection of sodium pyruvate (dissolved in water) or an osmolarity-matched NaCl control solution (Figure 3A). In a separate experiment (Figure 3B), 4- to 5-month-old WT and KLF15−/− females were fasted for 18 hr, and both groups received an i.p. injection of L-alanine (dissolved in NaCl) or NaCl control solution. While WT and KLF15−/− mice showed similar glycemic responses to pyruvate, injection of alanine significantly increased glucose concentration in WT mice, but not in KLF15−/− mice. Thus, KLF15−/− mice are capable of gluconeogenesis but are significantly less efficient than WT mice at utilizing alanine as a source of gluconeogenic substrate.
Figure 3. Pyruvate and Alanine Utilization In Vivo and ALT Activity and Glucose Production in Primary Hepatocytes.
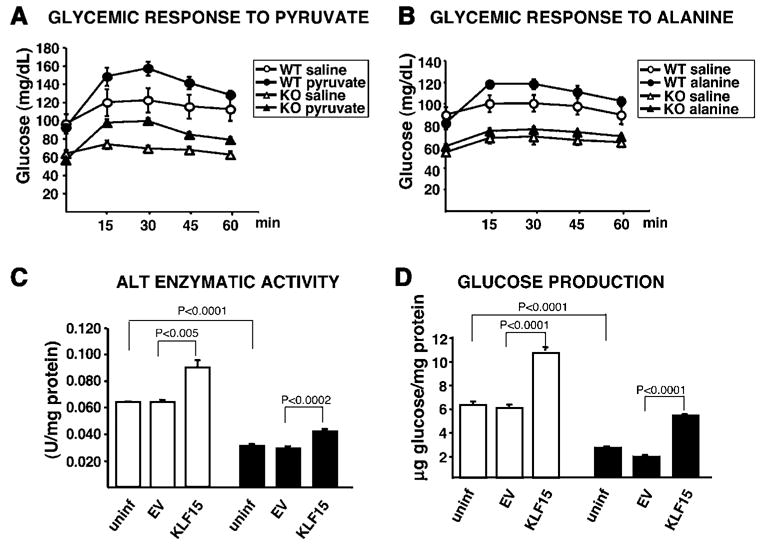
(A and B) 18 hr-fasted WT and KLF15−/− (KO) mice each received an i.p. injection of 500 mg/kg sodium pyruvate dissolved in water or osmolarity-matched 104.5 mg/kg NaCl control solution (A) or 200 mg/kg L-alanine dissolved in 104.5 mg/kg NaCl or 104.5 mg/kg NaCl control solution (B). Tail-vein blood samples were assessed for glucose concentration immediately before injection (time 0) and at the indicated time points postinjection. n = 7 mice per condition. Statistical comparisons were made using MANOVA (p ≤ 0.05 was considered significant). p = 0.0318 WT saline versus WT pyruvate; p = 0.0034 KO saline versus KO pyruvate; p = 0.02647 WT saline versus WT alanine; p = 0.7843 KO saline versus KO alanine.
(C and D) WT (white bars) and KLF15−/− primary hepatocytes (black bars) were either uninfected or adenovirally infected at 30 moi with EV or KLF15 constructs (~10-fold overexpression of KLF15) and incubated at 37°C in glucose production buffer (see Experimental Procedures). The buffer was removed after 3 hr and assayed for glucose content, and the cell lysate was assayed for ALT activity. n = 4 replicates per group for each assay. Statistical comparisons were made using Student’s t test for unpaired samples.
Effect of KLF15 Level on ALT Activity and Glucose Production
Data from several studies confirm that at high alanine concentrations, ALT-mediated transamination is the main step controlling the gluconeogenic flux from alanine (Groen et al., 1982; Mallette et al., 1969; Burelle et al., 2000). To determine whether ALT deficiency in KLF15−/− mice might be involved in their lack of responsiveness to alanine, we first assessed the enzymatic activity of ALT in primary hepatocytes isolated from WT and KLF15−/− mice. As shown in Figure 3C, ALT activity was reduced ~2-fold in KLF15−/− hepatocytes compared to WT hepatocytes. In addition, adenoviral overexpression of KLF15 results in a statistically significant increase in ALT activity in both WT and KLF15−/− hepatocytes. Along with decreased ALT activity, KLF15−/− hepatocytes also exhibit reduced glucose production compared to WT hepatocytes (Figure 3D). Glucose production is increased in WT hepatocytes and rescued to near WT levels in KLF15−/− hepatocytes by adenoviral overexpression of KLF15.
Role of Lactate and Glycerol in Gluconeogenic Substrate Availability
It is important to consider the role of two other significant gluconeogenic substrate precursors, lactate and glycerol. The increase in fed/fasted glycerol levels in KLF15−/− mice (Table 1) is likely due to the effect of increased glucagon concentration on adipose tissue lipolysis. The contribution of glycerol to gluconeogenic substrate formation is relatively minor compared to amino acids or lactate (Landau et al., 1996). Thus, glycerol is unlikely to play a major role in the development of fasting hypoglycemia. However, numerous studies indicate that alanine and lactate are the major gluconeogenic precursors (Consoli et al., 1990; Chochinov et al., 1978; Kreisberg et al., 1970). As shown in Table 1, serum lactate levels are mildly reduced in KLF15−/− mice in both the fed and fasted states. This may be a secondary effect of reduced skeletal muscle glycolysis (Connett et al., 1990), but it could also contribute to lack of gluconeogenic substrate availability. It is clear, however, that an inability of KLF15−/− mice to efficiently utilize alanine (and other amino acids) will significantly limit the formation of gluconeogenic substrate.
Amino Acid Catabolism
KLF15−/− mice exhibit not only fasting hypoglycemia but also a significant decrease in blood glucose concentration in the fed state. This may be due to increased hepatic insulin sensitivity in these mice but could also result from a decrease in amino acid breakdown, which is an important source of energy in both the fed and fasted states (Jungas et al., 1992). In addition, proton magnetic resonance spectroscopy studies on unanesthetized fed WT and KLF15−/− mice (4-month-old males, n = 6–8 per group) showed a significant increase in lean mass in KLF15−/− mice compared to WT controls (KLF15−/− = 27.11 ± 0.29 g, WT = 23.52 ± 0.70 g; p < 0.0002). This is also consistent with decreased amino acid breakdown in KLF15−/− mice, as plasma amino acids are known to both promote the synthesis and inhibit the degradation of muscle protein (Fulks et al., 1975). KLF15−/− mice show a reciprocal decrease in fat mass compared to WT controls (KLF15−/− = 5.22 ± 0.27 g, WT = 7.70 ± 1.21 g; p < 0.04), resulting in similar body weight in these mice.
The mechanism by which KLF15 regulates substrate availability in WT mice during fasting is currently unknown. One possibility is that KLF15 expression is induced with fasting, leading to increased expression of amino acid-degrading enzymes. Teshigawara et al. (2005) find that the level of KLF15 mRNA in the liver increases by 2-fold in response to a 24 hr fast. Yamamoto et al. (2004) show that a 48 hr fast induces KLF15 mRNA expression in skeletal muscle by almost 28-fold. Because KLF15−/− mice are hypoglycemic with 18 hr of fasting, we assessed the level of KLF15 mRNA in liver and skeletal muscle of fed versus 18 hr-fasted WT mice (n = 4 mice per condition) via northern analysis/densitometry. KLF15 expression was not significantly increased in liver and showed an approximately 4-fold increase in skeletal muscle (data not shown). This may explain why the expression of the liver amino acid-degrading enzymes shown in Figure 2B does not increase in 18 hr-fasted versus fed WT mice. BCAT2 expression in WT skeletal muscle also does not increase after an 18 hr fast. Although KLF15 levels in skeletal muscle have been induced 4-fold at this time, this induction may not be sufficient to significantly increase BCAT2 expression. (As shown in Figure 2C, adenoviral overexpression of KLF15 results in a modest induction of BCAT2 in primary skeletal myocytes; however, here, exogenous KLF15 levels represent an ~10-fold increase over endogenous KLF15 levels.)
In general, the fed state is anabolic and the fasted state is catabolic for amino acids and proteins. However, Goldberg and Odessey (1972) have shown that increased utilization of BCAAs in fasted rats is not observed until at least 24 hr after food removal. Thus, it is possible that during the early stages of fasting (<24 hr), basal levels of amino acid catabolism are sufficient for achieving glucose homeostasis. As such, the role of KLF15 during an 18 hr fast may be to maintain, rather than induce, the expression of amino acid-degrading enzymes. Indeed, the observations that KLF15 null animals exhibit a marked reduction in certain amino acid-degrading enzymes and are hypoglycemic support the importance of basal amino acid catabolism. During more prolonged fasting, increased KLF15 levels may serve to not only sustain but also augment the expression of amino acid-degrading enzymes, as shown in our overexpression studies. Finally, we cannot exclude the possibility that KLF15 may affect the function of amino acid-degrading enzymes through additional mechanisms, such as posttranslational modification or cofactor availability.
Much attention has been focused on the transcriptional regulation of key gluconeogenic enzymes such as PEPCK and glucose-6-phosphatase by downstream effectors of glucagon. (Koo et al., 2005; Yoon et al., 2001; Puigserver et al., 2003). Much less is known about the transcriptional regulation of amino acid catabolism, a process that is critical for efficient gluconeogenesis. However, a role for PPARα in this process has been identified (Kersten et al., 2001). The participation of PPARα in various aspects of lipid catabolism is well documented (reviewed in Desvergne and Wahli, 1999). PPARα has now been shown to suppress the expression of several genes involved in amino acid metabolism, including urea-cycle enzymes, leading to a decrease in amino acid degradation. Thus, PPARα and KLF15 appear to perform opposing functions with respect to amino acid catabolism; any potential relationship between these two factors remains to be determined. In summary, KLF15 is the first member of the Krüppel-like family of transcription factors shown to be important for glucose homeostasis in vivo. This study identifies KLF15 as a critical regulator of amino acid catabolism and reveals an unusual mechanism behind the development of fasting hypoglycemia.
EXPERIMENTAL PROCEDURES
Reagents
KLF15 full-length expression vector (pcDNA3.1-KLF15 FLAG) was created by PCR amplification of the KLF15 open reading frame using specific primers that include a FLAG sequence at the 3′ end and BglII and XhoI restriction sites at the 5′ and 3′ ends, respectively. The cDNA fragment was cut with BglII and XhoI and subcloned into the pcDNA3.1 vector (Invitrogen) digested with BamHI and XhoI. The construct was verified by DNA sequence analysis and in vitro transcription/translation. Empty vector (EV) and KLF15 (pcDNA3.1-KLF15 FLAG) adenoviral vectors were prepared by Welgen, Inc.
Animals
KLF15−/− mice were generated as described in Fisch et al. (2007). Homozygous mice were viable/fertile and backcrossed seven generations onto a C57BL/6 background. Animal care and experiments were carried out in accordance with both institutional and federal animal care regulations and were approved by the Harvard Medical Area Standing Committee on Animals.
Analytical Procedures
Concentrations of amino acids, lactate, and glycerol were measured at the Mouse Metabolic Phenotyping Analytical Core Facility at Yale University (see Supplemental Experimental Procedures). Glucose levels in whole blood from the tail vein were determined using a OneTouch Ultra monitor and glucose test strips from LifeScan. β-hydroxybutyrate levels were determined in whole blood from the tail vein using a Precision Xtra monitor and blood β-ketone test strips (Abbott Laboratories, Medisense Products). Total serum nonesterified fatty acid concentrations were measured using an acyl-CoA oxidase-based colorimetric kit (Wako NEFA-C, Wako Pure Chemical Industries) at the RIA Core at Massachusetts General Hospital. Serum insulin concentrations were determined using an Ultrasensitive Rat Insulin ELISA kit with mouse standards (Crystal Chem Inc.). Serum glucagon levels were measured by radioimmunoassay at the Specialized Assay Core at the Joslin Diabetes Center (Boston).
Determination of Hepatic Glycogen Content
Ten to twenty micrograms of frozen liver tissue was dissolved at 95°C for 30 min in 0.3 ml 0.5 M KOH. Twenty-five microliters of 6% Na2SO4 and 750 μl 100% MeOH were added to cooled samples. Samples were incubated for 1 hr at −80°C and centrifuged at 14,000 rpm at 4°C for 5 min. Two hundred microliters of 2 mg/ml amyloglucosidase in 0.2 M sodium acetate buffer (pH 4.9) was added to the pellet for 60 min of incubation at 37°C. Ten microliters of sample was used for glucose assays (GAHK-20 kit, Sigma). Glycogen standard curve was prepared using glycogen (G1767, Sigma) dissolved in 0.5 M KOH.
Hyperinsulinemic-Euglycemic Clamp/Proton Magnetic Resonance Spectroscopy
Clamp (see Supplemental Experimental Procedures) and 1H-MRS studies were performed at the Penn State Mouse Metabolic Phenotyping Center.
RNA Isolation/Northern Analysis
Total RNA from flash-frozen liver and quadriceps skeletal muscle tissue or from primary hepatocytes and skeletal myocytes was isolated using the TRIzol (Invitrogen) method. Ten micrograms per lane was subjected to gel electrophoresis, blotted onto a nylon membrane, and hybridized in QuikHyb solution (Stratagene) at 65°C with 32P-labeled cDNA probes acquired from Open Biosystems. 18S oligos purchased from Invitrogen and KLF15 non-DNA-binding domain and 3′UTR probes were PCR amplified using the KLF15 cDNA clone as a template.
Primary Hepatocyte Studies
Primary hepatocytes were isolated from 3- to 4-month-old female mice via liver perfusion as previously described (Neufeld, 1997) and plated at either 4 × 10e6 cells/10 cm dish or 5 × 10 e5 cells/well of a 12-well plate in Williams’ medium E (GIBCO) supplemented with 10% FBS, 100 U/ml penicillin, 100 μg/ml streptomycin, 1 nM insulin, and 100 nM dexamethasone. Day 1 postisolation, cells were infected with adenovirus at 30 moi in Williams’ medium E supplemented with 10 μg/ml polybrene. The following day, cells in 10 cm dishes were harvested for RNA using the TRIzol method. Glucose production and ALT activity assay were performed on cells in 12-well plates. Cells were washed twice with glucose production buffer (GPB; DMEM [no phenol red, no glucose] + 20 mM sodium lactate, 2 mM sodium pyruvate) and incubated for 3 hr at 37°C in 0.5 ml GPB. GPB was collected and assayed for glucose using the glucose oxidase method (GAGO-20, Sigma). ALT activity was measured using the ALT/GPT (UV-Rate) kit (Stanbio Laboratory, catalog #0930). Briefly, 20 μl of cell lysate was incubated at 37°C with 200 μl ALT reagent containing α-ketoglutarate, DL-alanine, NADH, and LDH. Absorbance at 340 nm was recorded every minute for 30 min. The slope of absorbance decrease is proportional to ALT activity. One unit of ALT activity was defined as the amount of enzyme that catalyzes the formation of 1 μmol/l NAD/min under assay conditions. Protein concentration of cell lysates was determined using the BCA Protein Assay Kit (Pierce). Final glucose production and ALT activity values were corrected for protein content.
Primary Skeletal Myocyte Isolation
Hindlimb skeletal muscle was removed from 10-day-old WT C57BL/6 mice, minced in 2.4 U/ml dispase/1% collagenase B/2.5 mM CaCl2, incubated at 37°C for 30 minutes, triturated, filtered (Netwell; COSTAR), and plated 3–4 hr on a non-collagen-coated plate. The suspension was transferred to a collagen-coated plate and grown in Ham’s F-10 medium + 20% FBS, 1× pen-strep-fungizone, and 2.5 ng/ml bFGF. Cells were passaged in this medium for 2 weeks and differentiated by switching to 5% horse serum/DMEM. Differentiated cells were infected with adenovirus at 30 moi for 24 hr and harvested for total RNA using TRIzol.
Statistical Analysis
Data are expressed as means ± SEM. Results were evaluated by repeated-measures ANOVA, multivariate analysis of variance (MANOVA), or Student’s t test for unpaired samples. The difference was considered to be significant at p ≤ 0.05.
Expression Profiling
Affymetrix microarray analyses were performed at the Harvard Partners Center for Genetics and Genomics.
Supplemental Data
Supplemental Data include Supplemental Experimental Procedures, Supplemental References, and one figure and can be found with this article online at http://www.cellmetabolism.org/cgi/content/full/5/4/305/DC1/.
Supplementary Material
Acknowledgments
We thank T. Michel for valuable advice and assistance and E. Scapa for helpful instruction on primary hepatocyte isolation. Part of this study was conducted at the Penn State Mouse Metabolic Phenotyping Center and supported by grants from the American Diabetes Association (1-04-RA-47) and the Pennsylvania State Department of Health (PA Tobacco Settlement Fund). This study was also conducted at the In Vivo Metabolism Core and the Analytical Core of the NIH-Yale Mouse Metabolic Phenotyping Center (U24 DK59635). Serum metabolite assays were performed in part at the Radioimmunoassay Core at Massachusetts General Hospital (P. Sluss, director) and the Joslin Specialized Assay Core, Joslin Diabetes Center (R.N. Kulkarni, director; DERC grant #R01 DK36836).
This work was supported by NIH grants HL72952, HL75427, HL76754, and HL48743 and ADA grant JF-03 (M.K.J.); NIH grant DK064950 (S.G.); NIH grant F32 HL077052 (S.F.); and Metabolic Physiology Core grant DK57521 (B.K. and O.P.).
Footnotes
Accession Numbers
The data discussed in this publication have been deposited in the NCBI Gene Expression Omnibus (http://www.ncbi.nlm.nih.gov/geo/) under the GEO series accession number GSE7137.
References
- Bieker JJ. Kruppel-like factors: three fingers in many pies. J Biol Chem. 2001;276:34355–34358. doi: 10.1074/jbc.R100043200. [DOI] [PubMed] [Google Scholar]
- Burelle Y, Fillipi C, Peronnet F, Leverve X. Mechanisms of increased gluconeogenesis from alanine in rat isolated hepatocytes after endurance training. Am J Physiol Endocrinol Metab. 2000;278:E35–E42. doi: 10.1152/ajpendo.2000.278.1.E35. [DOI] [PubMed] [Google Scholar]
- Chochinov R, Perlman K, Moorhouse J. Circulating alanine production and disposal in healthy subjects. Diabetes. 1978;27:287–295. doi: 10.2337/diab.27.3.287. [DOI] [PubMed] [Google Scholar]
- Connett RJ, Honig CR, Gayeski TE, Brooks GA. Defining hypoxia: a systems view of VO2, glycolysis, energetics, and intracellular PO2. J Appl Physiol. 1990;68:833–842. doi: 10.1152/jappl.1990.68.3.833. [DOI] [PubMed] [Google Scholar]
- Consoli A, Nurjhan N, Reilly JJ, Jr, Bier DM, Gerich JE. Contribution of liver and skeletal muscle to alanine and lactate metabolism in humans. Am J Physiol Endocrinol Metab. 1990;259:E677–E684. doi: 10.1152/ajpendo.1990.259.5.E677. [DOI] [PubMed] [Google Scholar]
- Desvergne B, Wahli W. Peroxisome proliferator-activated receptors: nuclear control of metabolism. Endocr Rev. 1999;20:649–688. doi: 10.1210/edrv.20.5.0380. [DOI] [PubMed] [Google Scholar]
- Felig P, Owen OE, Wahren J, Cahill GF., Jr Amino acid metabolism during prolonged starvation. J Clin Invest. 1969;48:584–594. doi: 10.1172/JCI106017. [DOI] [PMC free article] [PubMed] [Google Scholar]
- Felig P, Pozefsky T, Marliss E, Cahill GF., Jr Alanine: key role in gluconeogenesis. Science. 1970;167:1003–1004. doi: 10.1126/science.167.3920.1003. [DOI] [PubMed] [Google Scholar]
- Fisch S, Gray S, Heymans S, Wang B, Haldar S, Pfister O, Cui L, Kumar A, Lin Z, Sen-Banerjee S, et al. Krüppel-like factor 15 is a novel regulator of cardiomyocyte hypertrophy. Proc Natl Acad Sci USA. 2007 doi: 10.1073/pnas.0701981104. in press. [DOI] [PMC free article] [PubMed] [Google Scholar]
- Fulks RM, Li JB, Goldberg AL. Effects of insulin, glucose and amino acids on protein turnover in rat diaphragm. J Biol Chem. 1975;250:290–298. [PubMed] [Google Scholar]
- Goldberg AL, Odessey R. Oxidation of amino acids by diaphragms from fed and fasted rats. Am J Physiol. 1972;223:1384–1391. doi: 10.1152/ajplegacy.1972.223.6.1384. [DOI] [PubMed] [Google Scholar]
- Gray S, Feinberg MW, Hull S, Kuo CT, Watanabe M, Sen-Banerjee S, DePina A, Haspel R, Jain MK. The Kruppel-like factor KLF15 regulates the insulin-sensitive glucose transporter GLUT4. J Biol Chem. 2002;277:34322–34328. doi: 10.1074/jbc.M201304200. [DOI] [PubMed] [Google Scholar]
- Groen AK, Sips HJ, Vervoorn RC, Tager JM. Intracellular compartmentation and control of alanine metabolism in rat liver parenchymal cells. Eur J Biochem. 1982;122:87–93. doi: 10.1111/j.1432-1033.1982.tb05851.x. [DOI] [PubMed] [Google Scholar]
- Herzig S, Long F, Jhala US, Hedrick S, Quinn R, Bauer A, Rudolph D, Schutz G, Yoon C, Puigserver P, et al. CREB regulates hepatic gluconeogenesis through the coactivator PGC-1. Nature. 2001;413:179–183. doi: 10.1038/35093131. [DOI] [PubMed] [Google Scholar]
- Jadhao SB, Yang RZ, Lin Q, Hu H, Anania FA, Shuldiner AR, Gong DW. Murine alanine aminotransferase: cDNA cloning, functional expression, and differential gene regulation in mouse fatty liver. Hepatology. 2004;39:1297–1302. doi: 10.1002/hep.20182. [DOI] [PubMed] [Google Scholar]
- Jungas RL, Halperin ML, Brosnan JT. Quantitative analysis of amino acid oxidation and related gluconeogenesis in humans. Physiol Rev. 1992;72:419–448. doi: 10.1152/physrev.1992.72.2.419. [DOI] [PubMed] [Google Scholar]
- Kaczynski J, Cook T, Urrutia R. Sp1- and Kruppel-like transcription factors. Genome Biol . 2003;4:206. doi: 10.1186/gb-2003-4-2-206. [DOI] [PMC free article] [PubMed] [Google Scholar]
- Kersten S, Mandard S, Escher P, Gonzalez FJ, Tafuri S, Desvergne B, Wahli W. The peroxisome proliferator-activated receptor alpha regulates amino acid metabolism. FASEB J . 2001;15:1971–1978. doi: 10.1096/fj.01-0147com. [DOI] [PubMed] [Google Scholar]
- Kida K, Nakajo S, Kamiya F, Toyama Y, Nishio T, Nakagawa H. Renal net glucose release in vivo and its contribution to blood glucose in rats. J Clin Invest. 1978;62:721–726. doi: 10.1172/JCI109182. [DOI] [PMC free article] [PubMed] [Google Scholar]
- Koo SH, Satoh H, Herzig S, Lee CH, Hedrick S, Kulkarni R, Evans RM, Olefsky J, Montminy M. PGC-1 promotes insulin resistance in liver through PPAR-alpha-dependent induction of TRB-3. Nat Med. 2004;10:530–534. doi: 10.1038/nm1044. [DOI] [PubMed] [Google Scholar]
- Koo SH, Flechner L, Qi L, Zhang X, Screaton RA, Jeffries S, Hedrick S, Xu W, Boussouar F, Brindle P, et al. The CREB coactivator TORC2 is a key regulator of fasting glucose metabolism. Nature. 2005;437:1109–1111. doi: 10.1038/nature03967. [DOI] [PubMed] [Google Scholar]
- Kreisberg RA, Pennington LF, Boshell BR. Lactate turnover and gluconeogenesis in normal and obese humans. Diabetes. 1970;19:53–63. doi: 10.2337/diab.19.1.53. [DOI] [PubMed] [Google Scholar]
- Landau BR, Wahren J, Chandramouli V, Schumann WC, Ekberg K, Kalhan SC. Contributions of gluconeogenesis to glucose production in the fasted state. J Clin Invest. 1996;98:378–385. doi: 10.1172/JCI118803. [DOI] [PMC free article] [PubMed] [Google Scholar]
- Mallette LE, Exton JH, Park CR. Effects of glucagon on amino acid transport and utilization in the perfused rat liver. J Biol Chem. 1969;244:5724–5728. [PubMed] [Google Scholar]
- Mori T, Sakaue H, Iguchi H, Gomi H, Okada Y, Takashima Y, Nakamura K, Nakamura T, Yamauchi T, Kubota N, et al. Role of Kruppel-like factor 15 (KLF15) in transcriptional regulation of adipogenesis. J Biol Chem. 2005;280:12867–12875. doi: 10.1074/jbc.M410515200. [DOI] [PubMed] [Google Scholar]
- Neufeld DS. Isolation of rat liver hepatocytes. Methods Mol Biol. 1997;75:145–151. doi: 10.1385/0-89603-441-0:145. [DOI] [PubMed] [Google Scholar]
- Puigserver P, Rhee J, Donovan J, Walkey CJ, Yoon JC, Oriente F, Kitamura Y, Altomonte J, Dong H, Accili D, Spiegelman BM. Insulin-regulated hepatic gluconeogenesis through FOXO1-PGC-1alpha interaction. Nature. 2003;423:550–555. doi: 10.1038/nature01667. [DOI] [PubMed] [Google Scholar]
- Rhee J, Inoue Y, Yoon JC, Puigserver P, Fan M, Gonzalez FJ, Spiegelman BM. Regulation of hepatic fasting response by PPARgamma coactivator-1alpha (PGC-1): requirement for hepatocyte nuclear factor 4alpha in gluconeogenesis. Proc Natl Acad Sci USA. 2003;100:4012–4017. doi: 10.1073/pnas.0730870100. [DOI] [PMC free article] [PubMed] [Google Scholar]
- Teshigawara K, Ogawa W, Mori T, Matsuki Y, Watanabe E, Hiramatsu R, Inoue H, Miyake K, Sakaue H, Kasuga M. Role of Kruppel-like factor 15 in PEPCK gene expression in the liver. Biochem Biophys Res Commun. 2005;327:920–926. doi: 10.1016/j.bbrc.2004.12.096. [DOI] [PubMed] [Google Scholar]
- Yamamoto J, Ikeda Y, Iguchi H, Fujino T, Tanaka T, Asaba H, Iwasaki S, Ioka RX, Kaneko IW, Magoori K, et al. A Kruppel-like factor KLF15 contributes fasting-induced transcriptional activation of mitochondrial acetyl-CoA synthetase gene AceCS2. J Biol Chem. 2004;279:16954–16962. doi: 10.1074/jbc.M312079200. [DOI] [PubMed] [Google Scholar]
- Yoon JC, Puigserver P, Chen G, Donovan J, Wu Z, Rhee J, Adelmant G, Stafford J, Kahn CR, Granner DK, et al. Control of hepatic gluconeogenesis through the transcriptional coactivator PGC-1. Nature. 2001;413:131–138. doi: 10.1038/35093050. [DOI] [PubMed] [Google Scholar]
Associated Data
This section collects any data citations, data availability statements, or supplementary materials included in this article.