

Abstract
Purpose
Thyrotropin receptor (TSHR) expression is upregulated in the orbits of Graves′ ophthalmopathy (GO) patients, the majority of whom have TSHR stimulating antibodies. We have investigated the biological effects of TSHR activation in vitro, in adipose tissue - the site of orbital TSHR expression.
Methods
Activating mutant TSHR (TSHR*) or wild type (WT), were introduced into human orbital preadipocytes using retroviral vectors. Their proliferation (Coulter counting), basal cAMP accumulation (radio-immunoassay), spontaneous and PPARγ induced adipogenesis (quantitative oil red O staining) were assessed and compared with non-modified cells. QRT-PCR was used to measure transcripts of C/EBPß, PPARγ and LPL (early, intermediate & late markers of adipogenesis) and for UCP-1 (brown adipose tissue, BAT).
Results
Expression of TSHR* significantly inhibited the proliferation of pre- adipocytes and produced an increase in unstimulated cAMP of 200 to 600%. Basal lipid levels were significantly increased in TSHR* (127 to 275%) compared with non-modified (100%) or WT (104 to 187%) expressing cells. This was accompanied by 2 to 10 fold increases in early-intermediate markers and UCP-1 transcripts (2 to 8 fold); LPL was at the limit of detection. In non-modified cells, adipogenesis produced significant increases in transcripts of all markers, including LPL (∼30 fold). This was not the case in TSHR* expressing cells, which also displayed 67 to 84% reduction in lipid levels,
Conclusions
TSHR activation stimulates early differentiation (favouring BAT formation?) but renders preadipocytes refractory to PPARγ induced adipogenesis. In neither case do lipid-containing vacuoles accumulate suggesting that terminal stages of differentiation have been inhibited.
Introduction
Graves′ disease (GD) is caused by thyrotropin (TSH) receptor (TSHR) stimulating antibodies (TSAB) that mimic the action of TSH and produce hyperthyroidism (1). A proportion of GD patients have ophthalmopathy (GO), in which expansion of the orbital contents by adipogenesis, over-production of extra-cellular matrix and edema, lead to proptosis (2). The target autoantigen of GD, the TSHR, is expressed in the orbits of GO patients (3, 4). Specifically it is upregulated during adipogenesis (5, 6). Recent improvements in patient management, especially avoiding elevated TSH, have decreased the incidence of GO (7). Furthermore, a positive correlation has been reported between TSAB titre and GO activity (8), as assessed using a clinical activity score (CAS). These facts suggest that TSHR activation (TSHR*), either by excess hormone or TSAB, are contributing to the disease process.
The receptor can also be activated by gain of function mutations; with somatic changes responsible for toxic adenoma and germline mutations causing familial hyperthyroidism (1). Of interest, two newborns harboring different activating germline TSHR mutations, L629F and M453T, displayed proptosis (9, 10). We have exploited this activation mechanism to establish an in vitro model to investigate the resulting biological effects, beginning with adipose tissue, the site of TSHR expression in the orbit.
Methods
Sample Collection, preadipocyte culture, generation of TSHR* expressing cells
Orbital adipose tissue was obtained with informed consent and relevant local ethical approval. The research adhered to the tenets of the Declaration of Helsinki.
Six tissue samples were collected, 3 from GO patients (undergoing decompressive surgery) and 3 from individuals free of GO and thyroid autoimmunity (undergoing blepharoplasty with fat pad excision).
Preadipocytes were obtained from explants of the adipose tissues, cultured in DMEM/F12 10% FCS (complete medium). Adipogenesis was induced in confluent cells by replacing with medium having reduced FCS and containing a range of hormones and PPARγ agonists (differentiation medium), for 10 days, as previously described (11).
Activating mutant TSHR, L629F and M453T, and the WT were introduced using retroviral vectors, previously produced in our laboratory (12). Geneticin selection resulted in mixed populations stably expressing the various TSHR, all as previously described (12).
Effect on proliferation and cAMP levels
The WT, TSHR* expressing and non-modified preadipocytes were plated at 5×10⁴/well in 12 well plates. They were counted 3 and 5 days after plating, using a Coulter particle counter, the difference giving proliferation in 48 hours. Results are expressed as total increased cell counts or as population doubling time (PDT).
The same plating conditions were used for cAMP estimates but once attached, the cells were incubated for 4 hours in medium containing 10−4M isobutylmethylxanthine (IBMX) with no further addition, (basal conditions) plus 10−5 M forskolin or 10 mU/ml bovine TSH. Cyclic AMP was extracted in 0.1M HCL and measured using an in-house radio-immunoassay capable of detecting femtogram quantities of the second messenger, as previously described (13). Coulter counting of adjacent wells provided an accurate cell number for results to be expressed as pmoles cAMP/104cells.
Effect on spontaneous and PPARγ induced adipogenesis
The various cell populations (in 12 well plates) were examined in complete and differentiation medium. Microscopic examination provided a means of determining whether morphological changes, e.g. rounding-up of cells and/or acquisition of lipid filled droplets, had occurred. In addition, the cells were subjected to oil red O staining, followed by extraction of the absorbed dye with 100% isopropanol and measurement of the OD490. Coulter counting of adjacent wells provided an accurate cell number for standardization of OD values.
QRT-PCR of transcripts for early, intermediate, late adipogenesis and BAT
The various cell populations were plated in 6 well plates in complete or differentiation medium. Ten days later, RNA was extracted, reverse transcribed and transcript copy numbers for C/EBPß, PPARγ, LPL and UCP-1 measured using Sybr green and a Stratagene MX3000 light cycler. Primer details are provided in (table 1).
Table 1.
Forward and reverse primer sequences, exon location and amplicon sizes in base pairs (bp) for genes analysed by QRT-PCR.
| Gene | Forward Primer | Reverse Primer |
|---|---|---|
| C/EBPß 304 bp |
AACTTTGGCACTGGGG Exon 1 |
GGCCCGGCTGACAGTT Exon 1 |
| PPARγ 390 bp |
CAGTGGGGATGTCTCATA Exon 3 |
CTTTTGGCATACTCTGTGAT Exon 5 |
| LPL 275 bp |
GAGATTTCTCTGTATGGACC Exon 7 |
CTGCAAATGAGACACTTTCTC Exon 9 |
| UCP-1 540 bp |
CGGATGAAACTCTACAGCGG Exon 2 |
CACTTTTGTACTGTCCTGGTGG Exon 5 |
| APRT 247 bp |
GCTGCGTGCTCATCCGAAAG Exon 3 |
CTTTAAGCGAGGTCAGCTGC Exon 5 |
Comparative analyses were performed with reference to the housekeeping gene, APRT. Results are expressed as fold differences in transcript copy number calculated from the ratio of crossing threshold (Ct) value gene of interest: Ct value APRT.
Statistical analysis
Means were compared non-parametrically by Kruskal Wallis and post hoc by Dunns multiple comparison test and parametrically by ANOVA with post hoc TUKEY HSD.
Results
Adipose explants can be maintained in culture for long periods
It was possible to harvest preadipocytes for up to 9 months, during which time the explants shrank. Preadipocytes in close proximity to the explant had oil red O positive lipid filled vacuoles (Figure 1A), which persisted. If the explants were detached from the culture dish, lipid filled vacuoles in the adherent preadipocytes decreased (figure 1B), whilst in dishes in which the explant was completely removed, all cells assumed a uniform fibroblast appearance (figure 1C). Cells from this last condition were used for subsequent experimentation.
Figure 1.
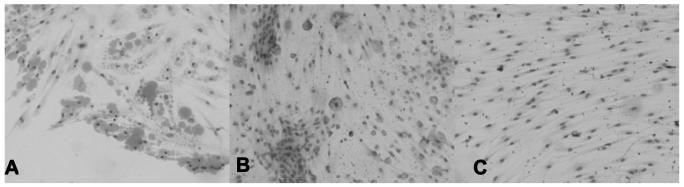
lipid filled vacuoles in preadipocytes in close proximity to adipose tissue explant (A), in cultures in which the explant was detached (B) and in cultures in which the explant had been removed from the dish (C).
TSHR activation increases intracellular cAMP in preadipocytes
In thyroid cells, the TSHR is coupled to Gsa, which activates adenylate cyclase producing increased cAMP on ligand binding, or in the absence of ligand for gain of function mutants such as M453T and L629F (1). To investigate whether the TSHR is functional and similarly coupled in preadipocytes, we measured TSH induced cAMP, whilst unstimulated cAMP levels would indicate whether the gain of function mutants were active. Forskolin provided a positive control and in all cases induced a robust increase in cAMP corresponding to at least a 10 fold increase compared with basal.
As shown in (figure 2 A & B), the non-modified cells have minimal (2 fold increase) response to TSH, in keeping with the very low proportion of these cells expressing the receptor. In contrast, TSH induces a 4 to 16 fold increase in cells expressing the WT or mutant forms of TSHR, indicating that the receptor is coupled to Gsa in these cells. Furthermore, unstimulated (basal) cAMP is significantly (p<0.05, GO, p<0.01 non-GO) increased in the L629F and M453T expressing cells compared with the non-modified or WT, indicating that the gain of function mutants are active in preadipocytes from normal orbits and patients with GO.
Figure 2.


cAMP levels in non-modified or WT/activating mutant TSHR (L629F, M453T) expressing preadipocytes from patients with Graves′ ophthalmopathy (GO) (A) and non-GO (B) orbits. Results are expressed as pmoles cAMP /104cells measured in basal conditions or in response to 10 mU/ml TSH or 10−5M forskolin.
TSHR activation inhibits preadipocyte proliferation
The effects of TSHR activation on proliferation were studied. In all cases there was a significant inhibition of proliferation when comparing cells expressing the mutant TSHR and the non-modified cells, and in some instances between the WT and non-modified cells (representative examples are shown in figure 3 A and B). The effects were always most apparent with mutant M453T and in 2 instances (1GO, 1 non-GO) these cells proliferated so slowly that insufficient numbers of cells were obtained for experimentation.
Figure 3.

Proliferation (increase in cell number in 48 hours) in non-modified or WT/activating mutant (L629F, M453T) TSHR expressing preadipocytes from patients with Graves′ ophthalmopathy (GO) (A) and non-GO orbits (B) cultured in complete medium.
Both GO and non-GO preadipocytes displayed inhibition of proliferation which resulted in a significant increase in PDT (hours) from e.g. 38±2.8 (non-modified); to 43± 4 (WT); 86±7.7 (L629F) and 160±15.2 (M453T) in preadipocytes from a non-GO orbit.
TSHR activation induces morphological changes in preadipocytes
In complete medium, orbital preadipocytes expressing mutant TSHR had a more rounded appearance than their WT expressing or non-modified counterparts, but there were no obvious lipid vacuoles, either microscopically or following Oil red O staining. A representative example is shown in (figure 4).
Figure 4.
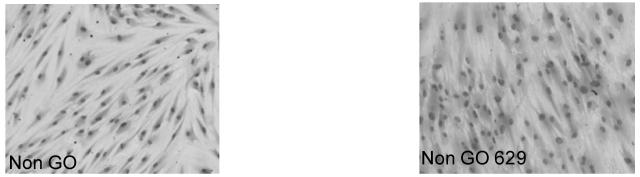
Non-modified preadipocytes from a non-Graves′ Ophthalmopathy orbit appear as elongated fibroblasts (non-GO). The same cells expressing mutant TSHR L629F have a more rounded appearance (non-GO 629).
TSHR activation increases the lipid content of preadipocytes
Visual examination of the various preadipocyte populations cultured in complete medium revealed no obvious oil red O staining droplets. However, when quantifying the lipid content, the mutant (and to a lesser extent WT) TSHR expressing cells, both from GO and non-GO orbits, displayed increased oil red O staining compared with non-modified, (p<0.05 GO, p<0.01 non-GO) as illustrated in representative examples in (figure 5).
Figure 5.

Lipid accumulation, expressed as OD490 of oil red O staining, in non-modified or WT/activating mutant (L629F, M453T) TSHR expressing preadipocytes from patients with Graves′ ophthalmopathy (GO) and non-GO orbits cultured in complete medium.
To mimic more closely the situation in GD, the various preadipocyte populations were cultured in complete medium supplemented with T3 (1nM). Since insulin has been reported to be essential for adipogenesis, experiments were also performed in complete medium supplemented with insulin (500nM) alone, or combined with T3. Neither set of conditions resulted in the appearance of lipid vacuoles nor was there any further increase in the lipid content of the cells, assessed using oil red O. A representative example is shown in (figure 6).
Figure 6.

Lipid accumulation, expressed as OD 490 of oil red O staining, in non-modified or WT/activating mutant TSHR (L629F, M453T) expressing preadipocytes from a non-GO orbit cultured in complete medium alone or supplemented with T3 plus insulin (T3/Ins) or in differentiation medium (Diff).
TSHR activation renders preadipocytes refractory to PPARγ induced adipogenesis
The various preadipocyte populations were allowed to reach confluence and then maintained in differentiation medium for 10 days. In the non-modified cells, morphological evidence of differentiation and visible oil red O stained droplets were apparent in all microscopic fields examined and was accompanied by a significant increase in lipid content. The behaviour of the preadipocytes transduced with the WT receptor was similar to the equivalent non-modified population. In contrast, in cells expressing the most potent activating mutant TSHR oil red O stained vacuoles were absent and there was little or no increase in the lipid content. A representative example (non-GO preadipocytes) is shown in (figure 6).
Representative examples (GO preadipocytes) of the morphological changes and oil red O stained vacuoles are shown in figure 7.
Figure 7.
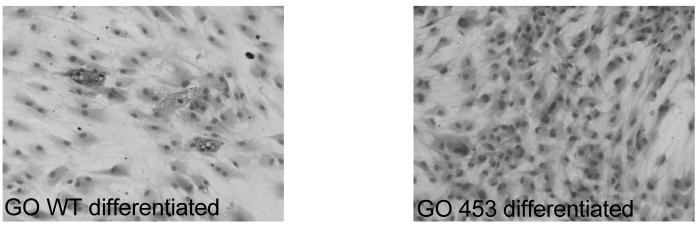
Oil red O staining in WT or activating mutant TSHR M453T expressing preadipocytes from a patient with Graves′ ophthalmopathy (GO) in differentiation medium.
TSHR activation induces early & intermediate markers of adipogenesis
The results obtained with oil red O staining of the mutant expressing preadipocytes were paradoxical. Microscopic examination revealed no positive vacuoles in complete and reduced or no vacuoles in differentiation medium, yet the basal lipid content of the cells was higher but failed to increase in response to a PPARγ agonist. To investigate further the transcript copy number of genes whose expression is upregulated during adipogenesis was calculated. In non-modified preadipocytes, PPARγ induced adipogenesis (visible oil red O positive lipid droplets) was accompanied by an increase in all the markers of differentiation tested, when compared with the equivalent transcript copy number obtained in these cells in complete medium.
In the TSHR* expressing cells, no PPARγ induced adipogenesis was apparent and the transcript copy number of the differentiation markers was not increased, and in some instances was reduced, when compared with the same cells in complete medium. When comparing the non-modified cells and the TSHR* expressing cells, all in complete medium, transcript copy number for markers of early to intermediate differentiation and brown adipose tissue formation were upregulated but not those for the terminal stages of adipogenesis, as summarized in (table 2).
Table 2.
Fold increase in transcript copy numbers of CAACT enhancer binding protein beta (C/EBPß), peroxisome proliferator activated receptor gamma (PPARγ), lipoprotein lipase (LPL) and uncoupling protein 1 (UCP-1) in non-modified and WT/activating mutant TSHR (L629F, M453T) expressing preadipocytes from Graves' ophthalmopathy (GO) and non-GO orbits cultured in complete medium or in differentiation medium.
| Fold change in TCN PPARγ versus basal medium | Fold change TCN basal TSHR* versus non-mod |
||
|---|---|---|---|
| Non-modified cells | TSHR* expressing | ||
| C/EBPß | 1.5 – 5 × increase | 2 – 3 × reduced | 2 – 10 × increase |
| PPARγ | 7 – 20 × increase | 0 – 4 × increase | 2 – 4 × increase |
| LPL | 20 - 30× increase | Limit of detection | Limit of detection |
| UCP-1 | 10-150 × increase | 0 – 7 × increase | 2 – 8 × increase |
A representative example of the individual CT values obtained is shown in (table 3).
Table 3.
Mean (S.D.) of crossing threshold (CT) values obtained in preadipocytes from an individual free of Graves' ophthalmopathy and maintained in complete medium or in differentiation medium. Each experiment was performed in triplicate (these agreed to within 10%) and all were repeated a minimum of twice, thus CT values quoted are the mean of at least 6 measurements.
| Mean (S.D.) CT | Complete Medium | PPARγ-induced adipogenesis | ||
|---|---|---|---|---|
| APRT | PPARγ | APRT | PPARγ | |
| Non | 26.5 (0.2) | 30.3 (0.6) | 25 (0.3) | 25.2 (0.5) |
| WT | 26 (0.1) | 29 (0.2) | 26.6 (0.7) | 29.1 (0.8) |
| L629F | 25.4 (0.3) | 27 (0.6) | 24.3 (0.4) | 26 (0.4) |
| M453T | 26 (0.5) | 28 (0.5) | 25 (0.2) | 26 (0.6) |
Discussion
Orbital fat is a scarce commodity, compounded by the loss of phenotype of preadipocytes which have undergone several passages. We have modified the explant cultures, transferring the adipose tissue fragments to new dishes for re-attachment, and thus being able to harvest first passage preadipocytes for several months.
A heterogeneous population of cells migrates from the explants, including fibroblast-like preadipocytes and cells at various stages of fat maturation. Cells containing lipid vacuoles could be the former cells undergoing adipogenesis or the latter in the process of de-differentiating. Studies from Gesta and colleagues (14) indicate that de-differentiation occurs within the first 48 hours of culture. We observed cells, in close proximity to the explants, with lipid filled droplets persisting for several months. It was only detachment or removal of the explant which reduced the lipid droplets, indicating the production of pro-adipogenic signals, both soluble and via cell-cell contact, by mature fat.
Our subsequent experiments indicate that TSHR activation stimulates the early stages of adipogenesis but inhibits the terminal stages of differentiation. The absence of lipid filled droplets, but increased cellular lipid content, suggests that either lipolysis is upregulated, or that the cytoskeletal changes necessary for droplet formation have been inhibited. The fact that lipoprotein lipase transcripts remain at the limit of detection in cells expressing TSHR*, favours the latter mechanism. The results agree with earlier reports of cAMP elevation rapidly reducing a suppressor of adipogenesis Wnt (15), thereby promoting differentiation. In contrast prolonged elevation of cAMP by pharamacological agents reduced accumulation of lipids, by decreasing key lipogenic enzymes rather than increasing lipolysis (16).
TSHR activation also seems to favour the development of brown adipose tissue. Although elevated UCP-1 transcripts are a feature of human preadipocytes exposed to PPARγ agonists (17), we observed an increase in UCP-1 copies in the TSHR* expressing cells, even in complete medium (basal conditions). It is possible that this feature may be restricted to orbital preadipocytes, a depot having many similarities with brown adipose tissue, e.g. selective expansion (along with intrascapular fat) in mice over-expressing adiponectin (18).
We have opted to use gain of function mutants of the TSHR as an activation mechanism, rather than adding the pathological ligands, TSAB. At the time this study commenced, only patient sera containing heterogeneous mixes of TSAB were available, since monoclonal TSAB have only recently been developed (19-22). Furthermore, our previous experiences demonstrated that the vectors transduce a physiological level of TSHR expression, since we were unable to distinguish endogenous rat TSHR from transduced human TSHR using flow cytometry in a rat thyroid cell line (12) The model also has the advantage of generating both free a and ß/γ subunits of the G protein, unlike an earlier study (23) in which constitutively active Gsa mutants were expressed in the murine 3T3L1 cell line There was no effect on proliferation; basal cAMP and/or rates of adipogenesis compared to non-modified cells were not examined.
More recent studies have reported that activation of CREB (by phosphorylation) is necessary and sufficient to induce adipogenesis in the 3T3L1 preadipocyte cell line (24). CREB can be activated by the cAMP/PKA route, although there are other activation mechanisms. In the FRTL5 thyroid cell line, we observed increased phosphorylated CREB (p-CREB) in cells expressing TSHR* compared with the WT or non-modified cells (25). Thus we would have expected that the human preadipocytes expressing the same gain of function mutant TSHR would also have increased p-CREB and should thus exhibit spontaneous adipogenesis. However preliminary experiments indicate that this is not the case, with 3 to 4 fold higher pCREB present in WT compared with activating mutant TSHR expressing cells. This is in agreement with the work of Brunetti and colleagues, who demonstrated increased adenylate cyclase but reduced pCREB in toxic adenoma (somatic TSHR*) compared with adjacent healthy thyroid tissue (26). We assume that the discrepancy between cAMP and pCREB is the consequence of up-regulation of counter-regulatory mechanisms, e.g. the inducible cAMP early repressor (27), induced by the higher levels of cAMP present in the L629F and M453T transduced preadipocytes. The difference illustrates that whilst providing useful in vitro models, rodent preadipocyte cell lines do not replicate all aspects of human adipogenesis. Although we have investigated primary preadipocytes, our model does not faithfully reproduce TSHR expression during adipogenesis. Haraguchi and colleagues demonstrated that the receptor is upregulated, reaching a maximum at around day 9 of an adipogenesis protocol including insulin, dexamethazone and a phosphodiesterase inhibitor. Transcript levels then declined (28). Our vectors are driven by a viral promoter so that receptor expression is permanently 'ON'. We are generating inducible retroviral vectors and siRNA, to permit modulation of activating TSHR expression and thus mimic more closely that occurring during adipogenesis.
Apart from this shortcoming, our model has addressed how TSHR activation might affect just one of the mechanisms operating to increase the orbital volume in GO. We are aware that not all GO patients have circulating TSAB and thus other processes may be in operation. Furthermore, the TSHR is expressed on just a small proportion of orbital fibroblasts. Increased cAMP in preadipocytes has been associated with production of an adipogenic factor, a putative endogenous PPARγ agonist (29). If this were the case, TSHR activation could have an indirect effect on adipogenesis, by elaborating an adipogenic factor having paracrine effects. Experiments are underway using conditioned medium from our transduced cells to investigate their pro-adipogenic activity on primary preadipocytes from various fat depots, including the orbit.
In conclusion we have demonstrated that TSHR activation stimulates early differentiation and may favour formation of brown adipose tissue. In contrast TSHR activation renders preadipocytes refractory to PPARγ induced adipogenesis. In neither case do lipid-containing vacuoles accumulate suggesting that terminal stages of differentiation have been inhibited.
Acknowledgements
We are greatly indebted to Mrs. Carol Lane for providing orbital samples. We wish to thank Professor Maurice Scanlon for his continued support. We are grateful to the Wellcome Trust and Wales Office of Research & Development for providing the funding.
Footnotes
Supported by grants from The Wellcome Trust and Wales Office for Research & Development.
References
- 1.Paschke R, Ludgate M. The Thyrotropin Receptor in Thyroid Disease. N Engl J Med. 1997;337:1675–1681. doi: 10.1056/NEJM199712043372307. [DOI] [PubMed] [Google Scholar]
- 2.Ludgate M, Baker G. Unlocking the immunological mechanisms of orbital inflammation in thyroid eye disease. Clin Exp Immunol. 2002;127:193–198. doi: 10.1046/j.1365-2249.2002.01792.x. [DOI] [PMC free article] [PubMed] [Google Scholar]
- 3.Feliciello A, Porcellini A, Ciullo L, Bonavolonta G, Avvedimento E, Fenzi G. Expression of thyrotropin receptor mRNA in healthy and Graves' disease retro-orbital tissue. Lancet. 1993;342:337–338. doi: 10.1016/0140-6736(93)91475-2. [DOI] [PubMed] [Google Scholar]
- 4.Crisp M, Lane C, Halliwell M, Wynford-Thomas D, Ludgate M. Thyrotropin Receptor Transcripts In Human Adipose Tissue. J Clin Endocrinol Metab. 1997;82:2003–2005. [PubMed] [Google Scholar]
- 5.Starkey KJ, Janezic A, Jones G, Jordan N, Baker G, Ludgate M. Adipose Thyrotropin Receptor Expression is Elevated in Graves' and Thyroid Eye Diseases Ex Vivo and Indicates Adipogenesis in Progress In Vivo. J Mol Endocrinol. 2003;30:369–380. doi: 10.1677/jme.0.0300369. [DOI] [PubMed] [Google Scholar]
- 6.Valyasevi RW, Erickson DZ, Harteneck DA, et al. Differentiation of human orbital preadipocyte fibroblasts induces expression of functional thyrotropin receptor. J Clin Endocrinol Metab. 1999;84:2557–2562. doi: 10.1210/jcem.84.7.5838. [DOI] [PubMed] [Google Scholar]
- 7.Kung AW, Yau CC, Cheng A. The incidence of ophthalmopathy after radioiodine treatment for Graves′ disease: prognostic factors and the role of methimazole. J Clin Endocrinol Metab. 1994;79:542–546. doi: 10.1210/jcem.79.2.7913934. [DOI] [PubMed] [Google Scholar]
- 8.Khoo DH, Ho SC, Seah LL, et al. The combination of absent thyroid peroxidase antibodies and high thyroid-stimulating immunoglobulin levels in Graves′ disease identifies a group at markedly increased risk of ophthalmopathy. Thyroid. 1999;9:1175–1180. doi: 10.1089/thy.1999.9.1175. [DOI] [PubMed] [Google Scholar]
- 9.De Roux N, Polak M, Couet J, et al. A neomutation of the thyroid stimulating hormone receptor in a severe neonatal hyperthyroidism. J Clin Endocrinol Metab. 1996;81:2023–2026. doi: 10.1210/jcem.81.6.8964822. [DOI] [PubMed] [Google Scholar]
- 10.Fuhrer D, Wonerow P, Willgerodt W, Scherbaum W, Paschke R. Identification of a new TSH receptor germline mutation (Leu629Phe) in a family with neonatal onset of autosomal dominant nonautoimmune hyperthyroidism. J Clin Endocrinol Metab. 1997;82:4234–4238. doi: 10.1210/jcem.82.12.4405. [DOI] [PubMed] [Google Scholar]
- 11.Starkey K, Heufelder A, Baker G, et al. PPARγ in Thyroid Eye Disease: Contra-indication for Thiazolidenedione Use? J Clin Endocrinol Metab. 2003;88:55–59. doi: 10.1210/jc.2002-020987. [DOI] [PubMed] [Google Scholar]
- 12.Fuhrer D, Lewis MD, Alkhafaji F, et al. Biological activity of activating TSHR mutants depends on the cellular context. Endocrinology. 2003;144:4018–4030. doi: 10.1210/en.2003-0438. [DOI] [PubMed] [Google Scholar]
- 13.Crisp MS, Starkey KJ, Lane C, Ham J, Ludgate M. Adipogenesis in Thyroid Eye Disease. Invest Ophthalmol Vis Sci. 2000;41:3249–3255. [PubMed] [Google Scholar]
- 14.Gesta S, Lolmede K, Daviaud D, et al. Culture of human adipose tissue explants lead to profound alteration of adipocyte gene expression. Horm Metab Res. 2003;35:158–163. doi: 10.1055/s-2003-39070. [DOI] [PubMed] [Google Scholar]
- 15.Bennett CN, Ross SE, Longo KA, et al. Regulation of Wnt signaling during adipogenesis. J Biol Chem. 2002;277:30998–31004. doi: 10.1074/jbc.M204527200. [DOI] [PubMed] [Google Scholar]
- 16.Spiegelman B, Green H. Cyclic AMP-mediated control of lipogenic enzyme synthsis during adipose differentiation of 3T3 cells. Cell. 1981;24:503–510. doi: 10.1016/0092-8674(81)90341-x. [DOI] [PubMed] [Google Scholar]
- 17.Digby JE, Montague CT, Sewter CP, et al. Thiazolidinedione exposure increases the expression of uncoupling protein 1 in cultured human preadipocytes. Diabetes. 1998;47:138–141. doi: 10.2337/diab.47.1.138. [DOI] [PubMed] [Google Scholar]
- 18.Combs TP, Pajvani UB, Berg AH, et al. A Transgenic Mouse with a Deletion in the Collagenous Domain of Adiponectin Displays Elevated Circulating Adiponectin and Improved Insulin Sensitivity. Endocrinology. 2004;145:367–383. doi: 10.1210/en.2003-1068. [DOI] [PubMed] [Google Scholar]
- 19.Ando T, Latif R, Pritsker A, Moran T, Nagayama Y, Davies TF. A monoclonal thyroid stimulating antibody. J Clin Invest. 2002;110:1167–1174. doi: 10.1172/JCI16991. [DOI] [PMC free article] [PubMed] [Google Scholar]
- 20.Costagliola S, Frannsen JDF, Bonomi M, Urizar E, Willnich M, Bergmann A, Vassart G. Generation of a mouse monoclonal TSH-receptor antibody with stimulating activity. Biochem Biophys Res Comm. 2002;299:891–896. doi: 10.1016/s0006-291x(02)02762-6. [DOI] [PubMed] [Google Scholar]
- 21.Sanders J, Jeffreys J, Depraetere H, Richards T, Evans M, Kiddie A, Brereton K, Groenen M, Oda Y, Furmaniak JG, Smith BR. Thyroid-stimulating monoclonal antibodies. Thyroid. 2002;12:1043–1050. doi: 10.1089/105072502321085135. [DOI] [PubMed] [Google Scholar]
- 22.Sanders J, Evans M, Premawardhana LDKE, Depraetere H, Jeffreys J, Richards T, Furmaniak J, Smith BR. Human monoclonal thyroid stimulating antibody. Lancet. 2003;362:126–128. doi: 10.1016/s0140-6736(03)13866-4. [DOI] [PubMed] [Google Scholar]
- 23.Gordeladze JO, Ho vik KE, Merendino JJ, Hermouet S, Gutkind S, Accili D. Effect of activating and inactivating mutations of Gs and Gi2 alpha protein subunits on growth and differentiation of 3T3L1 preadipocytes. J Cell Biochem. 1997;64:242–257. doi: 10.1002/(sici)1097-4644(199702)64:2<242::aid-jcb8>3.0.co;2-x. [DOI] [PubMed] [Google Scholar]
- 24.Reusch JEB, Colton LA, Klemm DJ. CREB activation induces adipogenesis in 3T3-L1 cells. Mol Cell Biol. 2000;20:1008–1020. doi: 10.1128/mcb.20.3.1008-1020.2000. [DOI] [PMC free article] [PubMed] [Google Scholar]
- 25.Al-Khafaji F, Wiltshire M, Fuhrer D, et al. Biological activity of activating TSHR mutants: Modulation by iodide. J Mol Endocrinol. 2005;34:209–220. doi: 10.1677/jme.1.01590. [DOI] [PubMed] [Google Scholar]
- 26.Brunetti A, Chiefari E, Filetti S, Russo D. The 3′,5′-cyclic adenosine monophospahte response element binding protein (CREB) is functionally reduced in human toxic thyroid adenomas. Endocrinology. 2000;141:722–730. doi: 10.1210/endo.141.2.7331. [DOI] [PubMed] [Google Scholar]
- 27.Lalli E, Sassone-Corsi P. Thyroid stimulating hormone (TSH) –directed induction of the CREM gene in the thyroid gland participates in the long-term desensitization of the TSH receptor. Proc Natl Acad Sci USA. 1995;92:9633–9637. doi: 10.1073/pnas.92.21.9633. [DOI] [PMC free article] [PubMed] [Google Scholar]
- 28.Haraguchi K, Shimura H, Lin L, Saito TEndo T, Onaya T. Functional expression of thyrotropin receptor in differentiated 3T3-L1 cells: a possible model cell line of extrathyroidal expression of thyrotropin receptor. Biochem Biophys Res Comm. 1996;223:193–198. doi: 10.1006/bbrc.1996.0868. [DOI] [PubMed] [Google Scholar]
- 29.Tzameli I, Fang H, Oliero M, et al. Regulated production of a peroxisome proliferators activated receptor gamma ligand during an early phase of adipocyte differentiation in 3T3-L1 adipocytes. J Biol Chem. 2004;279:36093–36102. doi: 10.1074/jbc.M405346200. [DOI] [PubMed] [Google Scholar]