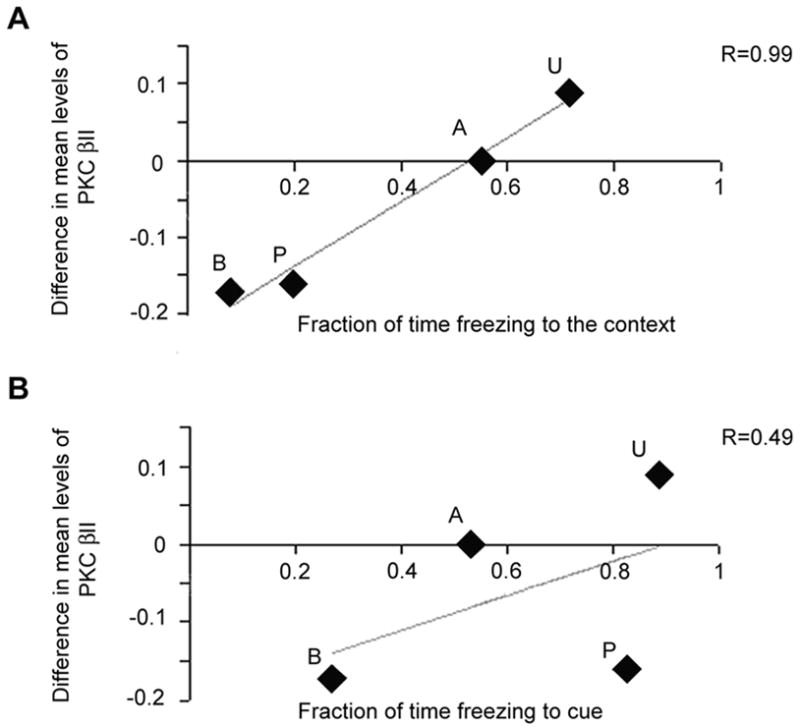
Figure 5.

Correlation of freezing to cue and context with biochemical changes. Plots of the biochemical difference measures (ordinates) against the mean fraction of time freezing to either context or cue (abscissa in each plot). A: relation of biochemical changes to context freezing behavior. Simple linear regression line plotted and R value (0.99). Pearson correlation analyses (significant for biochemistry vs. context) in the text. B: relation of biochemical changes to cue freezing behavior. The R value from the linear regression analysis is much less (0.49) and the Pearson correlation analysis is not significant. Letters associated with each plotted point indicate the conditioning group: B=box alone, P=paired tone/shock, U=unpaired tones and shocks, and A=alternating tones and shocks.
