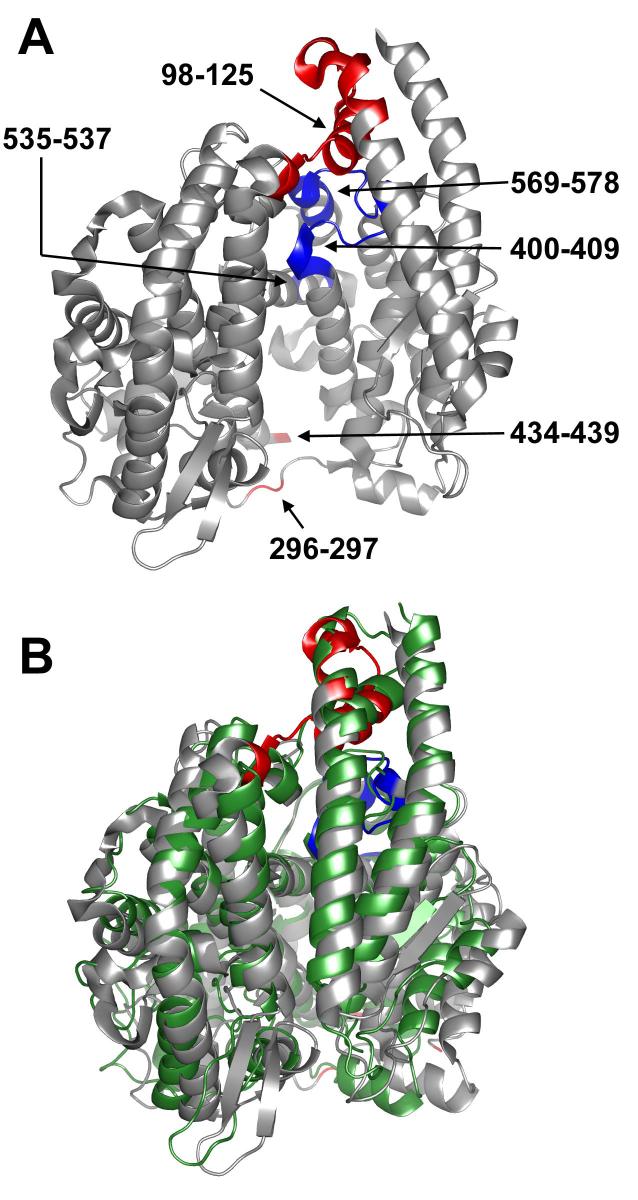
Figure 3.
Hinging in the open model of tACE. A) The open model of tACE (tACEo) used for normal mode analysis, showing ACE2 hinge residue equivalents. Hinge regions with low temperature factors and high sequence-conservation (400-409, 535-537, 569-578) are coloured blue; those with high temperature factors and low sequence-conservation (98-125, 296-297, 434-439) are coloured red. Note that S435-G438 were omitted from the model, as they were absent in the wild-type tACE structure. Deletion of the equivalent residues in ACE2 had no effect on the modes calculated (data not shown). B) Alignment of the tACEo model perturbed in the direction of the lowest-frequency normal mode calculated (grey) with wild-type tACE (green). The amplitude of perturbation chosen is that which generated the best fit to the closed structure. Hinge residues in tACEo are coloured as for A. This figure was generated using PYMOL 0.98 (DeLano Scientific).

