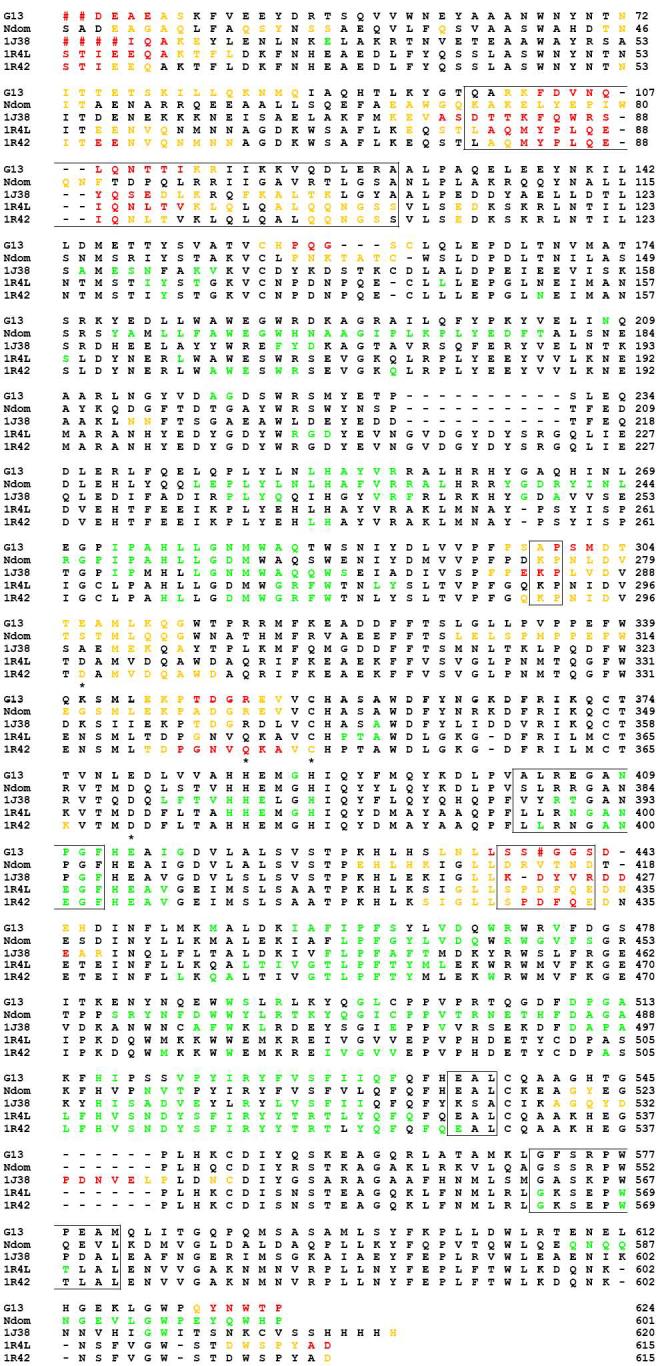
Figure 4.

Temperature factor (B-factor) and sequence comparison between tACE-G13 (G13), the N domain of human sACE (Ndom, 2C6N), Drosophila AnCE (1J38) and the open (1R42) and closed (1R4L) structures of ACE2. Red hashes represent residues that were not modeled in the crystal structures due to disorder. Residues are coloured according to their temperature factors: ORANGE: B-factors greater than σ(B); RED: B-factors greater than 2σ(B); GREEN: B-factors less than -σ(B). Hinge regions in ACE2 are boxed; zinc ligands are marked with stars.
