Abstract
Background
With the increased availability of high throughput data, such as DNA microarray data, researchers are capable of producing large amounts of biological data. During the analysis of such data often there is the need to further explore the similarity of genes not only with respect to their expression, but also with respect to their functional annotation which can be obtained from Gene Ontology (GO).
Results
We present the freely available software package GOSim, which allows to calculate the functional similarity of genes based on various information theoretic similarity concepts for GO terms. GOSim extends existing tools by providing additional lately developed functional similarity measures for genes. These can e.g. be used to cluster genes according to their biological function. Vice versa, they can also be used to evaluate the homogeneity of a given grouping of genes with respect to their GO annotation. GOSim hence provides the researcher with a flexible and powerful tool to combine knowledge stored in GO with experimental data. It can be seen as complementary to other tools that, for instance, search for significantly overrepresented GO terms within a given group of genes.
Conclusion
GOSim is implemented as a package for the statistical computing environment R and is distributed under GPL within the CRAN project.
Background
Modern DNA microarray analysis has lead to an enormous collection of experimental data. Different analysis techniques are applied to gain insight into the underlying biological processes: statistical tests are used to find significantly regulated genes. Other methods cluster genes according to their expression profiles [1]. The hypothesis is that genes with expression patterns similar to known genes are involved in similar biological processes. In either case, researchers often end up with long lists of interesting candidate genes that need further examination. At this point, a second step is almost always applied: biologists categorize these genes to known biological functions and thus try to combine experimental outcomes with biological knowledge. Such information is e.g. provided by Gene Ontology (GO). GO has become one of the most widespread systems for systematically annotating gene products within the bioinformatics community and is developed by the Gene Ontology Consortium [2] with the intention to describe gene products with a controlled and structured vocabulary. GO terms are part of a Directed Acyclic Graph (DAG), covering three orthogonal taxonomies: molecular function, biological process and cellular component. Two different kinds of relationship between GO terms exist: the "is-a" relationship and the "part-of" relationship. By providing a standard vocabulary for all biological resources, GO enables researchers to use this information for further data analysis.
The GOSim package provides the user with an easy to use implementation of various information theoretical similarity concepts for GO terms [3-9]. It additionally implements different methods for computing functional similarities between gene products based on the similarities between the associated GO terms. This can for example be used for clustering genes according to their biological function [10,11] and thus may help to get a better understanding of the biological aspects covered by a set of genes. GOSim can be seen as complementary to existing tools that, for instance, search for significantly overrepresented GO terms within a given group of genes [12]. It extends methods like FuSSiMeg [8] by offering additional similarity measures for GO terms and gene products. With its specific focus, to our knowledge, GOSim is the most comprehensive software package of this kind.
Methods
GO term similarities
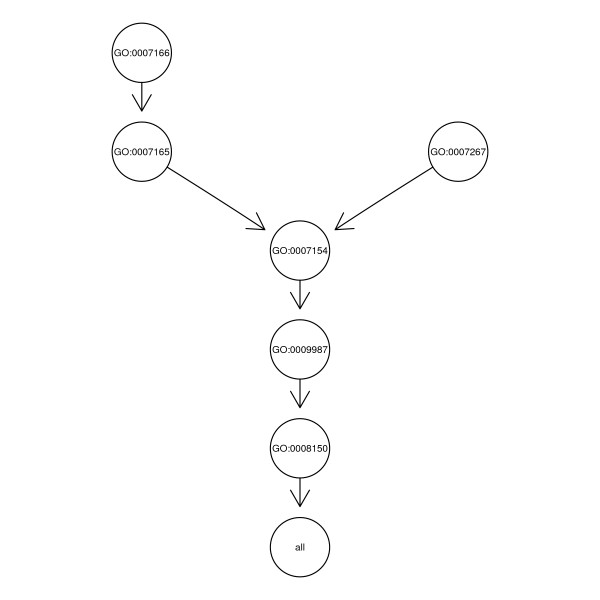
GOSim concentrates on similarity concepts for GO terms derived from information theory. One of the most well-known information theoretic similarity measures was introduced by Resnik [3]. It relies on the notion of the so-called minimum subsumer of two GO terms t and t', which is the lowest common ancestor in the GO hierarchy (Figure 1). Its information content ICms, which can be understood as a measure of similarity between t and t', is given by:
Figure 1.
Example of a GO graph starting with leaves GO:0007166 and GO:0007267.
Here Pa(t, t') denotes the set of all common (also indirect) ancestors of GO terms t and t', while IC(t) denotes the information content of term t. It is defined as (c.f. [7])
| IC(t) = -log P(t) |
i.e. as the negative logarithm of the probability of observing t. The information content of each GO term can be computed with GOSim for each of the taxonomies molecular function, biological process and cellular component. The calculation is based on counting, how many times a specific GO term or any of its direct or indirect offspring appear in annotated gene products. The association between gene products and GO identifiers is reported regularly by the GO Consortium [2]. The GO Consortium further provides evidence codes on the annotations, which can be used to calculate the information contents of all GO terms on a different basis. GOSim stores the information contents of all GO terms in data files to speed up all following computations. By default, for some combinations of evidence codes the information contents are already precomputed.
Besides Resnik's GO term similarity measure, extensions of Lin [5], and Jiang and Conrath [6] exist, which are included into GOSim as well. Both only differ in the way they normalize (Eq. 1). Jiang and Conrath's similarity measure is defined as
| sim(t, t') = 1 - min(1, IC(t) - 2ICms(t, t') + IC(t')) |
i.e. the similarity between t and t' is 0, if their normalized distance is at least 1. Lin's pairwise similarity between GO terms is defined as:
GOSim also contains a similarity concept introduced by Couto et al. [9], which is not based on the minimum subsumer, but on the set of all so-called disjunctive common ancestors. Roughly speaking, the idea is not to consider the common ancestor having the highest information content only, but also others, if they are somehow "separate" from each other, i.e. there is a path to t and t' not passing any other of the disjunctive common ancestors. In our example from Figure 1 the set of disjunctive common ancestors only consists of the minimum subsumer, because any path from the other ancestors to GO:0007166 and GO:0007267 would have to pass the minimum subsumer. Based on the notion of disjunctive common ancestors Resnik's similarity concept can be extended by defining:
Likewise, Jiang-Conraths's and Lin's measures can be extended as well by replacing ICms(t, t') by ICshare(t, t'). Finally, it should be mentioned that also the depth and density enriched term similarity by Couto et al. [8] has been integrated into GOSim.
Functional gene similarities
The special strength of GOSim lies in the possibility not only to calculate similarities for individual GO terms, but also for genes based on their complete GO annotation. For this purpose three basic ideas have been implemented:
1. Computation of the maximum and average similarity between any pair of GO terms.
2. Computation of a so-called optimal assignment of terms from one gene to those of another one [11].
3. Embedding of each gene into a feature space defined by the gene's similarity to certain prototype genes [10,11]. Within this feature space similarities naturally arise as dot products between the feature vectors. These dot products can be understood as so-called kernel functions, as used e.g. in Support Vector Machines [13].
Especially the inclusion of the last two methods clearly distinguishes GOSim from existing tools like FuSSiMeg [8]. More information on these methods, including a detailed evaluation, can also be found in our earlier publications [10] and [11].
Maximum and average pairwise GO term similarity
The idea of the maximum pairwise GO term similarity is straight forward and is for instance employed in FuSSiMeg [8]. Given two genes g and g' annotated with GO terms t1,..., tn and we define the functional similarity between between g and g' as
where sim is some similarity measure to compare GO terms ti and . In GOSim the resulting value can be further normalized to account for an unequal number of GO terms for both genes:
Instead of computing the maximum pairwise GO term similarity one may also take the average here.
Optimal assignment gene similarities
Given a similarity concept sim to compare individual GO terms, the idea of an optimal assignment is to assign each term of the gene having fewer GO terms to exactly one term of the other gene such that the overall similarity is maximized (c.f. Figure 2). More formally this can be stated as follows: Let π be some permutation of either an n-subset of natural numbers {1,..., m} or an m-subset of natural numbers {1,..., n} (this will be clear from context). Then we are looking for the quantity
Figure 2.
Idea of an optimal assignment: each GO term belonging to gene 2 is assigned to exactly one GO term belonging to gene 1 such that the overall GO term similarity is maximized.
The computation of (Eq. 8) corresponds to the solution of the classical maximum weighted bipartite matching (optimal assignment) problem in graph theory and can be carried out in O(max(n, m)3) time [14]. To prevent that larger lists of terms automatically achieve a higher similarity we should again normalize simgene according to (Eq. 7).
Feature space embedding of gene products
The idea of this method is to calculate for each gene g feature vectors φ(g) by using their similarity to certain prototype genes p1,..., pn:
| φ(g) = (sim'(g, p1),..., sim'(g, pn))T |
By default the 250 best annotated genes, i.e. which have been annotated with GO terms most often, are used as prototypes, and sim' is the maximum pairwise GO term similarity. Alternatively, one can use the optimal assignment similarity for sim' as well. Both similarity measures can by itself again be combined with arbitrary GO term similarity concepts. The default is that of Jiang and Conrath.
Feature space constructions like in (Eq. 9) are known from the literature on Support Vector Machines and other kernel methods and give rise to so-called "empirical kernel maps" [13].
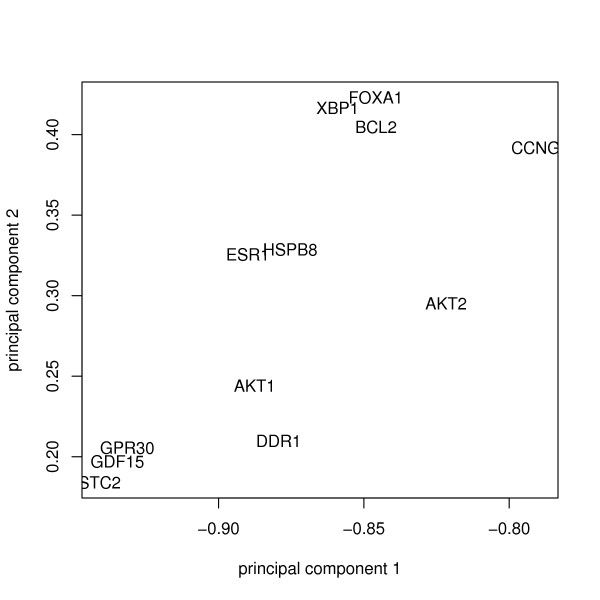
Because the feature vectors are very high-dimensional we usually perform a principal component analysis (PCA) to project the data into a lower dimensional subspace (Figure 3). The number of principal components is by default chosen such that at least 95% of the total variance in feature space can be explained (this is a relatively conservatve criterion), and the feature vectors are normalized to norm 1. It should be mentioned that in principle one can combine functional similarities between gene products with regard to different GO sub-categories ("biological process", "molecular function", "cellular component"). An obvious way for doing so would be to consider the sum of the respective similarities:
Figure 3.
Genes embedded into a feature space defined by the GO similarity to certain prototype genes. principal components analysis was used to reduce the dimensionality of the feature space and the first two principal components are displayed.
| simtotal(g, g') = simOntology1(g, g') + simOntology2(g, g') |
Of course, one could also use a weighted averaging scheme here, if desired.
Functional gene clustering
The calculated GO similarities between gene products can be used to cluster genes with respect to their function. The practical usage of this method is highlighted in more detail in an example study on microarray data in the Results Section of this paper.
Cluster evaluations
GOSim has the possibility to evaluate a given clustering of genes or terms by means of their GO similarities. Supposed we have decided to group genes into certain clusters on the basis of other experiments (e.g. microarray). Then we can ask ourselves, how similar these groups are with respect to their GO annotations. GOSim uses the functional similarity between genes to calculate for each cluster the median within cluster similarity and the median absolute deviation (mad). Moreover, a visualization via cluster silhouettes [15] is provided by GOSim as well. Likewise, different groupings of GO terms can be evaluated in a similar manner. Again, the practical usage of this method is highlighted in more detail in the example study contained in the Results Section.
Implementation
GOSim is implemented as a package within the statistical computing environment R and is distributed under GPL within the CRAN project [16]. Functions of the following R packages are internally utilized and are hence required by GOSim to work properly:
• GOStats (≥ 1.7)
• mclust (≥ 2.1)
• cluster (≥ 1.11)
Furthermore, Rgraphviz is recommended to visualize GO graphs. To calculate functional similarities between gene products GOSim needs their Entrez Gene IDs. The mapping of these IDs to the Gene Ontology is provided by the R package GO, which is required by the GOStats package. Genes without annotation are filtered out automatically, when GOSim performs similarity calculations for gene products. Their exists a function in GOSim to specify, on which sub-category ("biological process", "molecular function", "cellular component") all computations are based on. Moreover, it is possible to restrict the GO annotation of gene products to arbitrary user defined evidence codes.
To summarize, GOSim provides R-methods for the following tasks:
• low-level functions for GO graph traversal
• specification of the GO sub-category ("biological process", "molecular function", "cellular component") and of evidence codes
• calculation of the information content of GO terms and of the similarity between GO terms (see last Section)
• similarity calculation between gene products based on their GO annotations (see last Section)
• filtering and printing the GO annotation of a given list of genes
• evaluation of a given clustering of genes or terms via precomputed similarities (see last Section)
Results
Data
In this Section we show an example application of the GOSim package to an analysis of DNA microarray data. The data was taken from [17], who derived a gene expression profile for dilated cardiomyopathy based on cDNA and Affymetrix microarray chips. The details of this study can be found in the paper. The number of differentially upregulated genes was 1107 on the cDNA and 336 on the Affymetrix microarray data. The number of differentially downregulated genes was 278 on the cDNA and 67 on the Affymetrix chips.
Methods
The Entrez Gene IDs of differentially upregulated and downregulated genes collected from the study were treated separately for cDNA and Affymetrix chips. 677 of the differentially upregulated genes on the cDNA chips and 230 on the Affymetrix chips showed a mapping to the GO category "biological process". 157 differentially downregulated genes could be mapped on the cDNA and 43 on the Affymetrix chips. We used the GOSim package to calculate gene similarities based on the feature vector representation [10,11] (c.f. Section Background). This was done by defining each gene by its maximum Jiang-Conrath similarity [6] to 250 prototypes genes. Prototype genes were those 250 genes, which were most frequently annotated with GO terms. The similarity between feature vectors x, y was taken as their normalized dot product (c.f. Section Background):
Prior to similarity calculation we performed a principal component analysis (PCA) on the feature vectors to reduce their dimensionality. The number of principal components was chosen such that at least 95% of the total variance in feature space could be explained (c.f. Section "Feature Space Embedding of Gene Products"). This way we obtained 29 principal components for the upregulated and 23 principal components for the downregulated genes on the cDNA chips. For the Affymetrix chips the number of principal components was 24 for the upregulated and 11 for the downregulated genes.
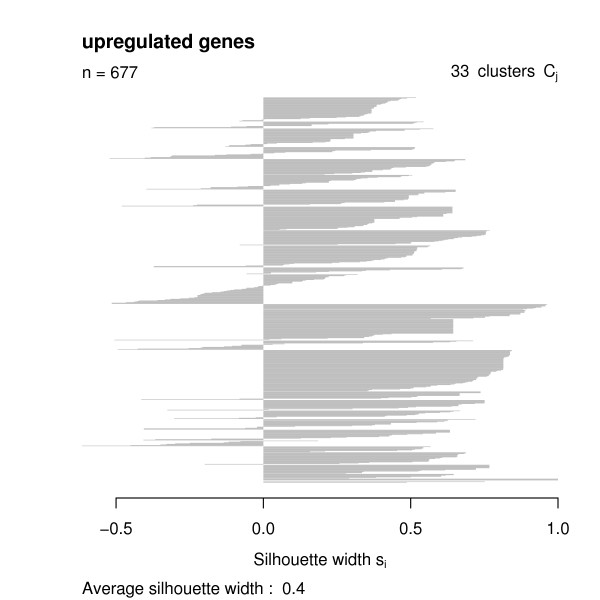
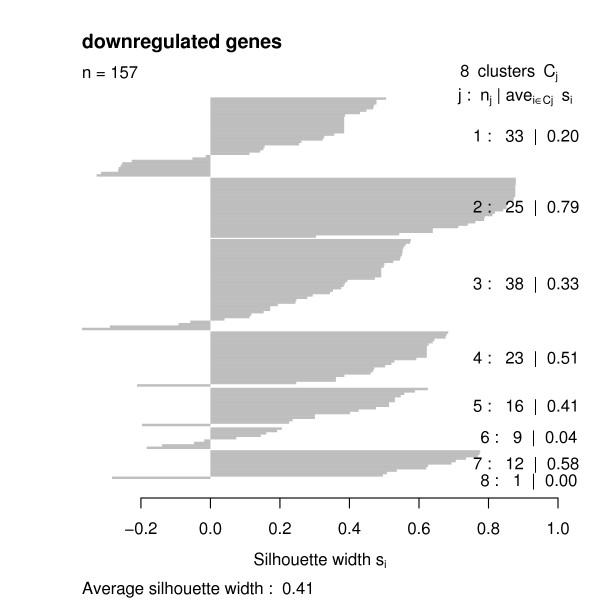
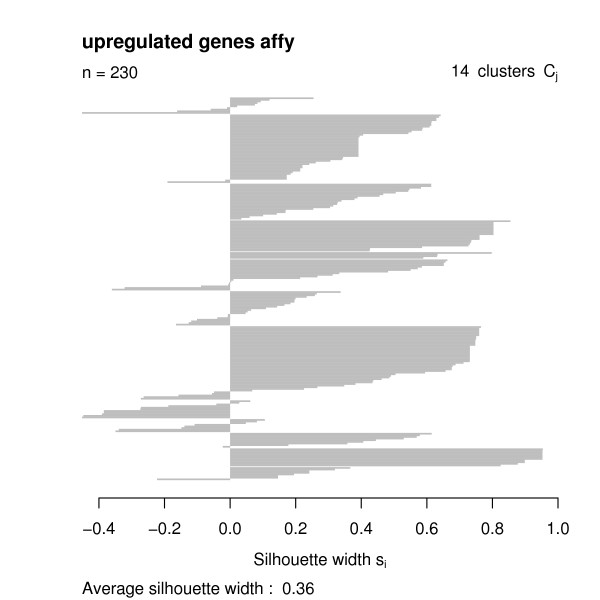
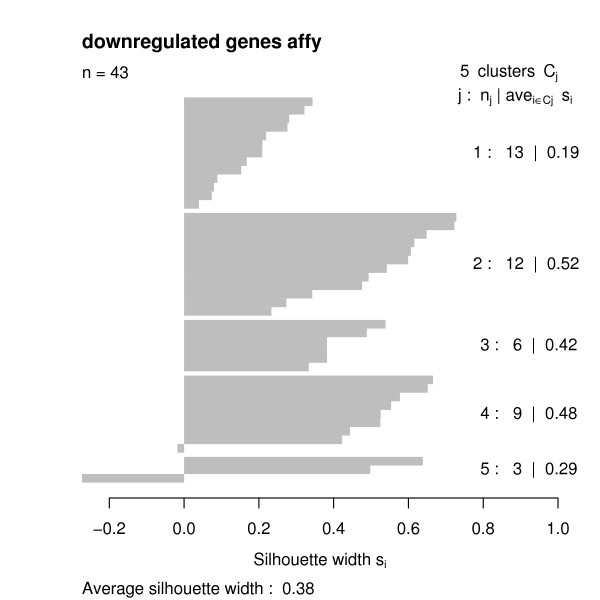
Having the functional similarities between regulated genes, we used the GOSim package to compute a hierarchical clustering using Ward's method. We decided to cut the clustering tree at height 0.05 and looked at the clustering silhouettes by employing the GOSim package (Figures 4, 5, 6, 7). Cluster silhouettes [15] are a classical way of depicting the quality of a given clustering of objects. The silhouette value for each point in a cluster is a measure of how similar that point is to points in its own cluster vs. points in other clusters, and ranges from -1 to +1. It is defined as:
Figure 4.
Clustering silhouette of the upregulated genes (cDNA chips).
Figure 5.
Clustering silhouette of the downregulated genes (cDNA chips).
Figure 6.
Clustering silhouette of the upregulated genes (Affymetrix chips).
Figure 7.
Clustering silhouette of the downregulated genes (Affymetrix chips).
where W(i) is the average distance from the i-th point to the other points in its own cluster, and B(i, j) is the average distance from the i-th point to points in another cluster j. The quality for a given cluster can effectively be expressed by the average silhouette value (= cluster silhouette index) of points belonging to that specific cluster.
Analysis results
The clustering silhouettes for up- and downregulated genes show that there exists several functional groups with silhouette cluster index greater 0.5 (upregulated genes in clusters 9, 13, 14, 15, 16, 18, 20, 23, 28, 29, 30, 31, 33 on the cDNA platform, upregulated genes in clusters 4, 5, 8, 12 on the Affymetrix platform, downregulated genes in clusters 2, 4, 7 on the cDNA chips, downregulated genes in cluster 2 on the Affymetrix platform – c.f. Table 1). Upregulated genes on the cDNA chips are involved into various forms of transport (clusters 9, 13), into the intracellular signaling cascade (cluster 13), cell adhesion (cluster 14), transcription (clusters 15, 18), signal transduction (cluster 15), cytoskeleton organization and biogenesis (cluster 16), immune response (cluster 20), catabolism (cluster 23), protein localization (cluster 28), protein modification (cluster 29), chromatin assembly or disassembly (cluster 30), mitochondrial electron transport (cluster 31) and fibroblast growth factor receptor signaling pathway (cluster 33). Upregulated genes on the Affymetrix chips are involved into metabolism and transport (cluster 4) blood coagulation and immune response (cluster 5), transcription (cluster 8) and cell adhesion (cluster 12).
Table 1.
Functional groups found on the different chip platforms.
| Clust. no. | Clust. size | sil. ind. | platform | regulation | function |
| 9 | 27 | 0.62 | cDNA | up | transport |
| 13 | 10 | 0.93 | cDNA | up | intracellular signaling cascade, protein transport |
| 14 | 16 | 0.82 | cDNA | up | cell adhesion |
| 15 | 38 | 0.51 | cDNA | up | transcription, signal transduction |
| 16 | 5 | 0.58 | cDNA | up | cytoskeleton organization and biogenesis, behavior |
| 18 | 74 | 0.74 | cDNA | up | transcription |
| 20 | 15 | 0.67 | cDNA | up | immune response |
| 23 | 2 | 0.67 | cDNA | up | catabolism |
| 28 | 22 | 0.54 | cDNA | up | protein localization |
| 29 | 16 | 0.61 | cDNA | up | protein modification |
| 30 | 8 | 0.54 | cDNA | up | chromatin assembly or disassembly, protein complex assembly |
| 31 | 2 | 1.0 | cDNA | up | mitochondrial electron transport, NADH to ubiquinone |
| 33 | 2 | 0.62 | cDNA | up | fibroblast growth factor receptor signaling pathway |
| 2 | 25 | 0.79 | cDNA | down | transcription |
| 4 | 23 | 0.51 | cDNA | down | transport |
| 7 | 12 | 0.58 | cDNA | down | immune response |
| 4 | 19 | 0.73 | Affymetrix | up | metabolism, transport |
| 5 | 4 | 0.66 | Affymetrix | up | blood coagulation, immune response |
| 8 | 45 | 0.54 | Affymetrix | up | transcription |
| 12 | 11 | 0.92 | Affymetrix | up | cell adhesion |
| 2 | 12 | 0.52 | Affymetrix | down | metabolism |
In contrast, downregulated genes on the cDNA chips are involved into transcription (cluster 2), transport (cluster 4) and immune response (cluster 7). On the Affymetrix chips there is just one identifiable cluster of downregulated genes are involved into metabolism.
The whole clusters are also included in an additional supplement as text files. In conclusion of this analysis one could say that in this data upregulated genes are more involved in protein modification, protein localization, blood coagulation and cell adhesion while downregulated genes are more related to metabolic tasks.
These findings can be seen complementary to those by Bart et al., who found a significant enrichment of GO terms related to protein biosynthesis in upregulated and GO terms related to immune response in downregulated genes. Both results are based on different statistical analysis methods of the data. Functional gene clustering is based on comparing the full GO term profiles for genes of interest, while GO-significance analysis looks for the statistical over-representation of individual GO terms in the full list of regulated genes. An advantage of a functional gene clustering compared to a traditional GO-significance analysis is that the complete list of regulated genes is structured into functionally related groups, which can help later interpretation. This kind of analysis is possible for very large as well as for very small lists. On the other hand functional clusters may also contain several genes, which are regarded as statistical significant, but are actually not differentially expressed (false positives). Hence, the interpretation of small functional clusters should generally be taken with care.
Discussion
The GOSim package offers an easy and straight forward way to gain insights into functional gene groups by using the Gene Ontology. It offers a rich toolbox of similarity concepts for GO terms as well as for gene products. The present example study highlights the usefulness of GOSim in a real life scenario.
Conclusion
The GOSim package integrates information theoretic similarity concepts for GO terms and derived functional similarity measures for gene products in a novel and unique way. Applications thereof are clusterings of gene products with regard to their function [10,11] or scorings of a given grouping of genes or terms with regard to their GO similarities. Both tasks can be performed with GOSim in a simple and straight forward way. It hence provides the user with a flexible and powerful tool to combine biological knowledge with experimental data. GOSim systematically extends existing tools like FuSSiMeg [8] by integrating its functionality and providing additional similarity concepts for gene products [10,11]. GOSim is implemented as a package for the statistical computing environment R and has been integrated into the CRAN project. It is thus made available for a broad community of potential users. More documentation on the implemented methods can be found in the user manual. Detailed quantitative results can be found in [8-11].
Availability and requirements
• Project name: GOSim
• Project home page: http://www.dkfz.de/mga2/gosim
• Operating system(s): platform independent
• Programming language: R
• License: GPL
The software is also included as a supplement to this paper.
Authors' contributions
The feature space embedding and the optimal assignment similarity were invented by HF and NS. The R-implementation of GOSim was carried out by HF. Substantial advice and suggestions were given by TB and AP. All authors read and approved the final manuscript.
Supplementary Material
Clustering results. Clustering results for the example study in the Results Section.
GOSim version 1.0. The GOSim software package.
Acknowledgments
Acknowledgements
TB and HF were supported by the National Genome Research Network (NGFN) of the German Federal Ministry for Education and Research (BMBF) – grants PBF-S19T10, PBF-S02T11, EP-S19T03. We thank Dirk Ledwinda for IT support. We thank Holger Sültmann, Andreas Buness and Markus Ruschhaupt for help and discussions, and Ruprecht Kuner for providing us with the microarray dataset.
Contributor Information
Holger Fröhlich, Email: h.froehlich@dkfz.de.
Nora Speer, Email: nora.speer@uni-tuebingen.de.
Annemarie Poustka, Email: a.poustka@dkfz-heidelberg.de.
Tim Beißbarth, Email: t.beissbarth@dkfz-heidelberg.de.
References
- Eisen M, Spellman P, Botstein D, Brown P. Cluster Analysis and Display of Genome-wide Expression Patterns. Proceedings of the National Academy of Sciences, USA. 1998;95:14863–14867. doi: 10.1073/pnas.95.25.14863. [DOI] [PMC free article] [PubMed] [Google Scholar]
- The Gene Ontology Consortium The Gene Ontology (GO) database and informatics resource. Nucleic Acids Research. 2004;32:D258–D261. doi: 10.1093/nar/gkh036. [DOI] [PMC free article] [PubMed] [Google Scholar]
- Resnik P. Using Information Content to Evaluate Semantic Similarity in a Taxonomy. Proceedings of the 14th International Joint Conference on Artificial Intelligence, Montreal. 1995;1:448–453. [Google Scholar]
- Resnik P. Semantic Similarity in a Taxonomy: An information-based measure and its application to problems of ambigiguity in natural language. Journal of Artificial Intelligence Research. 1999;11:95–130. [Google Scholar]
- Lin D. An information-theoretic definition of similarity. In: Kaufmann M, editor. Proceedings of the 15th International Conference on Machine Learning, San Francisco, CA. Vol. 1. 1998. pp. 296–304. [Google Scholar]
- Jiang J, Conrath D. Semantic similarity based on corpus statistics and lexical taxonomy. Proceedings of the International Conference on Research in Computational Linguistics, Taiwan. 1998.
- Lord P, Stevens R, Brass A, Goble C. Semantic Similarity Measures as Tools for Exploring the Gene Ontology. Proceedings of the Pacific Symposium on Biocomputing. 2003. pp. 601–612. [DOI] [PubMed]
- Couto F, Silva M, Coutinho P. Tech Rep DI/FCUL TR 03-29. Department of Informatics, University of Lisbon; 2003. Implementation of a Functional Semantic Similarity Measure between Gene-Products. [Google Scholar]
- Couto F, Silva M, Coutinho P. Semantic Similarity over the Gene Ontology: Family Correlation and Selecting Disjunctive Ancestors. Conference in Information and Knowledge Management. 2005.
- Speer N, Fröhlich H, Spieth C, Zell A. Functional Grouping of Genes Using Spectral Clustering and Gene Ontology. Proc Int Joint Conf Neural Networks. 2005. pp. 298–303.
- Fröhlich H, Speer N, Zell A. Kernel Based Functional Gene Grouping. Proc Int Joint Conf Neural Networks. 2006. pp. 6886–6891.
- Beissbarth T, Speed T. GOstat: finding statistically overexpressed Gene Ontologies within groups of genes. Bioinformatics. 2004;20:1464–1465. doi: 10.1093/bioinformatics/bth088. [DOI] [PubMed] [Google Scholar]
- Schölkopf B, Smola AJ. Learning with Kernels. Cambridge, MA: MIT Press; 2002. [Google Scholar]
- Mehlhorn K, Näher S. The LEDA Platform of Combinatorial and Geometric Computing. Cambridge University Press; 1999. [Google Scholar]
- Rousseeuw P. Silhouettes: a graphical aid to the interpretation and validation of cluster analysis. J Comp and Applied Mathematics. 1987;20:53–65. doi: 10.1016/0377-0427(87)90125-7. [DOI] [Google Scholar]
- CRAN project http://www.r-project.org
- Barth AS, Kuner R, Buness A, Ruschhaupt M, Merk S, Zwermann L, Kääb S, Kreuzer E, Steinbeck G, Mansmann U, Poustka A, Nabauer M, Sültmann H. Identification of a Common Gene Expression Signature in Dilated Cardiomyopathy Across Independent Microarray Studies. Journal of the American College of Cardiology. 2006;48 doi: 10.1016/j.jacc.2006.07.026. [DOI] [PubMed] [Google Scholar]
Associated Data
This section collects any data citations, data availability statements, or supplementary materials included in this article.
Supplementary Materials
Clustering results. Clustering results for the example study in the Results Section.
GOSim version 1.0. The GOSim software package.


