

Abstract
In vivo magnetic resonance spectroscopy (MRS) enables non-invasive longitudinal tracking of brain chemistry changes that can accompany aging, neurodegenerative disease, drug addiction and experimental manipulations in animals modeling such conditions. J-coupled resonances, such as glutamate, which are highly relevant to neuropsychiatric conditions are difficult to resolve on a clinical 3T MR scanner using conventional one-dimensional MRS sequences. We, therefore, implemented Constant Time PRESS (CT-PRESS) to quantify major metabolite and neurotransmitter biochemical signals, including glutamate, in two brain regions of the rat—basal ganglia and cerebellum. We acquired spectra at two distinct time points in two independent groups of six rats and analyzed metabolite levels using either creatine or water as a reference. Our results provide evidence that CT-PRESS at 3T is adequate and reliable for in vivo detection and quantification of glutamate in the rat brain and that regional differences occur in the signal intensities of the major metabolites. That the directionality of the differences depends on whether creatine or water is used as a reference for metabolite levels emphasizes the benefit to in vivo MRS of incorporating methods to establish absolute baseline metabolite concentrations.
Keywords: MRS, glutamate, single-voxel, in vivo, rat, CT-PRESS
1. Introduction
In vivo magnetic resonance spectroscopy (MRS) permits non-invasive longitudinal tracking of brain chemistry changes that can accompany aging, neurodegenerative disease, drug addiction and experimental manipulations in animals modeling such conditions (Adalsteinsson, et al., 2006; De Stefano, et al., 1998; Filippi, et al., 1999; Pfefferbaum, et al., 2006). While MRS has proven invaluable as an in vivo assessment tool, there have been technical limitations to overcome. For example, the direct in vivo detection of the neurotransmitter glutamate (Glu) at a field strength of 3T has been challenging because of spectral overlap with signals from other metabolites, most notably, glutamine (Gln). Indeed, the detection of Glu is hampered by a complicated multiplet structure due to strong J-coupling. Another limitation has been that brain chemistry changes are most often expressed as metabolite ratios, which although useful, can lead to ambiguous interpretation of data.
In vivo MRS studies have revealed reduced N-acetyl-aspartate (NAA), inferred from NAA/creatine (Cr) ratios, in frontal (Bendszus, et al., 2001; Fein, et al., 1994; Jagannathan, et al., 1996; O’Neill, et al., 2001) and cerebellar (Bendszus, et al., 2001; Jagannathan, et al., 1996; Mann, et al., 1998; Parks, et al., 2002) regions in alcoholics compared with controls. Fewer in vivo studies have been conducted in animal models of alcoholism, but those, too, indicate the sensitivity of NAA to the detection of tissue compromise induced by alcohol plus nutritional deficiency (Pfefferbaum, et al., 2006). In addition to NAA, Glu is of particular interest in studies of alcoholism (Kalivas, et al., 2005). In vitro electrophysiology, radioligand binding (Morrisett, et al., 1991; Snell, et al., 1993) and in vivo microdialysis (Moghaddam and Bolinao, 1994) studies have implicated the glutamatergic system in the development and maintenance of ethanol dependence and withdrawal from it. Preliminary MRS findings suggest a role for Glu in response to acute intraperitoneal alcohol infusion in rats (Adalsteinsson, et al., 2006).
Constant Time PRESS (CT-PRESS) (Dreher and Leibfritz, 1999) was introduced as an in vivo method to detect J-coupled resonances with high signal-to-noise ratio (SNR) by using effective homonuclear decoupling. Here, we tested the feasibility of using CT-PRESS optimized for the detection of Glu (Mayer and Spielman, 2005) in the rat to dissociate the biochemical profile of two brain regions affected in alcohol dependence (Koob, 1999; Sullivan, et al., 2003; Sullivan and Pfefferbaum, 2005). Based on the hypotheses that the development of alcohol dependence is mediated by basal ganglia circuitry (Koob, 1999), whereas maintenance of alcohol addiction entails changes in frontocerebellar circuitry (Sullivan, et al., 2003; Sullivan and Pfefferbaum, 2005), we choose to establish baseline levels of major metabolites and neurotransmitters in the basal ganglia and the cerebellum. Analysis of our results using either creatine (Cr) or water as a reference suggest that care must be taken when interpreting data using Cr as an internal standard.
2. Methods
2.1 Subjects
Two groups of six healthy male adult Wistar rats (Harlen, Indiana), ranging in weight from 395 to 525 g, were examined. Approval was granted from SRI and Stanford University review boards to conduct in vivo MR imaging studies.
2.2 Anesthesia
As previously described (Adalsteinsson, et al., 2004; Pfefferbaum, et al., 2004), the animals were held in an MR-invisible structure, which provided support for the radio frequency (RF) coil and a nose cone for the delivery of isoflurane anesthesia (2–3.5%) and oxygen (~1.5 l/min). Rectal temperature and oxygen saturation from the hind limb were monitored throughout the experiment. Heating was provided by pre-warmed bags of saline solution placed under the animal tray. Rats were scanned in sessions of ~1.5 h each.
2.3 MRS acquisition
All measurements were performed on a GE 3T MR scanner equipped with self-shielded gradients (40 mT/m, 150 mT/m/ms). A custom-made rat brain quadrature head coil (Ø = 44 mm) was used for both RF excitation and signal reception.
The implemented CT-PRESS sequence consisted of a modified PRESS module in which the position of the last refocusing pulse was shifted to encode the chemical shift (CS) in the second time dimension (t1). The pulse was shifted in 129 steps with an increment Δt1/2 = 0.8 ms corresponding to a spectral width (SW1) of 625 Hz in f1. The average echo time (TE) of the sequence was 139 ms, optimized for the detection of Glu. To increase the SNR, the data acquisition (2K complex points at SW2 = 5000 Hz) started immediately after the last crusher gradient of the second refocusing pulse. CT-PRESS was preceded by a 3-pulse chemical shift selective sequence for water suppression and an outer-volume suppression module using very selective saturation pulses. The repetition time (TR) was 2 s and 4 excitations were performed without data acquisition to achieve a steady state. With 6 averages, the acquisition time (Tacq) per spectrum was ~ 27 min. For the second group of rats an acquisition without water suppression was carried out with 17 CS encoding steps (Δt1/2 = 6.4 ms, 8-fold undersampling) and 2 averages (Tacq = 1:16 min) to measure the tissue water content which was used to normalize the signal intensities of the metabolite data.
For each rat, spectra were acquired from two voxels, placed in the basal ganglia and the cerebellum (Figure 1); the order of voxel acquisition was balanced across the rats. The voxel dimensions were 8.6 mm (L/R), 5 mm (A/P), and 4.8 mm (S/I). The voxels were positioned using high-resolution images acquired with a 3-plane localizer (gradient recalled echo (GRE), TE/TR = 2.3/9.8 ms, FOV = 6×6 cm2, 256×128, 5 mm thick, 3 slices/plane) and coronal fast spin-echo (FSE, TE1/TE2/TR = 12.5/62.6/3000 ms, FOV = 8×4 cm2, 256×128, 1 mm thick). The scanning parameters were slightly modified for the second experiment (GRE: TE/TR = 1.6/6.7 ms, FSE: TE1/TE2/TR = 12.7/63.7/3900 ms). In the A/P direction, the basal ganglia voxel extended from approximately 2.3 to −2.6 mm and the cerebellar voxel from approximately −9.2 to −14.2 mm, relative to bregma, according to the rat brain atlas of Paxinos and Watson (Paxinos and Watson, 2004). The basal ganglia voxel included the striatum, nucleus accumbens, globus pallidus, anterior portions of the thalamus and hippocampus, relevant midline structures and small sections of the corpus callosum and lateral ventricles. The cerebellar voxel contained mostly the cerebellum and fragments of other structures such as visual cortex and pons.
Figure 1.
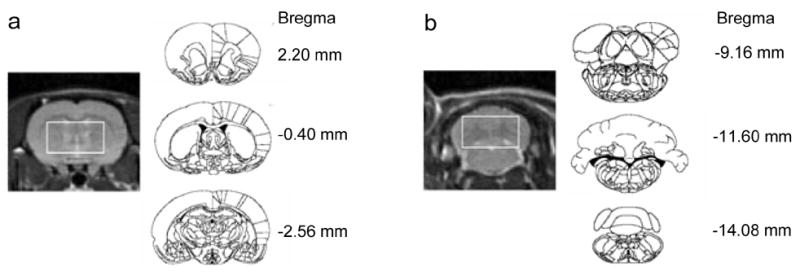
(a) Basal ganglia and (b) cerebellar voxel placement. To the left are coronal FSE images from the center of each voxel from which spectra were acquired. To the right are the first (top), center (middle) and last (bottom) coronal slices included in each voxel (from the atlas of Paxinos and Watson).
2.4 Data Analysis
The amount of tissue water in a voxel was estimated from the data set acquired without water suppression. For each CS encoding step, i.e., for each TE step, only the time domain data from the time of the echo on was used. The data were apodized in t2 with a 5-Hz Gaussian line broadening and zero-filled up to 4096 points. The data for each TE step were phase-corrected by removing the zero and first order phase as estimated by linear regression for the first 100 points. After performing a fast Fourier transform (FFT) along t2, the water spectra were evaluated by peak integration with an interval of ±50 Hz. The amount of cerebral spinal fluid (CSF) and tissue water was estimated by fitting the data across the 17 TEs to a bi-exponential model. To improve numerical stability of the nonlinear fit, the CSF T2 was fixed at a long T2 value of 500 ms and the remaining short T2 component of tissue determined from a minimization search (Pfefferbaum, et al., 2006).
Apodization of the water-suppressed data comprised multiplication with sine-bell functions in both time dimensions and zero-filling up to 4K×1K data points. A t1-dependent shift was applied in t2 correcting for the different start of data acquisition. After performing a 2D FFT, effectively decoupled 1D CT-PRESS spectra were obtained by integrating the signal along f2 within a ±10 Hz interval around the spectral diagonal. Metabolite signals in the 1D spectra were determined by peak integration with an interval of ±6 Hz. The data from both experiments were evaluated with signals normalized to the methyl signal of total creatine (tCr), and data from the second experiment were additionally normalized to the amount of tissue water in the voxel.
3. Results
The quality of the spectra allowed evaluation of signals from NAA (2.02 ppm), tCr (3.03 ppm and 3.93 ppm), choline containing compounds (Cho, 3.24 ppm), Glu (2.36 ppm), Glu+Gln (Glx, 3.78 ppm), myo-inositol (mI, 3.58 ppm), and taurine (Tau, 3.44 ppm).
3.1 Metabolite signals expressed as ratios to tCr
Signal intensities relative to the methyl signal of tCr for both the basal ganglia and cerebellum from the two experiments are given in Table 1. Repeated-measures, within-subject analysis of variance tested metabolite ratio differences between the two brain regions. For both experiments, significant region of interest effects (exp. 1: F(1,5)=279.836, P=0.0001; exp. 2: F(1,5)=197.489, P=0.0001) and region-by-metabolite interactions (exp. 1: F(5,25)=42.713, P =0.0001; exp. 2: F(5,25)=66.052, P =0.0001) indicated that the ratios of the basal ganglia were greater than those of the cerebellum for certain metabolites. Follow-up paired t-tests indicated that these differences were significant for NAA (t(5)=9.223, P =0.0003), Cho (t(5)=12.008, P =0.0001), Glu (t(5)=5.100, P =0.0038), and Glx (t(5)=4.760, P =0.0051) in the first experiment and NAA (t(5)=13.619, P =0.0001), Cho (t(5)=12.033, P =0.0001), Glu (t(5)=9.917, P =0.0002), Glx (t(5)=6.716, P =0.0011) and additionally Tau (t(5)=4.709, P =0.0053) in the second experiment.
Table 1.
Means and standard deviations (N=6) of the major metabolite ratios relative to total creatine (tCr) in the basal ganglia and cerebellum from the first and second experiments. CV: coefficient of variance. P values in bold are significant.
| First Experiment (N=6) | Second Experiment (N=6) | 1st vs. 2nd Exp. | ||||||||||
|---|---|---|---|---|---|---|---|---|---|---|---|---|
| Basal Ganglia | CV | Cerebellum | CV | BG vs. CBL P-value | Basal Ganglia | CV | Cerebellum | CV | BG vs. CBL P-value | P-value BAG | P-value CBL | |
| NAA/Cr1 | 1.03±0.06 | 0.06 | 0.77±0.02 | 0.02 | 0.0003 | 1.03±0.03 | 0.03 | 0.79±0.03 | 0.03 | 0.0001 | 0.8365 | 0.3561 |
| Glu/Cr1 | 0.22±0.02 | 0.10 | 0.16±0.02 | 0.13 | 0.0038 | 0.27±0.02 | 0.07 | 0.18±0.02 | 0.13 | 0.0002 | 0.0159 | 0.2738 |
| Cho/Cr1 | 1.01±0.09 | 0.09 | 0.65±0.06 | 0.09 | 0.0001 | 1.11±0.07 | 0.06 | 0.74±0.07 | 0.10 | 0.0001 | 0.0026 | 0.0160 |
| Tau/Cr1 | 0.17±0.05 | 0.26 | 0.14±0.04 | 0.28 | 0.1772 | 0.17±0.02 | 0.10 | 0.12±0.01 | 0.10 | 0.0053 | 0.9700 | 0.2191 |
| mI/Cr1 | 0.25±0.02 | 0.09 | 0.24±0.02 | 0.08 | 0.1996 | 0.24±0.05 | 0.19 | 0.25±0.01 | 0.06 | 0.7218 | 0.4880 | 0.5195 |
| Glx/Cr1 | 0.29±0.04 | 0.15 | 0.20±0.02 | 0.09 | 0.0051 | 0.28±0.02 | 0.08 | 0.19±0.02 | 0.12 | 0.0011 | 0.4078 | 0.1815 |
| Cr2/Cr1 | 0.46±0.08 | 0.18 | 0.42±0.05 | 0.12 | 0.3660 | 0.45±0.03 | 0.06 | 0.43±0.01 | 0.02 | 0.1541 | 0.9170 | 0.5293 |
Although there were few disparities in metabolite ratios between the first and second experiments, an ANOVA compared the metabolites in the two regions to examine potential differences between the two experiments. The metabolite-by-experiment interaction was significant (F(5,50)=5.14, P=0.0007), indicating that overall the metabolite ratios in the second experiment were higher than those in the first. Differences were statistically significant for the ratios of Cho (t(5)=−5.561, P = 0.0026) and Glu (t(5)=−3.581, P = 0.0159) in the basal ganglia voxel and Cho (t(5)=−3.571, P = 0.0160) in the cerebellar voxel. Nonetheless, the region-by-experiment interaction was not significant (F(1,1)=0.075, P=0.7894).
3.2 Metabolite signals expressed as ratios to tissue water
CT-PRESS spectra from a single rat (a) and an average of 6 rats (b) relative to the water signal in both brain regions from the second experiment are shown in Figure 2. Coefficients of variance for each absolute measure in the basal ganglia versus cerebellum were as follows: NAA 0.07 vs. 0.08, Cho 0.09 vs. 0.06, tCr 0.08 vs. 0.07, Glu 0.10 vs. 0.16, Tau 0.14 vs. 0.11, mI 0.15 vs. 0.10, Glx 0.05 vs. 0.11. Repeated-measures, within-subject analysis of variance revealed a significant region-by-metabolite interaction (F(6,30)=26.809, P = 0.0001) (Figure 3). Follow-up paired t-tests indicated that these regional differences were significant for tCr (t(5)= −5.350, P = 0.0031) and mI (t(5)= −4.793, P = 0.0049), with both metabolite peaks higher in the cerebellum than basal ganglia.
Figure 2.
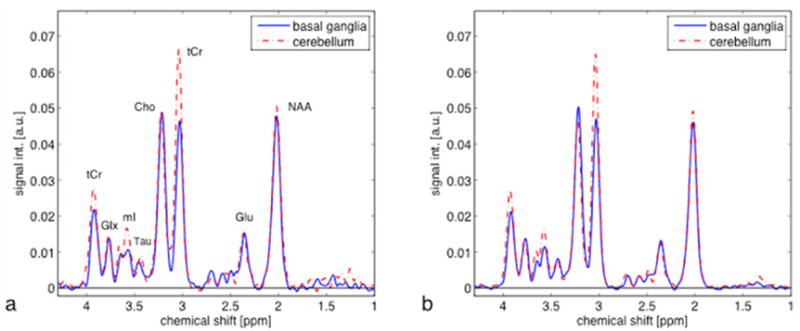
(a) Representative (N=1) and (b) averaged (N=6) CT-PRESS spectra from voxels in the basal ganglia (solid blue) and cerebellum (dashed red). Spectral signal intensities are reported in arbitrary units (a.u.), after normalization to the amount of tissue water in each voxel.
Figure 3.
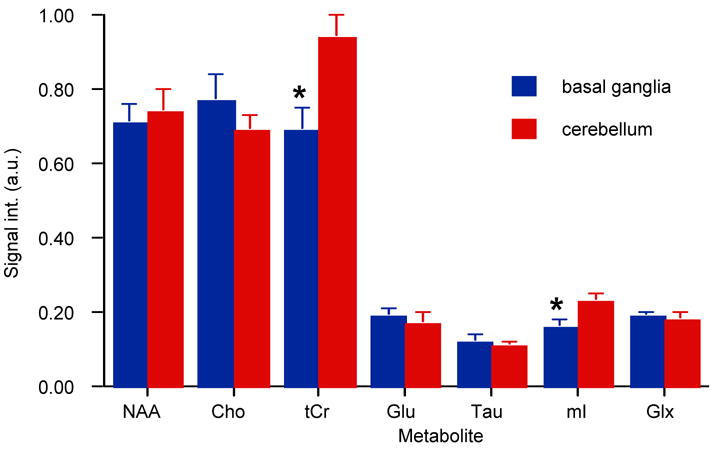
Major metabolite signal intensities in arbitrary units (a.u.), relative to water in the basal ganglia (blue) and cerebellum (red). * (P≤0.005).
4. Discussion
Only recently has the reliable detection of Glu at 3T been improved by applying 2D MRS techniques such as CT-PRESS (Mayer and Spielman, 2005) and TE-averaged PRESS (Hurd, et al., 2004). Evidence that alcohol alters the glutamatergic system is largely derived from in vitro experiments (Hoffman, et al., 1990; Lovinger, 2002). Most in vivo studies of the alcohol/glutamate interaction have relied on microdialysis, a technique limited by its applicability to longitudinal studies (Plock and Kloft, 2005). Our study demonstrates the feasibility of using in vivo CT-PRESS, a technique conducive to longitudinal studies, to reliably measure J-coupled resonances such as Glu in the rat brain at 3T.
The similarities of metabolite ratios relative to tCr between the first and second experiments reveal internal consistency in our acquisitions. We speculate that the significant differences between the two experiments are due to reduced variance in the second experiment (see Table 1). An alternative explanation includes slightly different voxel placements between the experiments.
Regional neurochemical heterogeneity has been observed in previous MRS studies of rodents (Peeling, et al., 1993; Tkac, et al., 2004; Tkac, et al., 2003) and humans (Grachev and Apkarian, 2000; Parks, et al., 2002). When metabolite signals are expressed as ratios relative to tCr, the levels of NAA, Cho, Glu, and Glx appear significantly higher in the basal ganglia than cerebellum in both of our experiments. This observation comports with data from an in vitro MRS study using perchloric acid extracts of rat brain regions including the basal ganglia and cerebellum (Peeling, et al., 1993). In this in vitro study, metabolites, relative to tCr, are generally higher in the basal ganglia (NAA=0.695±0.082, Cho=0.218±0.015, Glu=1.10±0.03, Gln=0.0389±0.039) than in the cerebellum (NAA=0.485±0.052, Cho=0.125 ±0.011, Glu=0.780±0.060, Gln=0.297±0.016).
The use of metabolite ratios, typically relative to tCr, to quantify target metabolites assumes that tCr is robust to potential variation across CNS region. Here we have shown that relative to the water signal, tCr signals are significantly higher in the cerebellum than in the basal ganglia. Indeed, in contrast to the in vitro report of Peeling et al. are in vivo mouse data from a group reporting absolute concentrations acquired at 9.4T (Tkac, et al., 2004) where baseline levels of NAA, Cho, Glu, mI, and Cr were higher in the cerebellum (NAA=8.9 μmol/g, Cho=2.0 μmol/g, Glu=10.5 μmol/g, inositol=6.8 μmol/g, Cr=8.5 μmol/g) than the basal ganglia (NAA=7.8 μmol/g, Cho=1.8 μmol/g, Glu=9.0 μmol/g, mI =4.2 μmol/g, Cr=5.8 μmol/g) (Tkac, et al., 2004). Our data indicate that when NAA, Cho, Glu and Glx are expressed as ratios of tCr they appear higher in the basal ganglia than cerebellum. This inference is inaccurate in light of the water-referenced results which demonstrate that the levels of tCr are lower in the basal ganglia than cerebellum. In addition to regional differences in the levels of Cr, studies that have calculated absolute metabolite values have documented that Cr can change with age (Pfefferbaum, et al., 1999b) and disease (Pfefferbaum, et al., 1999a). Consequently, care must be taken when interpreting data using Cr as an internal standard (Jansen, et al., 2006; Miller, 1991).
Higher levels of tCr in the cerebellum might imply a higher energy demand compared with the basal ganglia (Tedeschi, et al., 1995). However, further interpretation of this finding would require studies using phosphorus-31 MRS to measure tissue concentrations of phosphorus metabolites involved in energy and membrane phospholipid metabolism (Bottomley and Hardy, 1989).
A possible explanation of the higher mI signals in the cerebellum compared with the basal ganglia may be that the phosphatidylinositol second messenger system, of which mI is a major constituent, is a more important signal transduction mechanism or that there are relatively more glia in the cerebellum than basal ganglia (Adalsteinsson, et al., 2002). The latter interpretation is uncertain because recent findings suggest that high levels of mI are also present in neurons (Moore and Galloway, 2002; Novak, et al., 1999).
Our findings emphasize the benefit to in vivo MRS of incorporating methods to establish baseline metabolite signals relative to water. Such advances will contribute to validating an animal model of chronic alcoholism, a disease which induces glutamatergic neurotransmitter system changes in striatal regions (Melendez, et al., 2005; Weiss and Koob, 2001) and structural (O’Neill, et al., 2001; Sullivan, 2003) and biochemical (Jagannathan, et al., 1996; Martin, et al., 1995; Parks, et al., 2002) changes to cerebellar regions.
Footnotes
Publisher's Disclaimer: This is a PDF file of an unedited manuscript that has been accepted for publication. As a service to our customers we are providing this early version of the manuscript. The manuscript will undergo copyediting, typesetting, and review of the resulting proof before it is published in its final citable form. Please note that during the production process errors may be discovered which could affect the content, and all legal disclaimers that apply to the journal pertain.
References
- Adalsteinsson E, Hurd RE, Mayer D, Sailasuta N, Sullivan EV, Pfefferbaum A. In vivo 2D J-resolved magnetic resonance spectroscopy of rat brain with a 3T clinical human scanner. Neuroimage. 2004;22:381–386. doi: 10.1016/j.neuroimage.2003.12.046. [DOI] [PubMed] [Google Scholar]
- Adalsteinsson E, Sullivan EV, Mayer D, Pfefferbaum A. In vivo quantification of ethanol kinetics in rat brain. Neuropsychopharmacology. 2006 doi: 10.1038/sj.npp.1301023. Epub ahead of print January 11. [DOI] [PubMed] [Google Scholar]
- Adalsteinsson E, Sullivan EV, Pfefferbaum A. Biochemical, Functional and Microstructural Magnetic Resonance Imaging (MRI) In: Liu Y, Lovinger DM, editors. Methods in Alcohol-Related Neuroscience Research. CRC Press Boca Raton; FL: 2002. pp. 345–372. [Google Scholar]
- Bendszus M, Weijers HG, Wiesbeck G, Warmuth-Metz M, Bartsch AJ, Engels S, Boning J, Solymosi L. Sequential MR imaging and proton MR spectroscopy in patients who underwent recent detoxification for chronic alcoholism: correlation with clinical and neuropsychological data. American Journal of Neuroradiology. 2001;22:1926–1932. [PMC free article] [PubMed] [Google Scholar]
- Bottomley PA, Hardy CJ. Rapid, reliable in vivo assays of human phosphate metabolites by nuclear magnetic resonance. Clinical Chemistry. 1989;35:392–395. [PubMed] [Google Scholar]
- De Stefano N, Matthews PM, Fu L, Narayanan S, Stanley J, Francis GS, Antel JP, Arnold DL. Axonal damage correlates with disability in patients with relapsing- remitting multiple sclerosis. Results of a longitudinal magnetic resonance spectroscopy study. Brain. 1998;121:1469–1477. doi: 10.1093/brain/121.8.1469. [DOI] [PubMed] [Google Scholar]
- Dreher W, Leibfritz D. Detection of homonuclear decoupled in vivo proton NMR spectra using constant time chemical shift encoding: CT-PRESS. Magnetic Resonance Imaging. 1999;17:141–145. doi: 10.1016/s0730-725x(98)00156-8. [DOI] [PubMed] [Google Scholar]
- Fein G, Meyerhoff D, Di Sclafani V, Ezekiel F, Poole N, MacKay S, Dillon WP, Constans J-M, Weiner MW. 1H magnetic resonance spectroscopic imaging separates neuronal from glial changes in alcohol-related brain atrophy. In: Lancaster F, editor. Alcohol and Glial Cells, NIAAA Research Monograph # 27. US Government Printing Office; Bethesda, MD: 1994. pp. 227–241. [Google Scholar]
- Filippi M, Rovaris M, Pereira C, Comi G. A longitudinal study comparing the sensitivity of CSE and RARE sequences in detecting new multiple sclerosis lesions. Magnetic Resonance Imaging. 1999;17:457–458. doi: 10.1016/s0730-725x(98)00202-1. [DOI] [PubMed] [Google Scholar]
- Grachev ID, Apkarian AV. Chemical heterogeneity of the living human brain: a proton MR spectroscopy study on the effects of sex, age, and brain region. Neuroimage. 2000;11:554–563. doi: 10.1006/nimg.2000.0557. [DOI] [PubMed] [Google Scholar]
- Hoffman PL, Rabe CS, Grant KA, Valverius P, Hudspith M, Tabakoff B. Ethanol and the NMDA receptor. Alcohol. 1990;7:229–231. doi: 10.1016/0741-8329(90)90010-a. [DOI] [PubMed] [Google Scholar]
- Hurd R, Sailasuta N, Srinivasan R, Vigneron DB, Pelletier D, Nelson SJ. Measurement of brain glutamate using TE-averaged PRESS at 3T. Magnetic Resonance Medicine. 2004;51:435–440. doi: 10.1002/mrm.20007. [DOI] [PubMed] [Google Scholar]
- Jagannathan NR, Desai NG, Raghunathan P. Brain metabolite changes in alcoholism: An in vivo proton magnetic resonance spectroscopy (MRS) study. Magnetic Resonance Imaging. 1996;14:553–557. doi: 10.1016/0730-725x(96)00048-3. [DOI] [PubMed] [Google Scholar]
- Jansen JF, Backes WH, Nicolay K, Kooi ME. 1H MR spectroscopy of the brain: absolute quantification of metabolites. Radiology. 2006;240:318–332. doi: 10.1148/radiol.2402050314. [DOI] [PubMed] [Google Scholar]
- Kalivas PW, Volkow N, Seamans J. Unmanageable motivation in addiction: a pathology in prefrontal-accumbens glutamate transmission. Neuron. 2005;45:647–650. doi: 10.1016/j.neuron.2005.02.005. [DOI] [PubMed] [Google Scholar]
- Koob GF. The role of the striatopallidal and extended amygdala systems in drug addiction. Annals of the New York Academy of Science. 1999;877:445–460. doi: 10.1111/j.1749-6632.1999.tb09282.x. [DOI] [PubMed] [Google Scholar]
- Lovinger DM. NMDA receptors lose their inhibitions. Nature Neuroscience. 2002;5:614–616. doi: 10.1038/nn0702-614. [DOI] [PubMed] [Google Scholar]
- Mann K, Seitz D, Widman U, Grodd W. American College of Neuropsychopharmacology. 1998. Proton MR spectroscopy of the cerebellum in detoxified alcoholics and healthy controls (abs) [Google Scholar]
- Martin PR, Gibbs SJ, Nimmerrichter AA, Riddle WR, Welch LW, Willcott MR. Brain proton magnetic resonance spectroscopy studies in recently abstinent alcoholics. Alcoholism: Clinical and Experimental Research. 1995;19:1078–1082. doi: 10.1111/j.1530-0277.1995.tb00992.x. [DOI] [PubMed] [Google Scholar]
- Mayer D, Spielman DM. Detection of glutamate in the human brain at 3 T using optimized constant time point resolved spectroscopy. Magnetic Resonance Medicine. 2005;54:439–442. doi: 10.1002/mrm.20571. [DOI] [PubMed] [Google Scholar]
- Melendez RI, Hicks MP, Cagle SS, Kalivas PW. Ethanol exposure decreases glutamate uptake in the nucleus accumbens. Alcoholism Clinical and Experimental Research. 2005;29:326–333. doi: 10.1097/01.alc.0000156086.65665.4d. [DOI] [PubMed] [Google Scholar]
- Miller BL. A review of chemical issues in 1H NMR spectroscopy: N-acetyl-L-aspartate, creatine and choline. NMR Biomed. 1991;4:47–52. doi: 10.1002/nbm.1940040203. [DOI] [PubMed] [Google Scholar]
- Moghaddam B, Bolinao ML. Biphasic effect of ethanol on extracellular accumulation of glutamate in the hippocampus and the nucleus accumbens. Neuroscience Letters. 1994;178:99–102. doi: 10.1016/0304-3940(94)90299-2. [DOI] [PubMed] [Google Scholar]
- Moore GJ, Galloway MP. Magnetic resonance spectroscopy: neurochemistry and treatment effects in affective disorders. Psychopharmacol Bull. 2002;36:5–23. [PubMed] [Google Scholar]
- Morrisett RA, Martin D, Oetting TA, Lewis DV, Wilson WA, Swartzwelder HS. Ethanol and magnesium ions inhibit N-methyl-D-aspartate-mediated synaptic potentials in an interactive manner. Neuropharmacology. 1991;30:1173–1178. doi: 10.1016/0028-3908(91)90162-5. [DOI] [PubMed] [Google Scholar]
- Novak JE, Turner RS, Agranoff BW, Fisher SK. Differentiated human NT2-N neurons possess a high intracellular content of myo-inositol. J Neurochem. 1999;72:1431–1440. doi: 10.1046/j.1471-4159.1999.721431.x. [DOI] [PubMed] [Google Scholar]
- O’Neill J, Cardenas VA, Meyerhoff DJ. Effects of abstinence on the brain: quantitative magnetic resonance imaging and magnetic resonance spectroscopic imaging in chronic alcohol abuse. Alcoholism: Clinical and Experimental Research. 2001;25:1673–1682. [PubMed] [Google Scholar]
- Parks MH, Dawant BM, Riddle WR, Hartmann SL, Dietrich MS, Nickel MK, Price RR, Martin PR. Longitudinal brain metabolic characterization of chronic alcoholics with proton magnetic resonance spectroscopy. Alcoholism: Clinical and Experimental Research. 2002;26:1368–1380. doi: 10.1097/01.ALC.0000029598.07833.2D. [DOI] [PubMed] [Google Scholar]
- Paxinos G, Watson C. The rat brain in stereotaxic coordinates- the new coronal set. 5. Elsevier; Sydney: 2004. [Google Scholar]
- Peeling J, Shoemaker L, Gauthier T, Benarroch A, Sutherland GR, Minuk GY. Cerebral metabolic and histological effects of thioacetamide-induced liver failure. Am J Physiol. 1993;265:G572–578. doi: 10.1152/ajpgi.1993.265.3.G572. [DOI] [PubMed] [Google Scholar]
- Pfefferbaum A, Adalsteinsson E, Bell RL, Sullivan EV. Development and resolution of brain lesions caused by pyrithiamine and dietary Induced thiamine deficiency and alcohol exposure in the alcohol-preferring (P) Rat: A longitudinal MR imaging and spectroscopy study. Neuropsychopharmacology. 2006 2006 May 24; doi: 10.1038/sj.npp.1301107. Epub. [DOI] [PubMed] [Google Scholar]
- Pfefferbaum A, Adalsteinsson E, Spielman D, Sullivan EV, Lim KO. In vivo brain concentrations of N-acetyl compounds, creatine and choline in Alzheimer’s disease. Archives of General Psychiatry. 1999a;56:185–192. doi: 10.1001/archpsyc.56.2.185. [DOI] [PubMed] [Google Scholar]
- Pfefferbaum A, Adalsteinsson E, Spielman D, Sullivan EV, Lim KO. In vivo spectroscopic quantification of the N-acetyl moiety, creatine and choline from large volumes of gray and white matter: Effects of normal aging. Magnetic Resonance in Medicine. 1999b;41:276–284. doi: 10.1002/(sici)1522-2594(199902)41:2<276::aid-mrm10>3.0.co;2-8. [DOI] [PubMed] [Google Scholar]
- Pfefferbaum A, Adalsteinsson E, Sullivan EV. In vivo structural imaging of the rat brain with a 3T clinical human scanner. Journal of Magnetic Resonance Imaging. 2004;20:779–785. doi: 10.1002/jmri.20181. [DOI] [PubMed] [Google Scholar]
- Plock N, Kloft C. Microdialysis--theoretical background and recent implementation in applied life-sciences. Eur J Pharm Sci. 2005;25:1–24. doi: 10.1016/j.ejps.2005.01.017. [DOI] [PubMed] [Google Scholar]
- Snell LD, Tabakoff B, Hoffman PL. Radioligand binding to the N-methyl-D-aspartate receptor/ionophore complex: alterations by ethanol in vitro and by chronic in vivo ethanol ingestion. Brain Res. 1993;602:91–98. doi: 10.1016/0006-8993(93)90246-j. [DOI] [PubMed] [Google Scholar]
- Sullivan EV. Compromised pontocerebellar and cerebellothalamocortical systems: speculations on their contributions to cognitive and motor impairment in nonamnesic alcoholism. Alcoholism: Clinical and Experimental Research. 2003;27:1409–1419. doi: 10.1097/01.ALC.0000085586.91726.46. [DOI] [PubMed] [Google Scholar]
- Sullivan EV, Harding AJ, Pentney R, Dlugos C, Martin PR, Parks MH, Desmond JE, Chen SHA, Pryor MR, De Rosa E, et al. Disruption of frontocerebellar circuitry and function in alcoholism. Alcoholism: Clinical and Experimental Research. 2003;27:301–309. doi: 10.1097/01.ALC.0000052584.05305.98. [DOI] [PubMed] [Google Scholar]
- Sullivan EV, Pfefferbaum A. Neurocircuitry in alcoholism: A substrate of disruption and repair. Psychopharmacology. 2005;180:583–594. doi: 10.1007/s00213-005-2267-6. [DOI] [PubMed] [Google Scholar]
- Tedeschi G, Bertolino A, Righini A, Campbell G, Raman R, Duyn JH, Moonen CTW, Alger JR, Di Chiro G. Brain regional distribution pattern of metabolite signal intensities in young adults by proton magnetic resonance spectroscopic imaging. Neurology. 1995;45:1384–1391. doi: 10.1212/wnl.45.7.1384. [DOI] [PubMed] [Google Scholar]
- Tkac I, Henry PG, Andersen P, Keene CD, Low WC, Gruetter R. Highly resolved in vivo 1H NMR spectroscopy of the mouse brain at 9.4 T. Magn Reson Med. 2004;52:478–484. doi: 10.1002/mrm.20184. [DOI] [PubMed] [Google Scholar]
- Tkac I, Rao R, Georgieff MK, Gruetter R. Developmental and regional changes in the neurochemical profile of the rat brain determined by in vivo 1H NMR spectroscopy. Magn Reson Med. 2003;50:24–32. doi: 10.1002/mrm.10497. [DOI] [PubMed] [Google Scholar]
- Weiss F, Koob GF. Drug addiction: functional neurotoxicity of the brain reward systems. Neurotox Res. 2001;3:145–156. doi: 10.1007/BF03033235. [DOI] [PubMed] [Google Scholar]