Abstract
Functional magnetic resonance imaging (fMRI) experiments investigating cortical activity while controlling task performance are difficult to conduct due to the high magnetic field environment and a lack of compatible measurement tools. We describe a method to measure the generation of isometric shoulder and elbow torques with a six-degrees-of-freedom (DOF) load cell during an event-related fMRI study. Feasibility of this method is demonstrated by finding cortical activity on the motor cortices in a participant during an event-related study of shoulder abduction and elbow flexion. The described methodology permits researchers to control and measure intersubject and intrasubject motor task performance during event-related brain imaging.
Keywords: functional magnetic resonance imaging, upper limb, event-related, isometric, motor control
Introduction
In order to insure that different participants perform a given motor task in the same manner, the performance of the task must be adequately measured. In brain imaging studies, task monitoring and control are paramount factors in experimental design. Subtle effects of human subject experiments, such as attention, are broadly outside the scope of controllable variables in human subject experiments, especially in impaired subject populations, but may greatly affect the intensity and locations of cortical activation for a given task (Corbetta et al., 2000; Hopfinger et al., 2000; Manoach et al., 2001). Task performance measures are especially important in learning studies to control for changes in behavioral output that may confound brain activation changes occurring with learning (Kelly and Garavan, 2005). Without adequate task monitoring how can researchers insure that changes in brain activation are correlated with neural changes and not the result of subtle alterations in task performance? A reduction in the number of uncontrolled variables is essential to accurately determine functional brain maps in humans.
Many functional magnetic resonance imaging (fMRI) studies use visual inspection or single degree-of-freedom (DOF) feedback to insure subject motor task compliance. A single DOF monitor fails to account for the complexity of motor tasks that often result in torques (twisting forces) across joints, thus in multiple DOF. For example, shoulder flexion results in mechanically coupled action at the elbow requiring a generation of torque at the elbow to stabilize the forearm. Mechanical constraint devices, such as guides and splints, do not insure the subject is repeatedly following the precise paradigm or that all participants perform the task in the same manner (Reinkensmeyer et al., 2000). Participants may produce force largely against a guide and still achieve the desired result. Additionally, few fMRI experiments have investigated the cortical function during motor tasks at the more proximal joints of the upper limb: elbow and shoulder (Alkadhi et al., 2002a; Alkadhi et al., 2002b; Crafton et al., 2003; Cramer et al., 2003; Culham et al., 2003). In these experiments, the shoulder and elbow were either splinted or visually inspected, but mechanical outputs were not quantitatively measured. Special equipment is needed to overcome current limitations in experimental methodologies and guarantee consistent task performance within the single subject and across all participants during fMRI studies.
Participants may use different muscle combinations to achieve a similar output for a single DOF force or torque generating task. As a result of the activation of different muscle combinations at a single articulation or at multiple joints, forces and torques can be generated in more than one DOF simultaneously. Additionally, similar mechanical measures generated in a single DOF may have different secondary, unmeasured mechanical outputs. These secondary outputs may impact cortical activity, but will remain masked in the analysis by assuming the similar performance in all cases. For example, stroke participants may couple shoulder abduction with elbow flexion to a greater extent than control participants. The performance in elbow flexion may be matched in both groups at 25% maximum voluntary torque (MVT), but the stroke participants will have a much greater coupling with shoulder abduction than controls indicating that the two groups were not achieving the same motor output (Yao and Dewald, 2005).
Thus, two experimental needs persist in motor control fMRI experiments: 1) a device capable of quantifying multiple-DOF motor parameters and 2) a method insuring that such a device does not interfere with fMRI acquisition in proximal upper limb experiments. The purpose of this paper is to describe a methodology that addresses these two shortcomings in current experimental brain imaging technology. The method described is based on other methods used in isometric upper limb experiments outside the MR environment to study abnormal joint coupling following stroke induced brain injury (Beer et al., 1999; Dewald and Beer, 2001; Dewald et al., 1995; Dewald et al., 2001; Yao and Dewald, 2005). Portions of this paper have been presented to the International Society of Biomechanics and American Society of Biomechanics Joint Conference and the Society for Neuroscience Annual Meeting in abstract form (Krainak et al., 2005a, 2005b).
Methods
System description
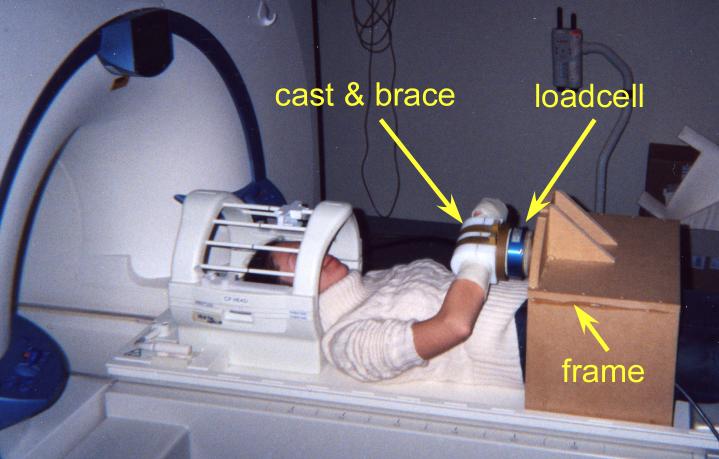
The system includes a non-ferrous six-DOF load cell (Model No. 45E12A-Z1; JR3, Inc., Woodland, CA), holding frame, analog processing electronics, data acquisition, and feedback display (Figure 1). The load cell is customized for MR usage, replacing ferrous materials with nonferrous materials such as aluminum, brass, and titanium. Garolite plates are used to distribute forces evenly across the surfaces of the load cell and prevent localized forces on the load cell. Delrin and garolite brackets clamp the subject's cast arm to the load cell. During experiments, the load cell is mounted on a wooden frame that rests on the scanning bed (Figure 2). The wooden frame is held in place by inflatable bladders placed in the gap between the wooden frame and the upper wall of the magnet bore. The bladders are inflated to 75 psi to insure that the frame would not move. The electronic load cell signals are carried along a 30-foot shielded wire to a filter panel connecting the scanner room to the control room.
Figure 1.
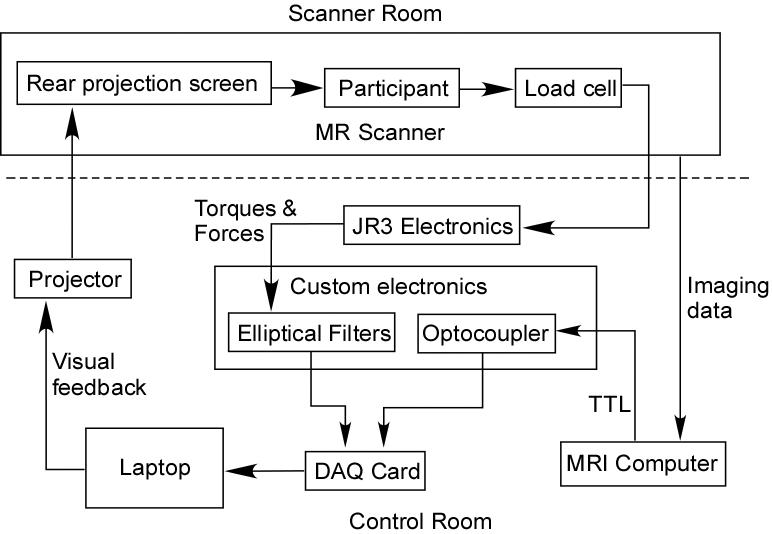
Overview of the joint torque and fMRI data collection system. The participant generated isometric joint torques that resulted in endpoint force and torque data recorded by the JR3, Inc. load cell. These mechanical signals were carried into the control room where the signals were amplified and filtered by the JR3 electronics. Custom built electronics filtered the signals further and incorporated an image synchronization TTL pulse from the computer controlling the imaging data collection. These seven signals (3 torques, 3 forces, and 1 TTL) were recorded by a National Instruments data acquisition card in a laptop computer. The computer computed the joint torques from the force and torque data combined with segment lengths and arm configuration data. Visual feedback based on a single DOF joint torque was then provided to the subject via the projection/projection screen pair. The dotted line represents the radiofrequency (RF) shielding between system components inside the scanner room and those outside the magnetic environment. The optocoupler was used to eliminate electrical interference from the scanner circuitry by isolating the signal electronically.
Figure 2.
The participant was attached to the load cell at the wrist by a fiberglass cast with the elbow positioned at approximately 90-degrees with slight shoulder flexion and shoulder abduction. The load cell was secured by a wooden frame and held in position by air bladders (not shown) placed between the bore wall and the wooden frame inflated to 75 psi.
Inside the control room, analog circuitry processes the force and torque signals as well as synchronizes the imaging and force/torque data. A National Instruments data acquisition card (DAQCard-6036E) acquires the force/torque and scanner synchronization signals at 2500 Hz on a laptop computer. In an effort to reduce the influence of the MR data acquisition on the load cell, the data are filtered through an 8th-order low-pass Butterworth filter at 15-Hz cutoff in the JR3 external analog electronics and through an additional set of 8th low-pass elliptical filters (MAX293, Maxim Integrated Products, Inc., Sunnyvale, CA) with a 10-Hz cutoff (unity gain). TTL pulses sent by the MRI control computer at the beginning of each volume acquisition are recorded alongside the force and torque data in order to align the force/torque data with the image data.
System testing
All of the data processing was performed within Matlab 6.5 and 7 (The Mathworks, Inc.) on a Pentium class personal computer.
To test the effect of the presence of the load cell in the magnet on the imaging results, we imaged a phantom in the presence and in the absence of the load cell and support frame. The power spectra of three volumes (15×15×11 voxels) were analyzed to determine if any artifacts or additional noise were systematically added to the images by the presence of the load cell and support frame. To compute the power spectra, the mean value of each 15×15×11 volume was computed and linear drift was removed by subtracting the best linear fit. Then, the magnitudes of the 128-point Fast Fourier Transforms (FFT) were plotted and visually compared across all four sequences. At each frequency, a Student's t-test was calculated to assess any differences in the signal strength with and without the load cell present. Comparisons were Bonferroni corrected to account for multiple comparisons.
Additionally, we assessed the effect of the fMRI sequence on the force and torque data. We placed the load cell in the magnet to compare the effect of adding filters to the load cell acquisition process. The force signals were compared with and without filters while the MR sequence was running and the power spectra of the force signals were then inspected. We used several different weights to determine if the filtering system had an effect on the load cell recordings. Loads were applied in the z-axis while the load cell was oriented vertically. Values were averaged over a one-second window, subtracting a mean baseline value (over 1 second) recorded prior to adding the weight. Linear regression of the force measurement was determined with and without filters; the resulting slopes and intercepts were compared.
fMRI data acquisition
The functional MR images in both phantom testing and human subject experiments were collected using a modified 2D gradient-echo echo-planar imaging (EPI) sequence (TR=2000ms, TE=31ms, FA=80°, voxel=1.6×1.6×3mm3, 19 contiguous slices) on a Siemens Trio 3T scanner. At the end of the human subject session, following the functional imaging portion of the session, an anatomical scan of the entire brain was acquired to serve as a reference image for functional data analysis using an MP-RAGE T1-weighted 3D gradient-echo sequence (TR=2100ms, TE=4.38ms, TI=1100ms, FA=8°, voxel=1.0×1.0×1.0mm3).
Experimental protocol
The participant provided informed consent for the protocol approved by Northwestern University's Internal Review Board. Outside of the magnet, unimpaired participants (28-year-old male) practiced elbow and shoulder isometric contractions with visual feedback for two hours in the body position that would be later used in the magnet during imaging: supine posture, elbow flexion = 100 degrees (180 degrees ∼ full elbow extension), shoulder abduction = 10 degrees (0 degrees ∼ upper arm against the body, elbow touching ribs), shoulder flexion = 27 degrees (0 degrees ∼ arm in line with body, 90 degrees ∼ perpendicular to the torso in the anterior position), shoulder internal rotation = 20 degrees (0 degrees ∼ forearm parallel to the shoulders against the body). The subject's fingers and wrist were fixated by a subject-specific fiberglass cast. This cast was attached to the Delrin/garolite bracket system mounted on the loadcell. Using a two-link rigid-body model of the human arm, we computed elbow and shoulder torques using anatomic measurements of the joint position and the measured forces and torques from the load cell.
Static motor tasks
The participant performed two static tasks, elbow flexion and shoulder abduction, at 10% of MVT for the task direction. MVT was measured outside the magnet in the same limb configuration as the best of three trials. Verbal encouragement was used to insure best effort during MVT trials. If the three trials did not fall within 10% of each other, additional trials were taken. Tasks were practiced outside the magnet to insure that the participant understood the task, conducted the task with minimal body movement, and to reduce the effects of learning. The participant was provided with visual feedback indicating the direction, magnitude, and duration of the contraction. Elbow flexion was indicated as a target to the left on the screen and the target for shoulder abduction was located towards the top of the screen. In these experiments, a single DOF was provided as feedback, but note that feedback from multiple DOF may be provided simultaneously using this setup. Trials were accepted as successful during the imaging session if the subject held the contraction between 7.5 – 12.5% MVT for one second. Unsuccessful trials were modeled as regressors of no interest during analysis.
Imaging session
The participant was positioned on the MRI scanner table with the forearm cast clamped firmly to the load cell. The participant performed a series of elbow flexion isometric contractions lasting 1-2 seconds and a series of shoulder abduction isometric contractions. The visual interface indicated to the participant when to begin the contraction and when to relax. The task was similar to the practice session with a one second hold in the target torque range. In order to prevent the blood oxygenation level dependent (BOLD) hemodynamic response function (HRF) of sequential contractions from interfering with one another, thirty seconds of rest was given between contractions. During the functional imaging portion, 240 EPI images were taken for each task for a total of 480 functional images. The anatomical images were acquired at the end of the functional imaging session. The total imaging session lasted about one and one-half hours including setup.
Data processing
Mechanical signals
Forces and moments measured at the wrist were converted to torques at the elbow (flexion/extension) and shoulder (flexion/extension, abduction/adduction, and external/internal rotation) based on a free body analysis of the upper limb (Beer et al., 1996). For the subject, the locations of the flexion/extension axis of rotation of the elbow and the center of rotation of the glenohumeral joint were estimated from bony landmarks based on the anatomical studies of Shiba et al. (1988, elbow) and Poppen and Walker (1976, shoulder).
fMRI signal analysis
We analyzed the functional images using SPM2 (Wellcome Department of Imaging Neuroscience). The first six images of each imaging run were removed to minimize T1 relaxation effects. The functional volumes were slice time corrected to compensate for different slice acquisition times in an interleaved sequence. The volumes were realigned to the last functional volume of the entire imaging session to correct for inter-volume movement. To remove unwanted movement-related variance that may be synchronized with the task, images were processed with the ‘unwarped’ toolbox in SPM2 (Andersson et al., 2001). Images were resampled to 3×3×3mm3 voxels in order to have isotropic voxels helpful for further processing. Images were smoothed with an isotropic 6mm full-width half-max (FWHM) Gaussian kernel for individual analysis. The event-related data were analyzed using the General Linear Model and data were modeled as the HRF and its time derivative as implemented in SPM2. The joint torque data were aligned with the image numbers and used to accurately assign event start and duration times for the design matrix with millisecond resolution. The task onset and offset were determined as the time at which the task torque remained in the range of 7.5 – 12.5 % maximum voluntary torque (MVT) of the task direction. Errant trials (outside the 7.5 – 12.5 % MVT) were included as regressors of no interest and were excluded from further analysis.
Results – feasibility evidence
Feasibility of the methodology was demonstrated by phantom testing, load cell signal testing and by acquiring brain imaging data.
Phantom testing
The power spectra of the phantom data were analyzed to insure that no frequency artifacts were caused by the presence of the load cell that might confound the analysis of the fMRI data. Power spectra of the imaging signal in a 15×15×11 cube of voxels was calculated at the three different locations in the phantom images for the four different series (Figure 3). Two locations were placed inside the phantom area and a third location was placed outside the phantom. Two series of data (A and B) were acquired in the absence of the load cell. A third (C) and a fourth (D) series of imaging data were acquired with the load cell present in the magnet bore. There was little difference at all three locations between the series with (C and D) and without (A and B) the load cell present, although some variation between all series was observed. A visual comparison of the power spectra with and without the load cell in the bore revealed no differences in the power spectra. Student's t-tests calculated at each frequency to determine if there were any significant differences in the power of a frequency with and without the load cell present resulted in no significant differences at α=0.05 before Bonferroni correction (after correction for N=62, α=0.0008).
Figure 3.
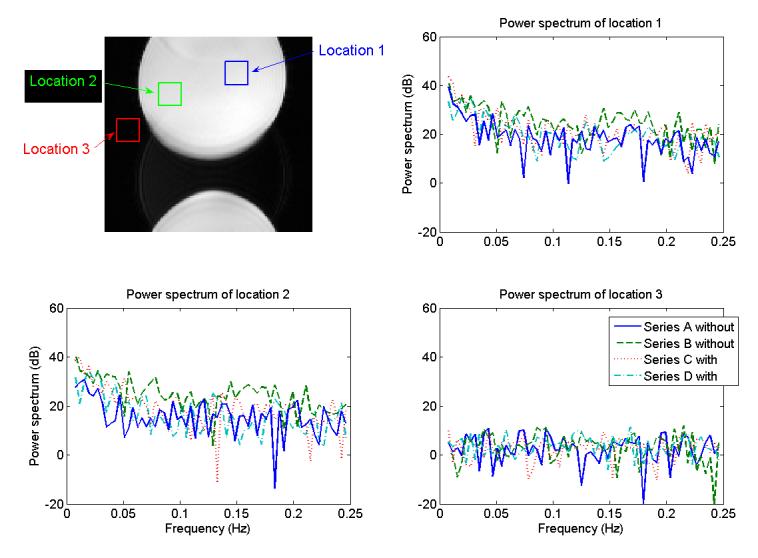
The location of the three volumes used to compare the power spectra to insure that the presence of the load cell in the MRI environment did not corrupt the MR images in a manner which might be mistaken for activation. A 15×15×11 box was averaged at each time point and the power spectra of the mean data analyzed across time after detrending the data (in other words, removing the linear trend) were calculated. Series A and B were both taken without a load cell present in the MRI and series C and D were acquired with the load cell in the MR environment. Power spectra were plotted from amplitude of the FFT calculated from the mean at each location across time after detrending the data.
Torque signal interference testing
Force signals were recorded during the MRI sequence with and without filters to determine how filters affected the force recordings. A substantial decrease in noise on the force signals was observed on the signals recorded with filters in place (Figure 4. Note that there is a scale factor difference of 100 in the force signals presented with and without filters).
Figure 4.
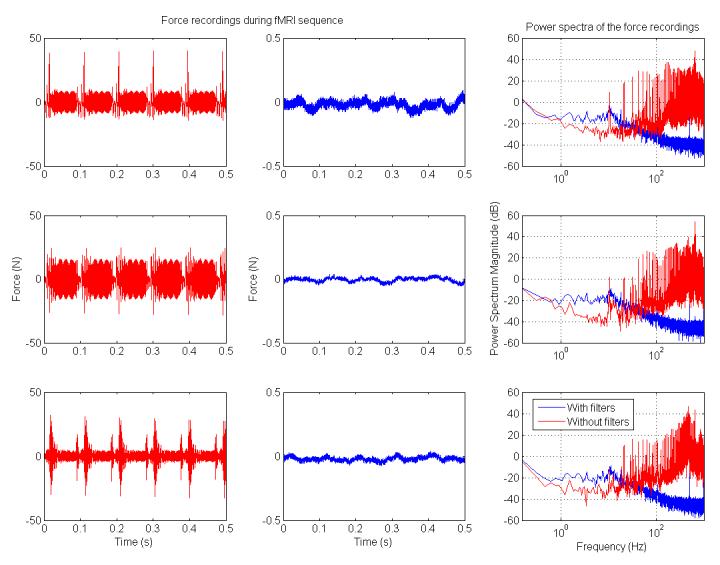
Power spectra from the load cell signal for the force during a 21-slice EPI sequence for a 120×128 matrix with TR=2000ms. Many of the frequencies recorded without filters exhibited higher power spectral magnitudes than the magnitudes of the same frequencies recorded with the filters in place. X-direction (top), y-direction (middle), and z-direction (bottom) forces were analyzed to investigate potential directional dependencies. On the left are load cell force recordings without filters, in the center are the load cell recordings with filters (note that the scale factor is different by a factor of 100, −0.5 to 0.5 N instead of −50 to 50 N on the left), and on the right are the magnitude of the power spectra of these two recordings overlaid.
The addition of the filters on the load cell force and torque signals did not significantly (p < 0.05) alter the linearity of the load cell (Table 1 & Table 2). There were some differences in the forces measured that increased as the load increased, but the error remained less than 1% of the measured value, and the measurement remained linear (R=0.998). Any phase delay introduced by the filters was not reported by participants when compared with load cell feedback in the absence of filters outside the magnet.
Table 1.
Z-force load cell recordings with and without filters
| Mass force (N) | Without filters (N) | With Filters (N) |
|---|---|---|
| 0 | 0 | 0 |
| 11 | 11.25 | 11.32 |
| 44 | 45.97 | 46.28 |
| 56 | 57.20 | 57.59 |
| 89 | 91.21 | 91.95 |
| 100 | 102.48 | 103.16 |
| 133 | 137.21 | 138.18 |
| 145 | 148.42 | 149.46 |
| 178 | 179.15 | 180.46 |
Table 2.
Linear regression of the z-force data for masses to determine if filters affect the data
|
Slope ± SE |
Slope 95% CI |
y-intercept ± SE |
y-intercept 95% CI |
|
|---|---|---|---|---|
| Without filters | 1.015±0.0065 | 0.998 to 1.032 | 0.626±0.658 | −1.072 to 2.323 |
| With filters | 1.022±0.0065 | 1.005 to 1.039 | 0.632±0.663 | −1.066 to 2.330 |
Joint torques were successfully recorded and multiple DOF were monitored to indicate whether or not the participant was generating any secondary torques while attempting to match the 7.5-12.5% MVT range of the primary torque. An example of a single shoulder abduction torque indicated that elbow flexion/extension and shoulder flexion/extension were minimal in the participant during this task (Figure 5).
Figure 5.
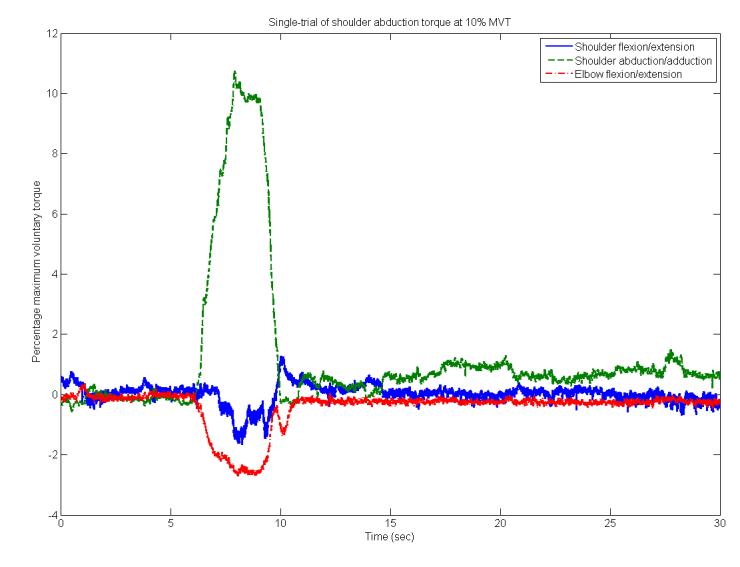
A single trial recorded during an MRI session. The participant was given visual feedback during a request to generate a 7.5-12.5% shoulder abduction torque. Elbow flexion/extension and shoulder flexion/extension secondary torques were also recorded.
Feasibility of acquiring brain imaging data
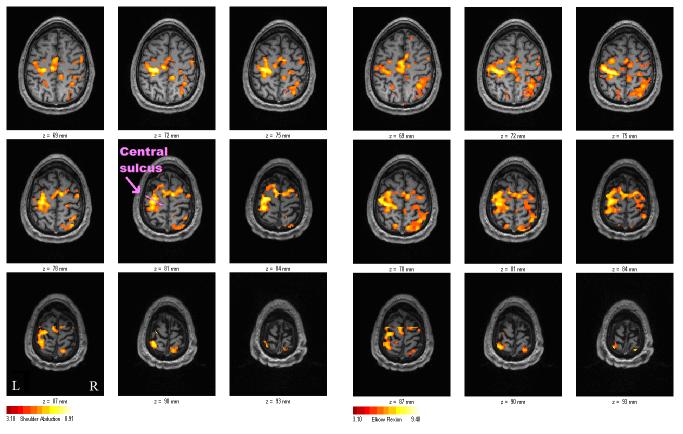
The participant exhibited activation in the motor cortices for both elbow flexion and shoulder abduction. The subject was imaged in two 240-image long series, the first during an elbow flexion task (13 successful, 1 unsuccessful contraction) and the second during a shoulder abduction task (14 successful, 0 unsuccessful contraction). Functional maps were created with a cluster size of 8 voxels and a threshold T > 3.10 (p < 0.001 uncorrected). Activations were observed in the motor cortices including the supplementary motor area, premotor areas, and the primary motor cortex (Figure 6).
Figure 6.
The subject's activation maps for right-handed shoulder abduction task (left) and right-handed elbow flexion task (right). The primary motor cortices, supplementary motor area, premotor areas, and primary sensory area were activated under both conditions. Comparison between the two tasks in the single subject yielded no statistically different activation sites (p > 0.05).
Discussion
This methodology allowed us to successfully investigate shoulder and elbow isometric tasks with fMRI. By incorporating six-DOF mechanical measurements, we would be able to control intersubject and intrasubject task execution by providing performance-based visual feedback as well as eliminating unsuccessful trials from subsequent post-hoc analysis. While the feasibility experiment described above only provided a single DOF visual feedback, torques generated in the other DOF were measured simultaneously. Providing multiple-DOF visual feedback from torques generated at various joints could also be implemented using this method. We elected to only provide the subject with one-DOF feedback for simplicity. By controlling and monitoring torque output in an event-related paradigm, we were able to develop a method to investigate the cortical activations during the generation of shoulder and elbow torques. The long trial event-related design also allowed us to minimize the effects of head movement, as the head was generally stable subsequent to task execution. The delayed BOLD responses were captured during these periods without active motor tasks. We found activation along the motor cortices for both elbow and shoulder tasks.
While providing a methodology to enable investigators to better monitor upper limb task performance during an fMRI experiment, several constraints limit the applicability of this method. Conductive strain gauges do not provide the ideal interface for monitoring torques and forces. Hydraulic solutions have been implemented (Dai et al., 2001; Liu et al., 2000; Vaillancourt et al., 2003), but there is no compact hydraulic solution for monitoring multiple DOF simultaneously. A similar method to the method described above has been implemented at the wrist, but did not suffer greatly from noise on the load cell recordings because the load cell was located further from the MR imaging region (Hidler et al., 2006). In the future, strain gauges may be replaced with optical force transducers and nonconductive nonferrous materials may be substituted for the remaining materials that are influenced by rapidly changing magnetic fields to improve data collection. Current materials prevent the load cell described from being used in dynamic movement task investigations due to the generation of eddy currents. These eddy currents generate significant amounts of noise in the load cell measurements as well as introduce forces that oppose motion within a magnetic field as described by the Hall Effect.
Isometric experiments allow for detailed investigation of independent joint control in a stable environment. Dynamic motor tasks in the MRI environment pose several difficulties including monitoring the task adequately, controlling intersubject and intrasubject variability, and freedom of movement due to the space limitations of the MRI bore. This particular methodology is also limited by the need for a short contraction in order to analyze the data in the face of task-synchronized head movement. Empirical evidence suggested that block design experiments, in which the participant held contractions for about 20 seconds, could not be used to localize statistically significant activation maps. Thus, shorter contractions were utilized in these experiments.
Head movement
Task synchronized head movement contributes negatively to the ability to detect localized activation sites in the brain with fMRI, especially in proximal muscle experiments (Birn et al., 1999; Diedrichsen and Shadmehr, 2005). Mechanical connections from the proximal joints to the head are shorter than connections from more distal joints with less ability to dampen reactive forces. Artifacts may be caused not only by head movement, but also mass-related artifacts that may cause field inhomogeneity (Culham et al., 2003). By using isometric contractions, we eliminated the bulk of movement during the experiment that may result in field inhomogeneity. In order to reduce the effects of head movement, the participant performed short 1-2 second contraction tasks. This setup was tested in a block design experiment (results not shown) and the head motion distorted the analysis. Thus, this experiment relied on quick torque generation and relaxation so that head movement did not interfere with the detection of the BOLD response. While the head movement was synchronized with the task (Figure 7), due to the brevity of the task and the delay of the activation induced HRF, the effect of the head movement on activation detection should be minimal (Birn et al., 1999).
Figure 7.
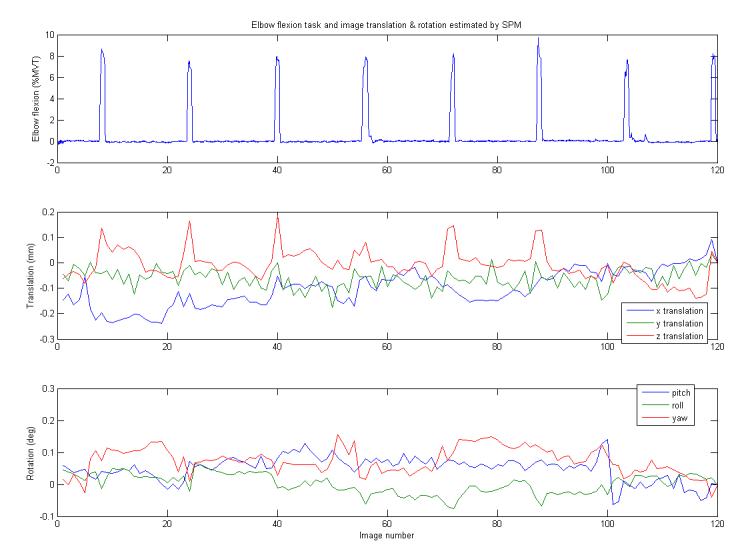
The elbow flexion torque is shown with the output of the SPM realign function that estimates the translation and rotation of each image. The z-direction translation peaked at most of the elbow flexion torques indicating that head movement was synchronized with the generation of torque.
Future directions
By utilizing and improving upon quantitative measurements of motor output in fMRI studies, we may better understand the functional activation maps determined. Several groups have used one-DOF devices in order to achieve this goal (Culham et al., 2003; Dai et al., 2001; Ehrsson et al., 2003; Floyer-Lea and Matthews, 2005; Liu et al., 2002; Vaillancourt et al., 2003). We implemented a method that permits researchers to quantitatively control experiments across joints and subjects. Such a method allows for multi-task experiments, such as elbow flexion at 5% MVT with shoulder abduction at 10% MVT. These paradigms also enable researchers to study brain organization associated with volitional multi-joint motor tasks. Research suggests that multiple-DOF motor tasks require more attention and possibly greater brain activation (Heuninckx et al., 2005; Meister et al., 2005), but if these multiple-DOF tasks may be related to a more natural, frequently rehearsed activity (such as drinking from a cup), less activation may be required. Additionally, task selection influences the location of somatosensory activation, and thus, the representation of the shoulder and elbow in M1 may differ based on the task complexity or attention demands (Schaefer et al., 2005). With a multi-DOF load cell, one may quantify activity within and across joints to rigorously investigate changes in brain activity that may or may not correlate with shifts in control strategies following neurological (such as stroke) or orthopedic (for example, soft tissue) injuries. Musculoskeletal modelers may also benefit from the ability to simultaneously quantify joint torques and image soft tissue during isometric tasks. The proposed methodology provides the means to investigate these important questions.
Conclusion
In short, our methodology offers two significant contributions to fMRI research, a method to simultaneously monitor multiple joint torques under isometric conditions and a means to record brain activation during a repeatable, controllable elbow/shoulder tasks. Using the six-DOF load cell enables us to measure not only what the person may be doing in relation to a specific oneDOF task, but to measure additional coupling forces and torques that may differ from person to person, especially in neurologically or physically impaired subjects. Measuring brain activity during increasingly complex motor tasks may only be achieved with the tools, such as the one presented, that permit researchers to monitor subjects' performance in multiple DOF, whether at the hand, wrist, shoulder, knee, ankle, foot or other motor output points. It remains to be seen whether this methodology could be implemented in dynamic movement tasks given concerns that a large body moving inside the magnet may distort the fMRI signals especially closer to the imaged volume (Culham et al., 2003).
Acknowledgements
This work was supported by an award from the American Heart Association (0515514Z), an R01 grant from the NIH (HD047569-01A1), the Rehabilitation Institute of Chicago Women's Board, and a grant from the Department of Education (NIDRR - H133G030143). We also acknowledge support from JR3, Inc.
Footnotes
Publisher's Disclaimer: This is a PDF file of an unedited manuscript that has been accepted for publication. As a service to our customers we are providing this early version of the manuscript. The manuscript will undergo copyediting, typesetting, and review of the resulting proof before it is published in its final citable form. Please note that during the production process errors may be discovered which could affect the content, and all legal disclaimers that apply to the journal pertain.
References
- Alkadhi H, Crelier GR, Boendermaker SH, Golay X, Hepp-Reymond MC, Kollias SS. Reproducibility of primary motor cortex somatotopy under controlled conditions. AJNR Am J Neuroradiol. 2002a;23:1524–32. [PMC free article] [PubMed] [Google Scholar]
- Alkadhi H, Crelier GR, Boendermaker SH, Hepp-Reymond MC, Kollias SS. Somatotopy in the ipsilateral primary motor cortex. Neuroreport. 2002b;13:2065–70. doi: 10.1097/00001756-200211150-00015. [DOI] [PubMed] [Google Scholar]
- Andersson JL, Hutton C, Ashburner J, Turner R, Friston K. Modeling geometric deformations in EPI time series. Neuroimage. 2001;13:903–19. doi: 10.1006/nimg.2001.0746. [DOI] [PubMed] [Google Scholar]
- Beer FP, Johnston ER, Eisenberg ER. Statics. 6th ed. McGraw-Hill; New York: 1996. Vector mechanics for engineers. [Google Scholar]
- Beer RF, Given JD, Dewald JP. Task-dependent weakness at the elbow in patients with hemiparesis. Arch Phys Med Rehabil. 1999;80:766–72. doi: 10.1016/s0003-9993(99)90225-3. [DOI] [PubMed] [Google Scholar]
- Birn RM, Bandettini PA, Cox RW, Shaker R. Event-related fMRI of tasks involving brief motion. Hum Brain Mapp. 1999;7:106–14. doi: 10.1002/(SICI)1097-0193(1999)7:2<106::AID-HBM4>3.0.CO;2-O. [DOI] [PMC free article] [PubMed] [Google Scholar]
- Corbetta M, Kincade JM, Ollinger JM, McAvoy MP, Shulman GL. Voluntary orienting is dissociated from target detection in human posterior parietal cortex. Nat Neurosci. 2000;3:292–7. doi: 10.1038/73009. [DOI] [PubMed] [Google Scholar]
- Crafton KR, Mark AN, Cramer SC. Improved understanding of cortical injury by incorporating measures of functional anatomy. Brain. 2003;126:1650–9. doi: 10.1093/brain/awg159. [DOI] [PubMed] [Google Scholar]
- Cramer SC, Benson RR, Burra VC, Himes D, Crafton KR, Janowsky JS, Brown JA, Lutsep HL. Mapping individual brains to guide restorative therapy after stroke: rationale and pilot studies. Neurol Res. 2003;25:811–4. doi: 10.1179/016164103771953899. [DOI] [PubMed] [Google Scholar]
- Culham JC, Danckert SL, DeSouza JF, Gati JS, Menon RS, Goodale MA. Visually guided grasping produces fMRI activation in dorsal but not ventral stream brain areas. Exp Brain Res. 2003;153:180–9. doi: 10.1007/s00221-003-1591-5. [DOI] [PubMed] [Google Scholar]
- Dai TH, Liu JZ, Sahgal V, Brown RW, Yue GH. Relationship between muscle output and functional MRI-measured brain activation. Exp Brain Res. 2001;140:290–300. doi: 10.1007/s002210100815. [DOI] [PubMed] [Google Scholar]
- Dewald JP, Beer RF. Abnormal joint torque patterns in the paretic upper limb of subjects with hemiparesis. Muscle Nerve. 2001;24:273–83. doi: 10.1002/1097-4598(200102)24:2<273::aid-mus130>3.0.co;2-z. [DOI] [PubMed] [Google Scholar]
- Dewald JP, Pope PS, Given JD, Buchanan TS, Rymer WZ. Abnormal muscle coactivation patterns during isometric torque generation at the elbow and shoulder in hemiparetic subjects. Brain. 1995;118(Pt 2):495–510. doi: 10.1093/brain/118.2.495. [DOI] [PubMed] [Google Scholar]
- Dewald JP, Sheshadri V, Dawson ML, Beer RF. Upper-limb discoordination in hemiparetic stroke: implications for neurorehabilitation. Top Stroke Rehabil. 2001;8:1–12. doi: 10.1310/WA7K-NGDF-NHKK-JAGD. [DOI] [PubMed] [Google Scholar]
- Diedrichsen J, Shadmehr R. Detecting and adjusting for artifacts in fMRI time series data. Neuroimage. 2005;27:624–34. doi: 10.1016/j.neuroimage.2005.04.039. [DOI] [PMC free article] [PubMed] [Google Scholar]
- Ehrsson HH, Fagergren A, Johansson RS, Forssberg H. Evidence for the involvement of the posterior parietal cortex in coordination of fingertip forces for grasp stability in manipulation. J Neurophysiol. 2003;90:2978–86. doi: 10.1152/jn.00958.2002. [DOI] [PubMed] [Google Scholar]
- Floyer-Lea A, Matthews PM. Distinguishable brain activation networks for short- and long-term motor skill learning. J Neurophysiol. 2005;94:512–8. doi: 10.1152/jn.00717.2004. [DOI] [PubMed] [Google Scholar]
- Heuninckx S, Wenderoth N, Debaere F, Peeters R, Swinnen SP. Neural basis of aging: the penetration of cognition into action control. J Neurosci. 2005;25:6787–96. doi: 10.1523/JNEUROSCI.1263-05.2005. [DOI] [PMC free article] [PubMed] [Google Scholar]
- Hidler J, Hodics T, Xu B, Dobkin B, Cohen LG. MR compatible force sensing system for real-time monitoring of wrist moments during fMRI testing. J Neurosci Methods. 2006 doi: 10.1016/j.jneumeth.2006.01.016. [DOI] [PMC free article] [PubMed] [Google Scholar]
- Hopfinger JB, Buonocore MH, Mangun GR. The neural mechanisms of top-down attentional control. Nat Neurosci. 2000;3:284–91. doi: 10.1038/72999. [DOI] [PubMed] [Google Scholar]
- Kelly AM, Garavan H. Human functional neuroimaging of brain changes associated with practice. Cereb Cortex. 2005;15:1089–102. doi: 10.1093/cercor/bhi005. [DOI] [PubMed] [Google Scholar]
- Krainak DM, Parrish TB, Dewald JP. FMRI brain imaging during six DOF mechanical measurements of upper limb isometric contractions; Combined XXth ISB and 29th ASB meetings; Cleveland, OH. 2005a. [Google Scholar]
- Krainak DM, Parrish TB, Dewald JP. fMRI of the cortex during six DOF mechanical measurements of upper limb isometric torques; Society for Neuroscience 35th Annual Meeting; Washington, DC. 2005b. [Google Scholar]
- Liu JZ, Dai TH, Elster TH, Sahgal V, Brown RW, Yue GH. Simultaneous measurement of human joint force, surface electromyograms, and functional MRI-measured brain activation. J Neurosci Methods. 2000;101:49–57. doi: 10.1016/s0165-0270(00)00252-1. [DOI] [PubMed] [Google Scholar]
- Liu JZ, Zhang L, Yao B, Yue GH. Accessory hardware for neuromuscular measurements during functional MRI experiments. Magma. 2002;13:164–71. doi: 10.1007/BF02678592. [DOI] [PubMed] [Google Scholar]
- Manoach DS, Halpern EF, Kramer TS, Chang Y, Goff DC, Rauch SL, Kennedy DN, Gollub RL. Test-retest reliability of a functional MRI working memory paradigm in normal and schizophrenic subjects. Am J Psychiatry. 2001;158:955–8. doi: 10.1176/appi.ajp.158.6.955. [DOI] [PubMed] [Google Scholar]
- Meister I, Krings T, Foltys H, Boroojerdi B, Muller M, Topper R, Thron A. Effects of long-term practice and task complexity in musicians and nonmusicians performing simple and complex motor tasks: implications for cortical motor organization. Hum Brain Mapp. 2005;25:345–52. doi: 10.1002/hbm.20112. [DOI] [PMC free article] [PubMed] [Google Scholar]
- Poppen NK, Walker PS. Normal and abnormal motion of the shoulder. J Bone Joint Surg Am. 1976;58:195–201. [PubMed] [Google Scholar]
- Reinkensmeyer DJ, Kahn LE, Averbuch M, McKenna-Cole A, Schmit BD, Rymer WZ. Understanding and treating arm movement impairment after chronic brain injury: progress with the ARM guide. J Rehabil Res Dev. 2000;37:653–62. [PubMed] [Google Scholar]
- Schaefer M, Heinze HJ, Rotte M. Task-relevant modulation of primary somatosensory cortex suggests a prefrontal-cortical sensory gating system. Neuroimage. 2005;27:130–5. doi: 10.1016/j.neuroimage.2005.04.005. [DOI] [PubMed] [Google Scholar]
- Shiba R, Sorbie C, Siu DW, Bryant JT, Cooke TD, Wevers HW. Geometry of the humeroulnar joint. J Orthop Res. 1988;6:897–906. doi: 10.1002/jor.1100060614. [DOI] [PubMed] [Google Scholar]
- Vaillancourt DE, Thulborn KR, Corcos DM. Neural basis for the processes that underlie visually guided and internally guided force control in humans. J Neurophysiol. 2003;90:3330–40. doi: 10.1152/jn.00394.2003. [DOI] [PubMed] [Google Scholar]
- Yao J, Dewald JP. Evaluation of different cortical source localization methods using simulated and experimental EEG data. Neuroimage. 2005;25:369–82. doi: 10.1016/j.neuroimage.2004.11.036. [DOI] [PubMed] [Google Scholar]


