

Abstract
Biofilms can be undesirable, as in those covering medical implants, and beneficial, such as when they are used for waste treatment. Because cohesive strength is a primary factor affecting the balance between growth and detachment, its quantification is essential in understanding, predicting, and modeling biofilm development. In this study, we developed a novel atomic force microscopy (AFM) method for reproducibly measuring, in situ, the cohesive energy levels of moist 1-day biofilms. The biofilm was grown from an undefined mixed culture taken from activated sludge. The volume of biofilm displaced and the corresponding frictional energy dissipated were determined as a function of biofilm depth, resulting in the calculation of the cohesive energy. Our results showed that cohesive energy increased with biofilm depth, from 0.10 ± 0.07 nJ/μm3 to 2.05 ± 0.62 nJ/μm3. This observation was reproducible, with four different biofilms showing the same behavior. Cohesive energy also increased from 0.10 ± 0.07 nJ/μm3 to 1.98 ± 0.34 nJ/μm3 when calcium (10 mM) was added to the reactor during biofilm cultivation. These results agree with previous reports on calcium increasing the cohesiveness of biofilms. This AFM-based technique can be performed with available off-the-shelf instrumentation. It could therefore be widely used to examine biofilm cohesion under a variety of conditions.
It is essential to understand biofilm stability to both encourage biofilm maintenance in some applications, such as waste treatment, and effectively remove undesired biofilm in others, as in biofilms covering medical implants. Biofilm detachment is one of the critical factors that balance growth and plays a role in the development of biofilm spatial heterogeneity. While factors responsible for biofilm growth are well studied (16, 29, 39, 42, 43), those controlling the detachment process are not clearly understood (28, 36, 38). As a consequence, a good understanding of the relationships between operating conditions and biofilm cohesion is lacking. The cohesive strength of the biofilm is influenced by extracellular polymeric substances (EPS) and specific compounds, such as calcium, which fill the space between microbial cells and bind cells together (23, 30). Understanding the cohesive interactions in the biofilm matrix under a variety of conditions could lead to the design of new strategies for controlling biofilm development based on disrupting or protecting the matrix holding the biofilm together.
Because cohesive strength is a primary factor affecting biofilm sloughing, its quantification is essential in understanding detachment. A few methods based on the use of custom devices have been proposed to investigate biofilm cohesive strength. Poppele and Hozalski (31) measured the tensile strength levels of biofilms from activated sludge by using a micromechanical device based on the deflection of a glass micropipette separating a microbial aggregate held by suction. Körstgens et al. (22) used a uniaxial compression measurement device to determine the yield strength levels and the apparent moduli of elasticity of Pseudomonas aeruginosa biofilms. Ohashi and Harada (27) used rotation and collision devices and found that the shear strength levels of denitrifying biofilms were higher than the tensile strength levels by 2 orders of magnitude. In addition, Ohashi et al. (28), by assuming that a biofilm behaves as an elastic material, found a correlation between the elastic coefficient and tensile strength. Not surprisingly, data reported on biofilm strength measured under different types of deformation using custom devices are different and inherently difficult to compare.
In the past few years, atomic force microscopy (AFM) has been used to image film morphologies and probe surface properties, such as ligand and receptor interactions and viscoelasticity (1, 18). AFM provides three-dimensional images of a surface ultrastructure with molecular or near-molecular resolution under physiological conditions and with minimal sample preparation. Benoit et al. (6) attached a single microbial cell to an AFM cantilever and measured cell-cell interactions at a molecular level. Emerson and Camesano (14) investigated pathogenic microbial adhesion to biomaterials by measuring the local interaction forces between an immobilized cell and both biomaterial and biofilm surfaces. Cell surface hydrophobicity and charge have also been investigated using chemically functionalized AFM probes (2, 41). All of these studies and measurements provide important information on single-cell properties; nevertheless, they do not provide information on the properties of whole biofilms.
Because of the difficulties associated with working with biofilms, particularly their softness and gelatinous nature, most biofilms imaged by AFM have been dried first (8, 25, 35). Drying is expected to significantly change the strength and overall character of a biofilm; therefore, measurements made on dry biofilm must be interpreted and applied carefully. A few AFM studies have investigated biofilm properties, such as interaction and attachment to surfaces under aqueous conditions (5, 21). Yet, there is a real need to expand this work to study additional properties of whole biofilms under aqueous conditions.
AFM also has been extensively employed to image and gauge the frictional properties of organic and polymeric surfaces (3, 7, 33). The frictional response is well known to have a large contribution from the viscous character of the material being imaged (17, 19). Some investigators have examined response functions by characterizing friction and/or wear under repeated scanning with variable loads (13, 33), providing information on the viscoelastic and viscoplastic properties of a material.
To our knowledge, concomitant friction and wear processes on biofilms, important for understanding shear-induced detachment, have not been investigated. In this paper, we develop an AFM method for reproducibly measuring, in situ, frictional-energy dissipation on moist biofilms during abrasion via a raster-scanned tip under an elevated load. Also, we quantify the volume of detached biofilm via before/after topographic image comparisons. We use this methodology to reproducibly determine the cohesion, or cohesive energy level, of a volume of moist biofilm (nJ/μm3). Besides reproducibility and simplicity, this method also has the nanoscale level capability of being able to measure in situ cell/EPS and EPS/EPS interactions within a well-defined volume of biofilm.
MATERIALS AND METHODS
Membrane-aerated biofilm reactor.
A sample of activated sludge from the Metropolitan Wastewater Treatment Plant (Saint Paul, MN) containing a diverse community of bacteria was collected from the aeration tanks (34). A 200-ml aliquot of cryopreserved (20% [vol/vol] glycerol), activated sludge was used to inoculate a 10-liter completely mixed reactor filled with a feed solution that contained 1.87 g/liter sodium acetate, 0.52 g/liter ammonium chloride, 0.025 g/liter yeast extract, and 0.025 g/liter Casamino Acids dissolved in dechlorinated tap water with or without additional added calcium (10 mM CaCl2). The reactor was fed at a flow rate of 5 ml/min (Master Flex L/S model 77200-50; Cole-Parmer, IL), which provided a mean hydraulic detention time of 33 h. Bulk reactor conditions were monitored daily and maintained at 147 ± 37 mg/liter chemical oxygen demand and 28 ± 8 mg/liter ammonia nitrogen. Chemical oxygen demand concentrations were determined colorimetrically using dichromate (HACH, CO), and ammonia nitrogen concentrations were quantified using an ammonia-specific electrode (HACH, CO).
The reactor was precultured for 24 h, and multiple membrane test modules were submerged in the reactor at the same time to support the growth of young, 1-day biofilms. Membrane test modules were made from microporous polyolefin flat sheet membrane that had been treated by cross-linking it with a fluorocarbon polyurethane coating (0.1-μm mean pore diameter and 34% porosity; 3M Corporation). A 5- by 5-cm sample of the membrane was inserted into two stainless steel tubes that served as the gas supply and exhaust manifolds, as illustrated (Fig. 1A). The membrane was supported on a porous support that allowed air to flow through the gas-permeable membrane. An airflow rate of ∼50 ml/min was maintained through individual membrane specimens during each experiment.
FIG. 1.

Diagrams representing the membrane test module (A), nonabraded biofilm surface topography (B), abraded biofilm (C), and the resulting image after subtraction (D).
Biofilm preparation and imaging.
Membrane test modules were removed from the bioreactor after 1 day of growth. A wet piece (∼1 by 1 cm) of the membrane and attached biofilm was cut and placed into a chamber containing a saturated NaCl solution/excess salt at room temperature. This provides an environment with a constant humidity level (∼90%). The membrane pieces were allowed to equilibrate for 1 hour. After equilibration, these biofilm-coated membrane samples were mounted on the AFM apparatus for scanning. The AFM contained a chamber (PicoSPM; Molecular Imaging), which was controlled at 90% humidity. The humidity chamber, a standard part of the AFM, was connected to a humidity controller (model 514; ETS Electro-Tech, Inc.) that regulates an ultrasonic humidifier (Holmes) by bringing water vapor or dried air. This preparation method was designed to maintain a consistent biofilm-water content.
All AFM experiments were performed with a PicoSPM (Molecular Imaging) scanning probe microscope with an M scanner (lateral range = 30 μm; vertical range = 7 μm) in conjunction with a Nanoscope III controller and Nanoscope system software (Digital Instruments). The design of the PicoSPM isolates the sample stage from the piezoelectric scanner and associated electronics, thus allowing for temperature, humidity, and atmosphere control in an O-ring-sealed sample chamber. Images of topography (height in nanometers) and friction force (raw units of volts as output from the split photodiode) were collected as the tip was scanned across the sample surface under feedback-maintained constant vertical deflection of the cantilever (in nanometers, converted to applied loads via multiplication by the manufacturer-specified cantilever spring constant of 0.58 N/m). V-shaped microfabricated (100-μm) cantilevers with pyramidal, oxide-sharpened Si3N4 tips, supplied by Digital Instruments (model NPS), were used for imaging. The scan velocity, equal to 2 × scan length × scan frequency, was in the range of 50 to 100 μm/s.
Measuring cohesive energy by scan-induced abrasion. (i) Volume of displaced biofilm.
To determine the volume of biofilm displaced by AFM scanning, we first collected nonperturbative topographic images of a 5- by 5-μm biofilm region at a low applied load (∼0 nN) as shown in Fig. 1B. We then zoomed into a 2.5- by 2.5-μm subregion and abraded the biofilm under repeated raster scanning at an elevated load (40 nN). This abrasive scanning was repeated for four raster scans; then, the applied load was reduced to ∼0 nN and a nonperturbative 5- by 5-μm image of the abraded region was again collected, as illustrated in Fig. 1C. Consecutive, nonperturbative 5- by 5-μm height images, each following four raster abrasions, were subtracted to obtain the topographic changes that had occurred during the four scans at high loads (Fig. 1D [i.e., the Fig. 1C region minus the Fig. 1B region]). The entire process was repeated five times within a given biofilm region for a total of 20 abrasive raster scans. The average depth of abrasion was measured from each difference image by using Nanoscope system software (Digital Instruments) and multiplied by the raster scan area to obtain the volume of material displaced. This process was repeated with four different, separately grown biofilms to assess reproducibility.
(ii) Raw friction force acquisition and data reduction.
The friction force in raw units of volts was determined from (one-half of) the difference between retrace (right-to-left) and trace (left-to-right) 512- by 512-pixel lateral force images (Fig. 2A and B). An example of the resulting friction difference image is shown in Fig. 2C. Topographic (slope-derived) contributions to the overall lateral force are independent of scanning direction and are thus removed by the subtraction process, along with a variable optical background (19). Hysteresis in the scanning position also was removed by invoking a 1- to 2-pixel shift between retrace and trace images (custom software), yielding a more precise removal of topographic contributions and minimal “double image” effects. The friction force was quantified from histograms of friction difference images, i.e., the number of image pixels within incremental friction-force intervals. Images were collected with the offset and planefit functions disabled, thereby retaining the “zero” value for lateral force and thus the offset of the frictional peak on the friction force axis. All friction peaks were fit with a Gaussian distribution to determine the mean values and error bars (standard deviations of the distributions), as shown in Fig. 2D.
FIG. 2.

Frictional-force images of nonabraded biofilm and histogram of friction differences fit to Gaussian distribution for friction force determination process. (A) Image obtained from scanning left to right (trace); (B) image collected from scanning right to left (retrace); (C) friction force image with subtraction; (D) histogram of friction differences.
(iii) Friction force calibration.
Cut silicon wafers were used as a calibration standard by invoking published values of AFM friction coefficients for a SiOx tip on SiOx as described below. The silicon wafers were cleaned for 10 min in acetone, rinsed with deionized water, and dried by adding a few drops of ethanol to remove excess water. Measurements made during multiple experiments and with multiple cantilevers were performed under identical conditions before and after each biofilm abrasion experiment to ensure that the AFM probe state was unchanged as a result of scanning at a high load (minimal blunting or contamination). A stepped increase in applied load between −25 nN and 200 nN was employed per image on a 2.5- by 2.5-μm region of silicon (Fig. 3). In each case, the plot of raw friction force in volts versus the applied load in nN was well reproduced by a linear fit, consistent with Amontons's Law (generalized to include additive adhesive load) (15), with the slope  determined in units of V/nN. This slope is equal to the “to-be-determined” apparatus coefficient α (V/nN, specific to each tip/cantilever and laser/photodiode setup) times the actual dimensionless friction coefficient obtained by
  (0.19 ± 0.1, averaged from data obtained by Buenviaje et al. [10] and Putman et al. [32]), where Ff is the friction force and Fn is the total normal force due to applied and additive adhesive loads. Thus, all raw friction force values (in volts) measured during biofilm abrasion within a given experimental setup were divided by the value for
 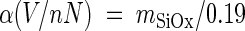 to convert them to calibrated friction force levels in units of nN.
FIG. 3.

Friction force as a function of applied load on silicon used as a calibration standard. Triangle symbols, calibration done prior to experiments on biofilm; circle symbols, results obtained after biofilm abrasion.
RESULTS
Topographic and friction force images of nonabraded biofilm are shown in Fig. 4. A low-magnification topographic image of a biofilm region shows different cell shapes with a random distribution in the biofilm matrix (Fig. 4A). The region between the microbial cells was imaged by increasing the magnification (Fig. 4B). The heterogeneous structure of biofilms is revealed by the friction force image presented in Fig. 4C, where different shades represent materials exerting different friction forces.
FIG. 4.

Topographic and friction force images of nonabraded biofilm. (A) Low-magnification topographic image (23 by 23 μm; contrast range, 0.25 μm); (B) high-magnification topographic image (2 by 2 μm; contrast range, 1 μm) showing microbial cells inside the biofilm matrix; (C) corresponding friction image. Images were collected from left to right (trace) at an ∼0-nN applied load.
Topographic images exhibiting a 2.5- by 2.5-μm abraded biofilm region are presented in Fig. 5A. These images show that the depth of abrasion increased with raster scan number. The cumulative volume of biofilm displaced plotted against the scan number is presented in Fig. 5B. The mean volume of biofilm material displaced per scan was 0.11 ± 0.07 μm3. Friction force calibration runs on silicon before and after biofilm abrasion showed no significant differences (Fig. 3), indicating a stable tip state through the course of abrasive scanning.
FIG. 5.

(A) Successive topographic images (contrast range, 0.3 μm) exhibiting a 2.5- by 2.5-μm abraded biofilm region via a raster-scanned tip. Images were collected from left to right at an ∼0-nN applied load force. (B) Cumulative volumes of biofilm material displaced as a function of scan number. Error bars represent the standard deviations obtained from four independent biofilms grown without calcium (n = 4).
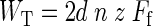
The total frictional-energy dissipation (WT) during a succession of z raster scans is given by the following equation, where d is the length of each scan line (times 2 for over and back), n is the number of scan lines per raster, and Ff (nN) is the calibrated friction force.
 |
To obtain the cohesive energy value (ɛcoh), we must account for the portion of frictional-energy dissipation that does not contribute to biofilm displacement, being instead lost as heat (Wh). To determine a value for Wh, we scanned the biofilm surface at increasing applied loads, ranging from 0 to 40 nN (Table 1). In all cases, we observed no biofilm displacement after one raster scan (data not shown). Displacement occurred only at 40 nN within the second raster scan. We assume that some frictional-energy dissipation is always present in the form of “lost” energy (Wh), even for later scans where displacement also occurs. Thus, we estimate the frictional-energy dissipation that produces biofilm displacement during each raster scan by subtracting the value measured during the first scan, which was assumed to represent only “lost” energy (Wh). Following this subtraction, the total frictional-energy dissipation was summed from each set of four consecutive raster scans and normalized by the volume of material displaced to obtain the value for biofilm cohesive energy per unit volume. This value is given by the following equation, where V is the volume of biofilm displaced per four-raster abrasion.
 |
Table 2 summarizes our results, providing values for the volume of biofilm material displaced, the friction force, the energy dissipated contributing to decohesion, and the corresponding cohesive energy as a function of scan number for four independent biofilms. The cohesive energy levels of biofilms grown with and without calcium addition (10 mM) are given in Fig. 6A, along with the average differences between the two values, plotted as functions of scan number (Fig. 6B). The cohesive energy level of the biofilm was 0.10 ± 0.07 nJ/μm3 during the abrasion process until a depth of 0.33 μm was reached. As the biofilm was abraded beyond this depth, the biofilm cohesive energy level increased to 2.05 ± 0.62 nJ/μm3. The reasons for this reproducible increase in cohesive energy with depth are not clear. In the presence of calcium, the biofilm cohesive energy level was relatively constant and ∼18 times higher than that for the biofilm grown without calcium addition for the first 16 scans. Our results show a relatively constant and higher effect of calcium absorption on the cohesive energy of the EPS matrix and a lower effect of calcium absorption near the microbial cell surface (Fig. 6B). This could indicate that outer EPS layers are more loosely associated with one another, providing more opportunity for calcium absorption and cross-linking in these layers, whereas deeper EPS layers are more tightly associated with cells and therefore contain less calcium, even if present in the feed. More research is needed to understand this phenomenon.
TABLE 1.
Frictional energy dissipation, measured in the absence of biofilm displacement, as a function of applied loads
| Applied load (nN) | Friction energy dissipation (pJ) |
|---|---|
| 0 | 0.10 ± 0.05 |
| 8 | 0.06 ± 0.03 |
| 16 | 0.23 ± 0.04 |
| 24 | 0.18 ± 0.06 |
| 32 | 0.32 ± 0.05 |
| 40 | 0.24 ± 0.05 |
TABLE 2.
Summary of results obtained from four independent biofilms grown without calcium addition
| Sample | Scan no. | Vol displaced after 4 raster abrasions (μm3) | Friction forcea (nN) | Frictional energy dissipatedb (pJ) | Cohesive energyc (pJ/μm3) |
|---|---|---|---|---|---|
| Biofilm 1 | 4 | 1.090 | 3.49 | 16.89 | 15.5 |
| 8 | 0.156 | 2.37 | 22.32 | 143.1 | |
| 12 | 0.137 | 2.31 | 32.53 | 235.7 | |
| 16 | 0.893 | 4.85 | 95.42 | 106.7 | |
| 20 | 0.106 | 5.25 | 129.63 | 1,222.9 | |
| Biofilm 2 | 4 | 0.663 | 5.33 | 26.31 | 39.7 |
| 8 | 0.250 | 3.54 | 34.32 | 137.3 | |
| 12 | 0.075 | 1.35 | 17.86 | 238.1 | |
| 16 | 0.838 | 3.45 | 66.85 | 79.8 | |
| 20 | 0.062 | 6.44 | 160.02 | 2,560.3 | |
| Biofilm 3 | 4 | 0.981 | 6.36 | 31.61 | 32.2 |
| 8 | 0.480 | 4.24 | 41.55 | 86.4 | |
| 12 | 0.325 | 1.69 | 23.08 | 71.1 | |
| 16 | 0.506 | 1.73 | 31.70 | 62.6 | |
| 20 | 0.044 | 3.08 | 74.16 | 1,693.1 | |
| Biofilm 4 | 4 | 0.544 | 3.57 | 17.31 | 31.8 |
| 8 | 0.631 | 3.05 | 29.29 | 46.4 | |
| 12 | 0.363 | 3.86 | 56.40 | 155.4 | |
| 16 | 0.688 | 4.39 | 86.09 | 125.1 | |
| 20 | 0.062 | 6.85 | 170.48 | 2,727.7 |
The slope  was 0.0012 ± 0.0002 V/nN.
Frictional energy dissipated = WT − Wh. The length of each scan line was 2.5 μm, and the number of scan lines per raster was 256.
Cohesive energy (εcoh) = (WT − Wh)/V.
FIG. 6.

Cohesive energy values (ɛcoh) of biofilms grown without and with calcium (10 mM) (A) and the differences (B) plotted as a function of scan number. Error bars represent the standard deviations obtained from four independent biofilms (n = 4).
DISCUSSION
Because of difficulties associated with the soft and gelatinous nature of biofilm, most of the methods used to ascertain biofilm strength and cohesion properties are based on the rheological and viscoelastic properties of a biofilm. Data reported in the literature are summarized in Table 3. A variety of physical parameters have been used by others to approach the cohesive character of biofilms. Among them, the apparent elastic and shear moduli, the tensile and yield strengths, and the adhesive strength have been mostly reported. Another level of difficulty associated with the comparison of these results is the variety in the types and the ages of biofilms investigated. The variety of deformations imposed on the biofilms by use of custom devices could also explain the broad range of data reported. Moreover, some data are descriptive of biofilm cohesion (EPS- and cell-cell interactions) and others of biofilm adhesion (biofilm and substratum interactions), and the rest quantify a modulus that by definition describes an elastic (reversible) response rather than a yield (irreversible) response; therefore, they are not truly assessing cohesive or adhesive strength. Here, we developed a relatively simple method using commercially available and widely accessible instrumentation (AFM) for reproducibly measuring the cohesion, or level of cohesive energy per unit volume of biofilm, in situ.
TABLE 3.
Summary of data and methods previously used to determine the cohesive character of biofilms
| Parameter measured | Type of biofilm | Age (days) | Device | Value (N/m2) | Reference |
|---|---|---|---|---|---|
| Apparent elastic modulus | P. aeruginosa SG81 | 1 | Rheometer based on uniaxial compression | 6,500 | 22 |
| P. aeruginosa PAO1 | 12 | Reactor system based on fluctuation in fluid shear | 17-40 | 37 | |
| Mixed culture | 12 | Rotating disk rheometer | 0.2-24 | 40 | |
| Shear modulus | Mixed culture | 60-100 | Collision device | 50-600 | 27 |
| Mixed culture | 23 | Reactor system based on fluctuation in fluid shear | 27 | 37 | |
| Not specified | 1-50 | Tensile test device based on biofilm breakage | 500-1,000 | 28 | |
| Tensile strength | P. aeruginosa | 5 | Glass micropipette based on separation by suction | 395-15,640 | 31 |
| Mixed culture | 60-100 | Rotating device | 1-7 | 27 | |
| Yield strength | P. aeruginosa SG81 | 1 | Rheometer based on uniaxial compression device | 980 | 22 |
| Adhesive strength | P. fluorescens | 10-27 | T-shaped probe | 0.3-0.6a | 11 |
This value is expressed in J/m2.
The method described herein is designed to determine the cohesive energy of biofilm over a defined volume of material. Existing techniques truly assessing cohesive or adhesive strength probe interfacial yield in which only a threshold force is measured over an apparent interfacial area. One problem with this is that the true interfacial area is unknown (i.e., one does not know the interfacial shape and morphology at the nanoscale level). In addition, because the force-versus-displacement relationship is not integrated, the imparted strain energy up to and through yield is not tallied. Our method incorporates all of the energy used to displace the biofilm in the cohesive energy calculation. Another advantage to our method is that many researchers have access to AFM, allowing this method to be easily replicated by others. Furthermore, because simple yet reproducible biofilm preparation steps are performed to control humidity levels in the biofilm, others should be able to follow these procedures as well. Indeed, experiments replicated with four individually grown biofilms gave cohesive energy values of 0.10 ± 0.07 nJ/μm3 until a depth of 0.33 μm and 2.05 ± 0.62 nJ/μm3 beyond this depth. When calcium was added to the bioreactor, the biofilm cohesive energy value increased from 0.10 ± 0.07 nJ/μm3 to an average of 1.98 ± 0.34 nJ/μm3. This is not surprising, since previous reports showed that calcium plays a role in the cohesiveness of microbial aggregates and biofilms (12, 20). It is known that microbial cells in biofilms produce EPS mostly composed of polysaccharides, proteins, and nucleic acids, which forms a protective gel-like matrix around cells (9, 26, 44). The EPS interactions with surrounding material and the substrata involve salt bridges between cations within the matrix and the anionic functional groups of the exopolymers (e.g., the carboxyl, phosphate, sulfate, glycerate, pyruvate, and succinate groups). In particular, the affinities of anionic ligands for multivalent ions, such as Ca2+, Cu2+, Mg2+, and Fe3+, can be very strong (4, 24). The consistency of our results with the literature demonstrates the utility of this AFM-based technique. In addition, the ability to use this method with intact biofilm, rather than biofilm that has been removed from the substratum upon which it was grown, allows the determination of cohesion on an unperturbed sample, which is critical for improving our understanding of in situ biofilm cohesion and detachment.
Future work using this reproducible and relatively simple method will help develop a better understanding of how to control biofilm thickness and sloughing. This method could also be used to investigate biofilms subjected to treatment with different biocides in order to determine how best to remove them. Such research will improve our understanding of biofilm cohesion and help to design new strategies for controlling biofilm development.
Acknowledgments
This work was supported by the National Science Foundation under the GOALI Program (BES-0331953).
We also thank 3M Corporate (Saint Paul, MN) for providing materials and services.
Footnotes
Published ahead of print on 2 March 2007.
REFERENCES
- 1.Ahimou, F., L. P. Mok, B. Bardot, and C. Wesley. 2005. The adhesion force of Notch with Delta and the rate of Notch signaling. J. Cell Biol. 67:1217-1229. [DOI] [PMC free article] [PubMed] [Google Scholar]
- 2.Ahimou, F., F. A. Denis, A. Touhami, and Y. F. Dufrêne. 2002. Probing microbial cell surface charges by atomic force microscopy. Langmuir 18:9937-9941. [Google Scholar]
- 3.Aoike, T., T. Yamamoto, H. Uehara, T. Yamanobe, and T. Komoto. 2001. Surface deformation properties of polystyrene as evaluated from the morphology of surfaces scratched by using the tip of a scanning force microscope. Langmuir 17:5688-5692. [Google Scholar]
- 4.Beech, I. B., and J. Sunner. 2004. Biocorrosion: towards understanding interactions between biofilms and metals. Curr. Opin. Biotechnol. 15:181-186. [DOI] [PubMed] [Google Scholar]
- 5.Beech, I. B., J. R. Smith, A. A. Steele, I. Penegar, and S. A. Campbell. 2002. The use of atomic force microscopy for studying interactions of bacterial biofilms with surfaces. Colloids Surf. B 23:231-247. [Google Scholar]
- 6.Benoit, M., D. Gabriel, G. Gerisch, and H. E. Gaub. 2000. Discrete interaction in cell adhesion measured by single-molecule force spectroscopy. Nat. Cell Biol. 2:313-317. [DOI] [PubMed] [Google Scholar]
- 7.Bhushan, B., A. V. Kulkarni, V. N. Koinkar, M. Boehm, L. Odoni, C. Martelet, and M. Belin. 1995. Microtribological characterization of self-assembled and Langmuir-Blodgett monolayer by atomic and friction force microscopy. Langmuir 11:3189-3198. [Google Scholar]
- 8.Bolshakova, A. V., O. I. Kiselyova, and I. V. Yaminsky. 2004. Microbial surfaces investigated using atomic force microscopy. Biotechnol. Prog. 20:1615-1622. [DOI] [PubMed] [Google Scholar]
- 9.Bonthrone, K. M., J. Quarmby, C. J. Hewitt, V. J. M. Allan, M. Paterson-Beedle, J. F. Kennedy, and L. E. Macaskie. 2000. The effect of the growth medium on the composition and metal binding behaviour of the extracellular polymeric material of a metal-accumulating Citrobacter sp. Environ. Technol. 21:123-134. [Google Scholar]
- 10.Buenviaje, C. K., S.-R. Ge, M. H. Rafailovich, and R. M. Overney. 1998. Atomic force microscopy calibration methods for lateral force, elasticity, and viscosity. Mater. Res. Soc. Symp. Proc. 522:187-192. [Google Scholar]
- 11.Chen, M. J., Z. Zhang, and T. R. Bott. 2005. Effects of operating conditions on the adhesive strength of Pseudomonas fluorescens biofilms in tubes. Colloids Surf. B 43:61-71. [DOI] [PubMed] [Google Scholar]
- 12.Chen, X., and P. S. Stewart. 2002. Role of electrostatic interactions in cohesion of bacterial biofilms. Appl. Microbiol. Biotechnol. 59:718-720. [DOI] [PubMed] [Google Scholar]
- 13.Dietzel, D., S. Marsaudon, J. P. Aimé, C. V. Nguyen, and G. Couturier. 2005. Mechanical properties of a carbon nanotube fixed at a tip apex: a frequency-modulated atomic force microscopy study. Phys. Rev. B 72:035445.1-035445.16. [Google Scholar]
- 14.Emerson, R. J., IV, and T. A. Camesano. 2004. Nanoscale investigation of pathogenic microbial adhesion to a biomaterial. Appl. Environ. Microbiol. 70:6012-6022. [DOI] [PMC free article] [PubMed] [Google Scholar]
- 15.Gao, J., W. D. Luedtke, D. Gourdon, M. Ruths, J. N. Israelachvili, and U. Landman. 2004. Frictional forces and Amonton's law: from the molecular to the macroscopic scale. J. Phys. Chem. B 108:3410-3425. [Google Scholar]
- 16.Hall-Stoodley, L., and P. Stoodley. 2002. Developmental regulation of microbial biofilms. Curr. Opin. Biotechnol. 13:228-233. [DOI] [PubMed] [Google Scholar]
- 17.Hammerschmidt, J. A., B. Moasser, W. L. Gladfelter, G. Haugstad, and R. R. Jones. 1996. Polymer viscoelastic properties measured by friction force microscopy. Macromolecules 29:8996-8998. [Google Scholar]
- 18.Haugstad, G., J. A. Hammerschmidt, and W. L. Gladfelter. 2001. Viscoelasticity in nanoscale friction on thin polymer films, p. 230. In J. Frommer and R. M. Overney (ed.), Interfacial properties on the submicron scale, vol. 781. ACS Books, Washington, DC. [Google Scholar]
- 19.Haugstad, G., W. L. Gladfelter, E. B. Weberg, R. T. Weberg, and R. R. Jones. 1995. Probing molecular relaxation on polymer surface with friction force microscopy. Langmuir 11:3473-3482. [Google Scholar]
- 20.Higgins, M. J., and J. T. Novak. 1997. The effect of cations on the setting and dewatering of activated sludges: laboratory results. Water Environ. Res. 69:215-224. [Google Scholar]
- 21.Kolari, M., U. Schmidt, E. Kuismanen, and M. S. Salkinoja-Salonen. 2002. Firm but slippery attachment of Deinococcus geothermalis. J. Bacteriol. 184:2473-2480. [DOI] [PMC free article] [PubMed] [Google Scholar]
- 22.Körstgens, V., H. C. Flemming, J. Wingender, and W. Borchard. 2001. Uniaxial compression measurement device for investigation of the mechanical stability of biofilms. J. Microbiol. Methods 46:9-17. [DOI] [PubMed] [Google Scholar]
- 23.Mayer, C., R. Moritz, C. Kirschner, W. Borchard, R. Maibaum, J. Wingender, and H. C. Flemming. 1999. The role of intermolecular interactions: studies on model systems for bacterial biofilms. Int. J. Biol. Macromol. 26:3-16. [DOI] [PubMed] [Google Scholar]
- 24.McLean, R. J. C., and T. J. Beveridge. 1990. Metal-binding capacity of bacterial surfaces and their ability to form mineralized aggregates, p. 185-222. In H. L. Ehrlich and C. L. Brierley (ed.), Microbial mineral recovery, McGraw-Hill, New York, NY.
- 25.Mendez-Vilas, A., A. M. Gallardo-Moreno, M. L. Gonzalez-Marin, R. Calzado-Montero, M. J. Bruque, and C. Perez-Giraldo. 2004. Surface characterization of two strains of Staphylococcus epidermidis with different slime—production by AFM. Appl. Surf. Sci. 238:18-23. [Google Scholar]
- 26.Neu, T. R., and K. C. Marshall. 1991. Microbial ‘footprints’—a new approach to adhesive polymers. Biofouling 3:101-112. [Google Scholar]
- 27.Ohashi, A., and H. Harada. 1996. A novel concept for evaluation of biofilm adhesion strength by applying tensile force and shear force. Water Sci. Technol. 34:201-211. [Google Scholar]
- 28.Ohashi, A., T. Koyama, K. Syutsubo, and H. Harada. 1999. A novel method for evaluation of biofilm tensile strength resisting erosion. Water Sci. Technol. 39:261-268. [Google Scholar]
- 29.O'Toole, G. A. 2003. Build a biofilm. J. Bacteriol. 185:2687-2689. [DOI] [PMC free article] [PubMed] [Google Scholar]
- 30.Patrauchan, M. A., S. Sarkisova, K. Sauer, and M. J. Franklin. 2005. Calcium influences cellular and extracellular product formation during biofilm-associated growth of a marine Pseudoalteromonas sp. Microbiology 151:2885-2897. [DOI] [PubMed] [Google Scholar]
- 31.Poppele, E. H., and R. M. Hozalski. 2003. Micro-cantilever method for measuring the tensile strength of biofilms and microbial flocs. J. Microbiol. Methods 55:607-615. [DOI] [PubMed] [Google Scholar]
- 32.Putman, C., M. Igarashi, and R. Kaneko. 1995. Quantitative determination of friction coefficients by friction force microscopy. Jpn. J. Appl. Phys. 34:L264-L267. [Google Scholar]
- 33.Schmidt, R. H., G. Haugstad, and W. L. Gladfelter. 2003. Scan-induced patterning in glassy polymer films: using scanning force microscopy to study plastic deformation at the nanometer length scale. Langmuir 19:898-909. [Google Scholar]
- 34.Snaidr, J., R. Amann, I. Huber, W. Ludwig, and K. H. Schleifer. 1997. Phylogenetic analysis and in situ identification of bacteria in activated sludge. Appl. Environ. Microbiol. 63:2884-2896. [DOI] [PMC free article] [PubMed] [Google Scholar]
- 35.Steinberger, R. E., A. R. Allen, H. G. Hansma, and P. A. Holden. 2002. Elongation correlates with nutrient deprivation in Pseudomonas aeruginosa—unsaturated biofilms. Microb. Ecol. 43:416-423. [DOI] [PubMed] [Google Scholar]
- 36.Stoodley, P., S. Wilson, L. Hall-Stoodley, J. D. Boyle, H. M. Lappin-Scott, and J. W. Costerton. 2001. Growth and detachment of cell clusters from mature mixed-species biofilms. Appl. Environ. Microbiol. 67:5608-5613. [DOI] [PMC free article] [PubMed] [Google Scholar]
- 37.Stoodley, P., Z. Lewandowski, J. D. Boyle, and H. M. Lappin-Scott. 1999. Structural deformation of bacterial biofilms caused by short-term fluctuations in fluid shear: an in situ investigation of biofilm rheology. Biotechnol. Bioeng. 65:83-92. [PubMed] [Google Scholar]
- 38.Thormann, K. M., R. M. Saville, S. Shukla, and A. M. Spormann. 2005. Induction of rapid detachment in Shewanella oneidensis MR-1 biofilms. J. Bacteriol. 187:1014-1021. [DOI] [PMC free article] [PubMed] [Google Scholar]
- 39.Thormann, K. M., R. M. Saville, S. Shukla, D. A. Pelletier, and A. M. Spormann. 2004. Initial phases of biofilm formation in Shewanella oneidensis MR-1. J. Bacteriol. 186:8096-8104. [DOI] [PMC free article] [PubMed] [Google Scholar]
- 40.Towler, B. W., C. J. Rupp, A. B. Cunningham, and P. Stoodley. 2003. Viscoelastic properties of a mixed culture biofilm from rheometer creep analysis. Biofouling 19:279-285. [DOI] [PubMed] [Google Scholar]
- 41.van der Mei, H. C., H. J. Busscher, R. Bos, J. de Vries, C. J. Boonaert, and Y. F. Dufrêne. 2000. Direct probing by atomic force microscopy of the cell surface softness of a fibrillated and nonfibrillated oral streptococcal strain. Biophys. J. 78:2668-2674. [DOI] [PMC free article] [PubMed] [Google Scholar]
- 42.Watnick, P. I., and R. Kolter. 1999. Steps in the development of a Vibrio cholerae El Tor biofilm. Mol. Microbiol. 34:586-595. [DOI] [PMC free article] [PubMed] [Google Scholar]
- 43.Werner, E., F. Rose, A. Bugnicourt, M. J. Franklin, A. Heydorn, S. Molin, B. Pitts, and P. S. Stewart. 2004. Stratified growth in Pseudomonas aeruginosa biofilms. Appl. Environ. Microbiol. 70:6188-6196. [DOI] [PMC free article] [PubMed] [Google Scholar]
- 44.Whitfield, C. 1988. Bacterial extracellular polysaccharides. Can. J. Microbiol. 34:415-420. [DOI] [PubMed] [Google Scholar]