

Abstract
OBJECTIVE
The two objectives of this study were to create an ex vivo phantom model that closely mimics human breast cancer for detection tasks and to compare the performance of full-field digital mammography with screen-film mammography in detecting and characterizing small breast masses in a phantom with a spectrum of complex tissue backgrounds.
MATERIALS AND METHODS
Sixteen phantom breast masses of varying sizes (0.3–1.2 cm), shapes (round and irregular), and densities (high and low) were created from shaved tumor specimens and imaged using both full-field digital and screen-film mammography techniques. We created 408 detection tasks that were captured on 68 films. On each radiograph, six detection tasks were partially obscured by areas of varying breast-pattern complexity, including low (predominantly fatty), mixed (scattered fibroglandular densities and heterogeneously dense), and high (extremely dense) density patterns. Each detection task was scored using a five-point confidence scale by three mammographers. Receiver operating characteristic (ROC) curve analysis was performed to analyze differences in detection of masses between the two imaging systems, and sensitivity, specificity, positive predictive value, negative predictive value, and accuracy were computed.
RESULTS
Full-field digital mammography showed higher area under the ROC curve than screen-film mammography for detecting masses in each breast background and performed significantly better than screen-film mammography in mixed (p = 0.010), dense (p = 0.029), and all breast backgrounds combined (p = 0.004). Full-field digital mammography was superior to screen-film mammography for characterizing round and irregular masses and low- and high-density masses.
CONCLUSION
Full-field digital mammography was significantly superior to screen-film technique for detecting and characterizing small masses in mixed and dense breast backgrounds in a phantom model.
Keywords: breast neoplasms, breast radiography, digital radiography, phantoms
Results of both randomized controlled clinical trials and meta-analyses have shown that screen-film mammographic screening in women 40 years old and older may reduce the breast cancer mortality rate by up to 45% [1–3]. This decrease in the mortality rate has been attributed to the ability of screen-film mammography to identify cancers early when they appear as small, nonpalpable masses, calcifications, or both. The effectiveness of screen-film mammography is limited by its narrow dynamic range, low contrast resolution, image noise, and film processing artifacts that contribute to a known false-negative rate of up to 10% in the detection of breast cancer [4, 5]. An effort to ameliorate these limitations is an important justification for the development of full-field digital mammography systems. The availability of commercial full-field digital mammography systems for clinical use has made it possible to directly compare the performance of screen-film and full-field digital imaging systems [6–9]. Several recent studies have shown the ability of full-field digital mammography to detect and characterize calcifications [10–12], but few studies have specifically assessed the ability of full-field digital mammography to detect and characterize breast masses [13, 14].
Because the reduction in the breast cancer mortality rate with screening mammography is partly due to the identification of small non-palpable masses, it is important to quantitate the detectability of small masses using full-field digital mammography and to compare its performance with that of screen-film mammography, the current standard, thereby validating the role of the newer imaging technique in routine breast cancer screening.
Our hypothesis was that the lower resolution (100-μm pixel size) but higher detection efficiency of the flat-panel detector used in full-field digital mammography provided equivalent or superior detection of phantom masses smaller than 1 cm relative to those obtained with screen-film mammography. To test this hypothesis, we designed a study to create simulated tissue-equivalent mass phantoms of various sizes, shapes, and thicknesses; produce full-field digital mammography and screen-film mammography image test sets by performing specimen radiography of phantom breast masses; perform reviewer studies of mass-detection tasks in a spectrum of complex simulated breast backgrounds; and analyze receiver operating characteristic (ROC) curves and calculate sensitivity, specificity, positive predictive value (PPV), negative predictive value (NPV), and accuracy in the detection of simulated masses using both imaging systems.
Materials and Methods
Creation of Simulated Tissue-Equivalent Mass Phantoms
Customized breast-mass phantoms were created to assess three variables: size, shape, and thickness (density). Surgically excised specimens of neoplasms were obtained from our pathology laboratory and cut using a punch biopsy device (Biopsy Punch, Fray Products) to produce round discs of tissue (simulating circumscribed benign masses) with diameters of 0.3, 0.6, 0.9, and 1.2 cm. A scalpel was used to cut a subset of the round discs into irregular star-shaped masses (simulating spiculated malignant masses), also with diameters of 0.3, 0.6, 0.9, and 1.2 cm. Thick (0.5-cm) and thin (0.2-cm) specimens were used to achieve two density levels for each round or irregular mass. In total, 16 different phantom breast masses were created from shaved tumor specimens and imaged using both full-field digital mammography and screen-film mammography systems. Our institutional review board approved this protocol, and a waiver of informed consent was obtained for this laboratory research.
Specimen Radiography of Phantom Breast Masses
The setup for specimen radiography is illustrated in Figures 1 and 2. Three components were assembled in three layers. Layer 1 consisted of a supporting base layer of clear film that was placed on the bucky, with permanent fiduciary ink marks made in three corners of the film. Two supporting rails made of polymerized methyl methacrylate (Lucite, Lucite International) (0.6-cm thick and 2.5-cm wide) were placed at the periphery of the imaging field to fit the anthropomorphic phantom. Layer 2 consisted of clear film with six designated locations marked by circles for placement of phantom breast masses. Before imaging, the simulated masses were attached to layer 2 at the six selected locations. This second layer was placed on the supportive plate (layer 1), and the fiduciary marks were aligned. Layer 3, the anthropomorphic breast phantom, was placed onto the supportive rails to ensure that the masses on layer 2 were not squashed during imaging. The anthropomorphic breast phantom (RMI 165, Gammex) had an effective thickness of 5 cm and was used to simulate a spectrum of complex breast backgrounds [15] (Fig. 2).
Fig. 1.
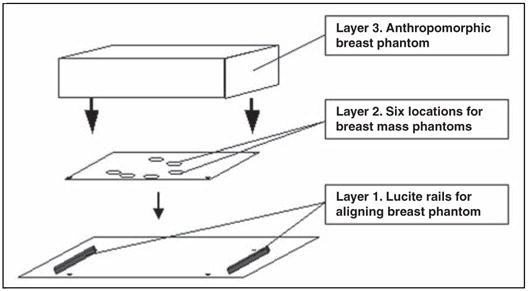
Template of setup for radiography of phantom breast masses. Lucite (polymerized methyl methacrylate) is manufactured by Lucite International.
Fig. 2.

Photograph of setup for radiography of phantom breast masses. Breast phantom (RMI #165) is manufactured by Gammex.
Imaging was performed with a full-field digital mammography system (Senographe 2000D, GE Healthcare) and with a screen-film mammography system (Senographe DMR, GE Healthcare). Thus, each combination of simulated masses was imaged twice (Fig. 3).
Fig. 3.
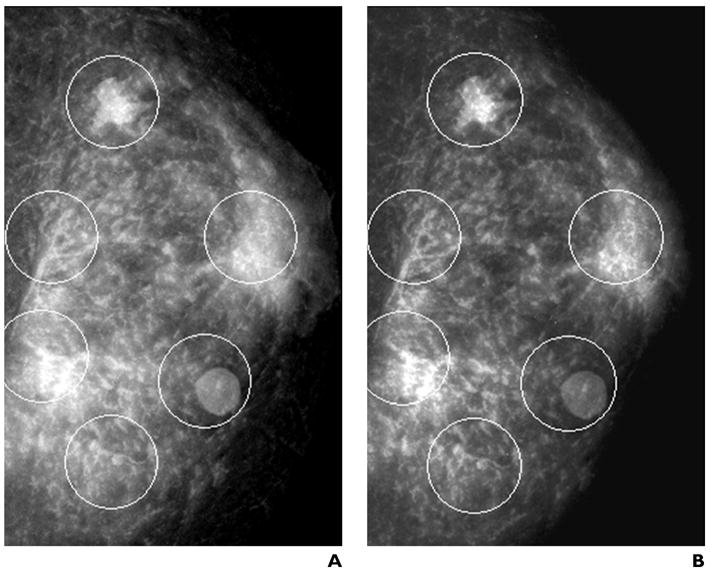
Images of phantom breast masses. Each mammogram has six randomly assigned detection tasks (circles) consisting of true-positives (masses of varying sizes, shapes, and densities) and true-negatives distributed in areas of varying background complexity in the anthropomorphic phantom.
A, Full-field digital mammography.
B, Screen-film mammography.
Images were acquired at 25 kVp and 250 mAs using a molybdenum-molybdenum (Mo-Mo) target filter combination. The source-to-detector distance (66 cm), the beam quality, and the tube output were kept constant (within 2% variance) to achieve a similar mean glandular dose (2.76 mGy for screen-film mammography and 2.74 mGy for full-field digital mammography) and entrance surface exposure (490 μC/kg for screen-film mammography and 511 μC/kg for full-field digital mammography) for both systems, with half-value layers of 0.34-mm aluminium and 0.32-mm aluminium for screen-film mammography and full-field digital mammography, respectively.
The anthropomorphic breast phantom was imaged with the screen-film technique using automatic exposure control. The contrast option was selected under automatic exposure control, with a prescribed recommendation for using Mo-Mo, at 25 kVp and 240 mAs. Because the manual mode was used to acquire images, several images of the anthropomorphic breast phantom were acquired at several different exposure levels (approximately 225–250 mAs), and a consensus selection was made by the radiologists participating in the reviewer study.
Each radiograph contained six detection tasks randomly distributed in areas of varying breast backgrounds in the anthropomorphic breast phantom, including low (predominantly fatty), mixed (scattered fibroglandular densities and heterogeneously dense), and high (extremely dense) tissue densities (Fig. 3). There were 408 detection tasks created and captured on 68 hard-copy films, including 272 true-positives and 136 true-negatives.
Reviewer Studies of Mass-Detection Tasks
For reviewer studies, all full-field digital mammographic images were printed on 8 × 10-inch hard-copy films using a laser printer (Scopix LR5200, Agfa Medical Imaging) and laser film (Scopix LT2 B, Agfa Medical Imaging). Screen-film images were acquired with Min-R 2 cassettes, Min-R 2000 screens, and Min-R 2000 film (Eastman Kodak Company) and were processed with an X-OMAT processor (Eastman Kodak Company). A transparent overlay with six stenciled circles was placed over each hard-copy radiographic image at the time of interpretation. Each circle indicated the general location of one of the six detection tasks. The circle sizes were chosen so that each phantom mass (if present) would be contained within the circle. The circles were produced on unexposed, developed film with the use of a template (Rapidesign R-2040, Berol) and a permanent marker. Fiduciary markings on the overlay ensured proper alignment with the study images.
All hard-copy films were displayed on a motorized mammogram viewer (MS604A, S&S RADX Technology). Screen-film and digital images were randomized for the reviewer study. Two review sessions were conducted with an interval of 2 weeks. Lighting conditions were at viewbox illuminance. All radiologists reviewed images of the anthropomorphic breast phantom without superimposed phantom breast masses to verify that all patterns present in the anthropomorphic breast phantom were rated as true-positive.
The interpretation exercise in this study was separated into two components: the detection of simulated mass phantoms and the classification and characterization of those mass phantoms. For the detection of masses, three experienced mammographers independently reviewed each film and rated the visibility of each detection task using a five-point confidence scale: 1 = definitely not present, 2 = probably not present, 3 = possibly present, 4 = probably present, and 5 = definitely present.
For each detection task with a visibility score of 3 or more, each mammographer also characterized each mass as round or irregular in shape and of high or low density. Therefore, a three-point scale was used for the classification and characterization of mass shape and density: 1 = true-negative, with visibility score of 1 or 2; 2 = visibility score of 3 or greater, with low density or round shape; and 3 = visibility score of 3 or greater, with high density or irregular shape.
Statistical Analysis
A total of 408 scores (six detection tasks per image × 68 images) were collected and recorded from each reviewer. The scores were sorted according to mass size, mass shape, mass density, breast background density, detector system, and reviewer before analysis.
The sensitivity, specificity, PPV, NPV, and accuracy in the detection of masses of different sizes and also in the detection of masses in different breast backgrounds were calculated for full-field digital mammography and screen-film mammography. Confidence level scores of 1 and 2 were considered negative at imaging, and confidence level scores of 3, 4, and 5 were considered positive at imaging in these calculations. The three-point scale previously described was used in the calculation of sensitivity, specificity, PPV, NPV, and accuracy in the detection of masses of different shapes and densities using full-field digital mammography and screen-film mammography. A score of 1 was considered negative at imaging, and score 2 was considered positive at imaging for low-density and round-shaped masses, and score 3 was considered positive at imaging for high-density and irregular-shaped masses.
For visibility of breast masses, ROC analysis (SPSS version 11.5, SPSS) was performed, and the area under the ROC curve was computed for tumor size and confidence level for each imaging system.
Results
The sensitivity, specificity, PPV, NPV, and accuracy in the detection of masses of different sizes for both imaging systems are presented in Table 1. Full-field digital mammography performed significantly better than screen-film mammography for all mass sizes combined, p = 0.004. The sensitivity, specificity, PPV, NPV, and accuracy in the detection of masses in different breast backgrounds are presented in Table 2. Full-field digital mammography performed significantly better than screen-film mammography for the detection of masses in dense breast background (p = 0.029) and in mixed breast background (p = 0.010). The sensitivity, specificity, PPV, NPV, and accuracy in the detection of masses of different shapes are presented in Table 3. Full-field digital mammography performed significantly better than screen-film mammography for the detection of round masses (p = 0.030) and irregular masses (p < 0.001). The sensitivity, specificity, PPV, NPV, and accuracy in the detection of masses of different densities are presented in Table 4. Full-field digital mammography performed significantly better than screen-film mammography for the detection of low-density masses (p = 0.085) and high-density masses (p < 0.001). The summary ROC curves for each imaging system and each confidence level in detecting masses of all sizes are presented in Figure 4.
TABLE 1.
Comparison of Full-Field Digital and Screen-Film Mammographic Techniques in Detecting Phantom Breast Masses of Various Sizes
| Mass Size (cm) | Imaging System | Sensitivity | Specificity | PPV | NPV | Accuracy | AUC | p |
|---|---|---|---|---|---|---|---|---|
| 0.3 | FFDM | 0.693 | 0.829 | 0.660 | 0.954 | 0.815 | 0.797 | 0.022 |
| SFM | 0.725 | 0.697 | 0.492 | 0.953 | 0.703 | 0.756 | ||
| 0.6 | FFDM | 0.893 | 0.829 | 0.728 | 0.982 | 0.837 | 0.917 | 0.108 |
| SFM | 0.879 | 0.697 | 0.551 | 0.977 | 0.722 | 0.886 | ||
| 0.9 | FFDM | 0.899 | 0.785 | 0.681 | 0.988 | 0.800 | 0.915 | 0.397 |
| SFM | 0.903 | 0.702 | 0.591 | 0.979 | 0.726 | 0.894 | ||
| 1.2 | FFDM | 0.994 | 0.829 | 0.740 | 0.998 | 0.847 | 0.991 | 0.033 |
| SFM | 1.000 | 0.694 | 0.574 | 1.000 | 0.727 | 0.982 | ||
| 0.3–1.2 | FFDM | 0.867 | 0.825 | 0.709 | 0.980 | 0.831 | 0.905 | 0.004 |
| SFM | 0.874 | 0.691 | 0.546 | 0.977 | 0.714 | 0.879 | ||
Note—For calculation of sensitivity, specificity, PPV, NPV, and accuracy, confidence level scores of 3, 4, and 5 were considered positive for each imaging system, and confidence level scores of 1 and 2 were considered negative for each imaging system. All p values were calculated based on the difference in AUC between the two mammographic systems using a paired-sample Student’s t test. PPV = positive predictive value, NPV = negative predictive value, AUC = area under the receiver operating characteristic curve, FFDM = full-field digital mammography, SFM = screen-film mammography.
TABLE 2.
Comparison of Full-Field Digital and Screen-Film Mammographic Techniques in Detecting Phantom Breast Masses in Various Breast Backgrounds
| Breast Background | Imaging System | Sensitivity | Specificity | PPV | NPV | Accuracy | AUC | p |
|---|---|---|---|---|---|---|---|---|
| Fatty | FFDM | 0.911 | 0.988 | 0.884 | 0.993 | 0.982 | 0.954 | 0.691 |
| SFM | 0.911 | 0.926 | 0.745 | 0.994 | 0.927 | 0.947 | ||
| Mixed | FFDM | 0.824 | 0.807 | 0.698 | 0.972 | 0.807 | 0.872 | 0.010 |
| SFM | 0.831 | 0.703 | 0.502 | 0.969 | 0.716 | 0.831 | ||
| Dense | FFDM | 0.869 | 0.692 | 0.571 | 0.976 | 0.714 | 0.891 | 0.029 |
| SFM | 0.883 | 0.458 | 0.408 | 0.964 | 0.513 | 0.863 | ||
Note—For calculation of sensitivity, specificity, PPV, NPV, and accuracy, confidence level scores of 3, 4, and 5 were considered positive for each imaging system, and confidence level scores of 1 and 2 were considered negative for each imaging system. All p values were calculated based on the difference in AUC between the two mammographic systems using a paired-sample Student’s t test. PPV = positive predictive value, NPV = negative predictive value, AUC = area under the receiver operating characteristic curve, FFDM = full-field digital mammography, SFM = screen-film mammography.
TABLE 3.
Comparison of Full-Field Digital and Screen-Film Mammographic Techniques in Detecting Phantom Breast Masses of Various Shapes
| Mass Shape | Imaging System | Sensitivity | Specificity | PPV | NPV | Accuracy | AUC | p |
|---|---|---|---|---|---|---|---|---|
| Round | FFDM | 0.925 | 0.822 | 0.721 | 0.989 | 0.834 | 0.776 | 0.030 |
| SFM | 0.940 | 0.687 | 0.564 | 0.990 | 0.717 | 0.629 | ||
| Irregular | FFDM | 0.811 | 0.829 | 0.697 | 0.971 | 0.828 | 0.596 | < 0.001 |
| SFM | 0.811 | 0.695 | 0.526 | 0.964 | 0.712 | 0.490 | ||
Note—For calculation of sensitivity, specificity, PPV, NPV, and accuracy, confidence level scores of 3, 4, and 5 were considered positive for each imaging system, and confidence level scores of 1 and 2 were considered negative for each imaging system. All p values were calculated based on the difference in AUC between the two mammographic systems using a paired-sample Student’s t test. PPV = positive predictive value, NPV = negative predictive value, AUC = area under the receiver operating characteristic curve, FFDM = full-field digital mammography, SFM = screen-film mammography.
TABLE 4.
Comparison of Full-Field Digital and Screen-Film Mammographic Techniques in Detecting Phantom Breast Masses of Various Densities
| Mass Density | Imaging System | Sensitivity | Specificity | PPV | NPV | Accuracy | AUC | p- |
|---|---|---|---|---|---|---|---|---|
| Low | FFDM | 0.741 | 0.822 | 0.661 | 0.961 | 0.814 | 0.484 | 0.085 |
| SFM | 0.748 | 0.685 | 0.498 | 0.954 | 0.696 | 0.414 | ||
| High | FFDM | 0.988 | 0.829 | 0.751 | 0.998 | 0.847 | 0.714 | < 0.001 |
| SFM | 0.995 | 0.697 | 0.587 | 0.998 | 0.731 | 0.621 | ||
Note—For calculation of sensitivity, specificity, PPV, NPV, and accuracy, confidence level scores of 3, 4, and 5 were considered positive for each imaging system, and confidence level scores of 1 and 2 were considered negative for each imaging system. All p values were calculated based on the difference in AUC between the two mammographic systems using a paired-sample Student’s t test. PPV = positive predictive value, NPV = negative predictive value, AUC = area under the receiver operating characteristic curve, FFDM = full-field digital mammography, SFM = screen-film mammography.
Fig. 4.

Receiver operating characteristic curves for full-field digital mammography (solid line) and screen-film mammography (dotted line). For full-field digital mammography, area under the receiver operating characteristic curve (AUC) = 0.905 ± 0.015. For screen-film mammography, AUC = 0.879 ± 0.016.
Discussion
This study of an ex vivo model of breast masses that closely mimics human breast cancer allowed us to compare the performance of full-field digital and screen-film mammographic techniques for detecting and characterizing small phantom breast masses of varying sizes in varying backgrounds. The increased visualization of small masses in a heterogeneously dense breast background using full-field digital mammography may have important clinical implications.
Our findings suggest that full-field digital mammography may partially diminish the problem of dense breast tissue obscuring small, isodense breast cancers and therefore may help to decrease the false-negative rate of mammographic screening.
Mammography is the only method of early detection of nonpalpable breast cancer that has been proven to lead to a significant reduction in breast cancer mortality [16, 17]. Over the past 2 decades, conventional screen-film mammography has become the main tool for detecting and diagnosing early nonpalpable breast cancers. However, some breast cancers cannot be detected by screening with this imaging method. Much of the decreased lesion conspicuity that limits the usefulness of screen-film mammography is due in part to factors inherent to screen-film mammographic technique. Once a screen-film image has been exposed and processed, the film cannot be further manipulated to improve the contrast.
The detection of masses requires a contrast-to-noise ratio that exceeds the threshold value of 3–5 [18]. The contrast-to-noise ratio can be improved by increasing the contrast of the mass to the background contrast level by optimizing the X-ray spectrum, by reducing the noise level by using higher exposures and more efficient detectors, or by using more effective scatter rejection methods. Scattered radiation can greatly decrease the contrast-to-noise ratio, leading to poorer detectability of microcalcifications and soft-tissue masses, particularly in heavily attenuated regions.
A variable in the detection of masses that is less well understood is the overlapping of masses with structures in the background tissue that may obscure the masses. These overlapping tissue structures, although not directly related to the X-ray photon influence at the detector input, can obscure low-contrast objects such as low-density masses in mammographic images and severely limit the diagnostic value of mammography. This is particularly pertinent in mammography of women with dense breasts.
Newer techniques such as full-field digital mammography may theoretically improve the detection and diagnosis of breast cancers because they separate the process of image acquisition from image display and storage, permitting postprocessing. Digital detectors appear to increase lesion conspicuity by improving the efficiency of absorption of X-ray photons and providing a linear response over a wide exposure range and lower system noise. Furthermore, each image can be optimized with postprocessing, thereby improving the visualization of any lesion.
A comparative clinical study involving 4,945 women in whom screening mammography was performed using both full-field digital mammography and screen-film mammography showed equivalent cancer detection rates for the two techniques [6]. This study also showed a 39% increase in the cancer detection rate when full-field digital mammography was used in addition to screen-film mammography and indicated a lower recall rate for screening mammography with the use of digital mammography. The authors speculated that this might be due to the ability of the full-field digital technique to penetrate dense breast parenchyma and thereby better distinguish between normal tissue and occult masses [6]. An extended study including 6,736 women by the same investigators did not confirm the previously reported increase in the cancer detection rate using full-field digital mammography. The authors found that screen-film mammography detected more cancers (presenting as both masses and calcifications) than full-field digital mammography, although the difference was not statistically significant [7].
Digital mammography is likely to be interpreted in a soft-copy format in the near future. A significant limitation of this study is that all digital images were reviewed on hard-copy films rather than on a workstation. This was due to the lack of workstation setup and stability at the time that this study was performed. Although the limitations of printed digital images in this study were minimized by careful windowing and leveling before printing, it is possible that the postprocessing abilities of digital mammography interpretation might affect the diagnostic test performance. The advantages and disadvantages of workstation monitors that affect image presentation are therefore not included in this study.
A further limitation of this study is that presenting reviewers with six tasks on a single film for interpretation, each delineated by a circle, may overestimate both sensitivity and specificity. Reviewers may be directed to look more closely at the designated area when compared with an unmarked film, thereby inflating sensitivity, and they may be less likely to misinterpret an abnormality outside the circle, thereby inflating specificity. This format was, however, selected to increase detection tasks per film and to decrease reviewer burden, while accumulating a large number of detection tasks.
Finally, the PPV, NPV, and accuracy are values that are dependent on the prevalence of disease in the study population. This is especially true in this study, in which the prevalence of disease is 67% (272/408), far higher than would be expected in a general screening population. On the other hand, the sensitivity, specificity, and area under the ROC are parameters that are independent of disease prevalence and are therefore more meaningful values in this study.
If the use of full-field digital mammography is to become widespread, its performance characteristics for the most difficult tasks must be well understood. Thus, its detection capability for small borderline masses in anatomic regions of the breast that are difficult to image, particularly the heterogeneously and extremely dense regions, needs to be studied. If full-field digital technique is to replace screen-film mammography for routine screening or in the diagnostic evaluation of possible abnormalities identified at screening, its performance must be at least equivalent to screen-film mammography. In addition, any advantages of full-field digital mammography should be known and explored. If full-field digital mammography is able to more accurately characterize normal features masquerading as pseudomasses, its use could lead to fewer false-positive screening results and unnecessary recalls. If full-field digital mammography is better able to detect true masses, its use could lead to more true-positive results and fewer false-negative results and to increased detection of small breast cancers, especially in breasts with dense parenchyma. The initial results of this phantom study are encouraging. Determining the potential clinical effect of the apparently improved detectability of small breast masses with the use of full-field digital mammography will require further study in a large clinical population over a long time period.
References
- 1.Garne JP, Aspergen K, Balldin G, Ranstam J. Increasing incidence of and declining mortality from breast carcinoma: trends in Malmo, Sweden, 1961–1992. Cancer. 1997;79:69–74. [PubMed] [Google Scholar]
- 2.Wald N, Chamberlin J, Hackshaw A, et al. Consensus conference on breast cancer screening. Paris, February 4–5, 1993: report of the Evaluation Committee. Oncology. 1994;51:380–389. doi: 10.1159/000227370. [DOI] [PubMed] [Google Scholar]
- 3.Fletcher SW, Black W, Harris R, et al. Report of the International Workshop on Screening for Breast Cancer. J Natl Cancer Inst. 1993;85:1644–1656. doi: 10.1093/jnci/85.20.1644. [DOI] [PubMed] [Google Scholar]
- 4.Baker LH. Breast Cancer Detection Demonstration Project: five-year summary report. CA Cancer J Clin. 1982;32:194–225. doi: 10.3322/canjclin.32.4.194. [DOI] [PubMed] [Google Scholar]
- 5.Feig SA, Shaber GS, Patchefsky A, et al. Analysis of clinically occult and mammographically occult breast tumors. AJR. 1977;128:403–408. doi: 10.2214/ajr.128.3.403. [DOI] [PubMed] [Google Scholar]
- 6.Lewin JM, Hendrick RE, D’Orsi CJ, et al. Comparison of full-field digital mammography and screen-film mammography for cancer detection: results of 4,945 paired examinations. Radiology. 2001;218:873–880. doi: 10.1148/radiology.218.3.r01mr29873. [DOI] [PubMed] [Google Scholar]
- 7.Lewin JM, D’Orsi CJ, Hendrick RE, et al. Clinical comparison of full-field digital mammography and screen-film mammography for detection of breast cancer. AJR. 2002;179:671–677. doi: 10.2214/ajr.179.3.1790671. [DOI] [PubMed] [Google Scholar]
- 8.Berns EA, Hendrick RE, Cutter GR. Performance comparison of full-field digital mammography to screen-film mammography in clinical practice. Med Phys. 2002;29:830–834. doi: 10.1118/1.1472497. [DOI] [PubMed] [Google Scholar]
- 9.Kuzmiak CM, Millnamow GA, Qaqish B, Pisano ED, Cole EB, Brown ME. Comparison of full-field digital mammography to screen-film mammography with respect to diagnostic accuracy of lesion characterization in breast tissue biopsy specimens. Acad Radiol. 2002;9:1378–1382. doi: 10.1016/s1076-6332(03)80664-5. [DOI] [PubMed] [Google Scholar]
- 10.Chan HP, Helvie MA, Petrick N, et al. Digital mammography: observer performance study of the effects of pixel size on the characterization of malignant and benign microcalcifications. Acad Radiol. 2001;8:454–466. doi: 10.1016/S1076-6332(03)80616-5. [DOI] [PubMed] [Google Scholar]
- 11.Rong XJ, Shaw CC, Johnston DA, et al. Microcal-cification detectability for four mammographic detectors: flat-panel, CCD, CR, and screen/film. Med Phys. 2002;29:2052–2061. doi: 10.1118/1.1500768. [DOI] [PubMed] [Google Scholar]
- 12.Lai C-J, Whitman GJ, Yang WT, Shaw CC. Comparison of mammographic imaging systems in the detection of simulated microcalcifications: flat panel, CCD, and screen/film combination. Med Phys. 2002;29:1935–1936. [Google Scholar]
- 13.Hemminger BM, Zong S, Muller KE, et al. Improving the detection of simulated masses in mammograms through two different image-processing techniques. Acad Radiol. 2001;8:845–855. doi: 10.1016/s1076-6332(03)80762-6. [DOI] [PubMed] [Google Scholar]
- 14.Hermann KP, Obenauer S, Funke M, Grabbe EH. Magnification mammography: a comparison of full-field digital mammography and screen-film mammography for the detection of simulated small masses and microcalcifications. Eur Radiol. 2002;12:2188–2191. doi: 10.1007/s00330-002-1356-8. [DOI] [PubMed] [Google Scholar]
- 15.Caldwell CB, Yaffe MJ. Development of an anthropomorphic breast phantom. Med Phys. 1990;17:273–280. doi: 10.1118/1.596506. [DOI] [PubMed] [Google Scholar]
- 16.Tabar L, Yen MF, Vitak B, Chen HH, Smith RA, Duffy SW. Mammography service screening and mortality in breast cancer patients: 20-year follow-up before and after introduction of screening. Lancet. 2003;361:1405–1410. doi: 10.1016/S0140-6736(03)13143-1. [DOI] [PubMed] [Google Scholar]
- 17.Duffy SW, Tabar L, Chen HH, et al. The impact of organized mammography service screening on breast carcinoma mortality in seven Swedish counties. Cancer. 2002;95:458–469. doi: 10.1002/cncr.10765. [DOI] [PubMed] [Google Scholar]
- 18.Barten PGJ. Model for the spatial contrast sensitivity of the eye. In: Barten PGJ, editor. Contrast sensitivity of the human eye and its effects on image quality. Bellingham, WA: The International Society for Optical Engineering (SPIE) Press; 1999. pp. 27–66. [Google Scholar]