

Abstract
Fourier transform Infrared (FT-IR) imaging and microspectroscopy have been extensively applied to the analyses of tissues in health and disease. Spatially resolved mid-infrared data has provided insights into molecular changes that occur in diseases of connective or collagen-based tissues, including osteoarthritis, osteoporosis, osteogenesis imperfecta, osteopetrosis and pathologic calcifications. These techniques have also been used to probe chemical changes associated with load, disuse, and micro-damage in bone, and with degradation and repair in cartilage. This review summarizes the applications of FT-IR microscopy and imaging for analyses of bone and cartilage in healthy and diseased tissues, and illustrates the application of these techniques for the characterization of tissue engineered bone and cartilage.
INTRODUCTION
Vibrational spectroscopy in the mid-infrared (IR) region can provide molecular structure information about mineralized and non-mineralized connective tissues [1–4]. The wavelengths of many IR absorption bands are characteristic of specific types of chemical bonds, and IR spectroscopy is often used to identify compounds. In the infrared, asymmetric vibrations are most intense. Shifts in band intensities and positions are caused by changes in the environment of the molecule, enabling descriptions of variations in these environments. FT-IR microspectroscopy, in which the spectrometer is coupled to a light microscope, first introduced in the 1940s [5], and applied to bone in the 1980s, enabled investigators to examine spectra at discrete points within thin sections of tissues [6]. This point-by-point mapping has been widely applied to the analysis of polymers [7] and to a variety of tissues and individual cells to learn more about spatial variation in tissue and cellular composition [8–11]. It has also been used to identify pathologic inclusions such as foreign matter [12] and unusual soft tissue calcifications [13]. Data collection using point-by-point FT-IR microspectroscopic mapping was relatively slow and tedious, requiring the sample to be moved a specified distance for each point analyzed. The coupling of the FT-IR microscope with an array detector for FT-IR imaging changed the way data was collected and processed, as entire sections of tissue samples could be scanned and analyzed in short periods of time [14,15]. With this technology, the relative amount, molecular nature, distribution and orientation of the components of connective tissues can be evaluated on histological sections at a pixel resolution of 6.25 um and a spatial resolution of 1.3–13 microns depending on the light source, the wavelength being used, and the detector, where the standard thermal globar IR light source has a resolution of ~10 um and a confocal synchrotron unit the better resolution [16]. The data is presented as a “hyperspectral” image where the x and y axes are the spatial coordinates of the tissue section and the z-axis the parameter which is either directly measured (areas or intensities) or calculated (area or intensity ratios). Thus, spatially resolved maps of the molecular environments of tissue components can be obtained.. More recently, integration of this data collection with advanced algorithms has allowed images to be produced and analyzed to provide new molecular insights into spatial variation in tissue properties [17]. In this article we review the application of FT-IR microscopic imaging to bone and cartilage, and indicate how these techniques are being applied to understand material properties of native tissues and tissue engineered constructs.
FT-IR MAPPING OF NATIVE AND TISSUE ENGINEERED BONE
Composition of bone
Bone is a composite material consisting of a mineral phase (hydroxyapatite), collagen, non-collagenous proteins, lipids, and water [18]. The relative amounts of these constituents are variable, depending on animal and tissue age, tissue type, diet, and health status. The functions of these components are reviewed in detail elsewhere [18]. The infrared spectrum of bone (figure 1-a) shows the presence of the major molecular species, phosphate (from the mineral hydroxyapatite), carbonate (from carbonate substitution for hydroxyl and phosphate groups), and amide I, II, and III from the protein constituents of bone (mainly type I collagen). Because water has strong absorbance in the infrared, tissues are generally dehydrated before analyses, thus the water spectrum is not observed. Based on IR analyses of single crystals and model compounds, the origin of the vibrations observed in the IR have been tabulated for the mineral [19–21] and the matrix [22–23] and a number of calculated parameters have been validated for analyses of bone, dentin, and other calcified collagen-based minerals [1]. These parameters (Table I) include the mineral/matrix ratio which is linearly related to the mineral content, or ash weight, of the material being analyzed, the carbonate/phosphate ratio (or carbonate/protein ratio) which is related to the chemically measured carbonate/phosphate content, the crystallinity, proportional to the size of the crystals in their long axis as determined by x-ray diffraction. The type of carbonate substitution [24], the relative acid phosphate content, and a parameter (XLR) indicative of collagen maturity can also be calculated from an individual spectrum. These spectroscopic parameters can be measured in single FT-IR spectrum, in batch files of FT-IR spectra, and from FT-IR spectral images. While spectroscopic parameters obtained from ratios of areas are equivalent when measured either in single spectra or in images, parameters obtained by curve-fitting or deconvolution in single spectra are generally measured based on intensity ratios for images, and provide a related but less sensitive assessment of these values [25].
Figure 1.
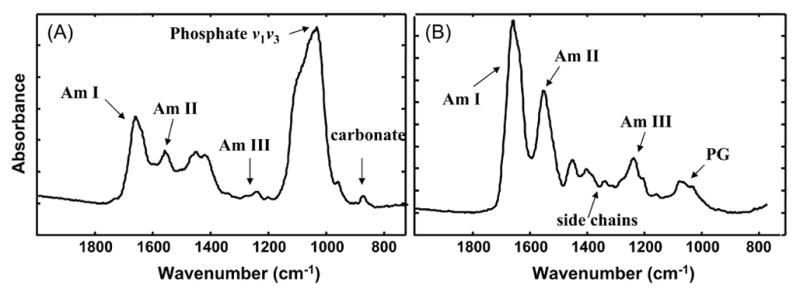
Typical infrared spectra of bone (a) and cartilage (b). a) Infrared spectra of healthy adult human cortical bone showing the absorbance bands for vibrations of phosphate, carbonate, and protein amide bonds (AmI, AmII, AmIII). Only the frequencies (wavenumbers, cm−1) used in mid-infrared imaging are shown. b) Infrared spectrum of bovine cartilage showing absorbance bands for vibrations of collagen amide bonds (AmI, AmII, AmIII), amide side chain groups, and proteoglycan sugar ring absorbance (PG).
Table I.
Measuring Bone Properties by FT-IR Spectroscopy
| Parameter | Definition | Validation | Variation with Age |
|---|---|---|---|
| Mineral-to-Matrix Ratio | Area of 900–1200cm-1 phosphate band/area of amide I band (1585–1720cm−1) | Linearly related to ash content of synthetic collagen and apatite mixtures | Increases with tissue age |
| Carbonate-to-phosphate ratio | Area of 850–890 carbonate band to phosphate (or amide I) bands | Related to tissue carbonate content as determined by elemental analyses | Increases with tissue age |
| Crystallinity | Peak area* or intensity ratio of subbands at 1030 and 1020 cm−1 | Related to crystal size in c-axis dimension as determined by x-ray diffraction line broadening | Increases with increasing tissue age |
| XLR | Peak area * or intensity ratio of subbands at 1660 and 1690 cm−1 | Ratio changes with photolysis of collagen cross-links | Increases with increasing tissue age |
| Acid phosphate Content | Peak area or intensity ratio of subbands at 1106 and 1030 or 960 cm−1 | Decreases with tissue maturation | Decreases with increasing tissue age |
determined by curve-fitting
Preparation of Bone Specimens for FT-IR Microscopic and Imaging Analyses
FT-IR measurement of bone is usually performed in transmittance (i.e., light is passed trhough the section), thus requiring the preparation of thin (2–3um thick) transparent sections. To cut such sections the tissue must be embedded in a hard resin such as polymethyl methacrylate or glycol methacrylate [26] Selection of areas to be analyzed may be based on back scatter electron images, micro-computed tomographic images, or routine histology, or in some cases sections from the entire bone or bone biopsy may be examined. While methacrylate can be solubilized from the sections in methanol, when this is done the thin trabeculae have a tendency to wash away, hence spectra are generally obtained with the resin present, and its spectral contribution subtracted from each individual spectrum. This subtraction is most critical for the poorly mineralized tissues where resin penetration is extensive, and less critical for the mineralized bone into which much less resin penetrates.
Imaging spectrometers consisting of a source, a sample handling unit and an focal plane array detector on an infrared microscope are available from a variety of manufacturers, including BioRad (now Varian), Brucker, and Perkin-Elmer. For use of synchrotron radiation a beam line is required, thus most of the data is obtained with thermal globars. The instruments are usually equipped with a photographic device to photographically capture the area of the tissue being examined, and a stage for moving the specimen to the desired areas. Data can then be collected in 20–50 um × 20–50 um points, or in arrays covering a desired area in the tissue.
Age Dependent Changes in FT-IR Spectral Parameters
In healthy bone, the mineral content increases with both animal and tissue age, and the mineral/matrix ratio similarly increases with tissue age, as indicated by images of this parameter in the developing osteons (figure 2-a). Similarly, the carbonate/phosphate ratio increases, the crystallinity increases (figure 2-b), and the XLR increases (figure 2-c) as the tissue age increases. The distribution of each of these parameters is generally described by a Gaussian distribution of pixels. Similar changes are seen in trabecular bone going from the outer surface to the center of the trabeculae [27]. These age related changes have been reported in FT-IR images and point-by-point microscopic data from rats [28,29], chicks [30], fish and cows [31], dogs [32,33], monkeys [34,35], and mice and humans.
Figure 2.
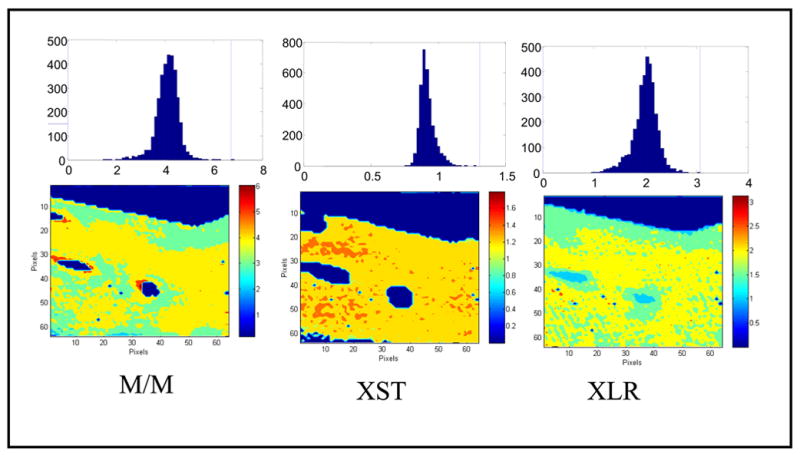
Infrared images and pixel histograms for osteonal bone in an adult human female femoral neck: (left) mineral/ matrix ratio (M/M), (center) crystallinity (XST), and (right) collagen maturity (XLR). The same area of bone is shown in each figure; note that the crystallinity parameter occupies a lesser area than the collagen maturity parameter, as there is unmineralized matrix (osteoid) in the sample. The mean ± SD for the pixels in this image are 4.1± 0.45 (M/M), 1.30± 0.08 (XST), 2.1 ± 0.6 (XLR).. These pixel histograms can be combined to provide statistics for multiple samples.
The mouse data includes analyses of the effects of gene ablation and overexpression on bone properties. The models [35–47] analyzed by point-by-point FT-IR microspectroscopy and Imaging are listed in Table II. Information on wildtype mice from these studies, while varying in absolute values depending on the background strain, confirms general trends noted in human and other animal models. Specifically in a variety of strains of mice, looking at trabecular or cortical bone, with age there is an increase in mineral content, crystallinity, carbonate/phosphate ratio and collagen maturity [48]. The mutations in many cases have been linked to disease conditions, as noted in the table, and data from the mice can be used to learn more about these disease states.
Table II.
Use of IR Imaging (FTIRI) and Microspectroscopy (FTIRM) to Characterize Changes in Bones of Naturally Occurring Mutant (Mu), Knockout (KO) and Transgenic (TG) Mice
| Protein | Model | Model for Human Condition | Method | Reference |
|---|---|---|---|---|
| Type X collagen | KO | Spondolyloepiphyseal dysplasia | FTIRM | 35 |
| Osteocalcin | KO | FTIRM | 36 | |
| PHEX | Mu | Hypophosphatemic Rickets | FTIRM | 37 |
| Type I collagen | Mu | Osteogenesis Imperfecta | FTIRM, FTIRI | 38,39 |
| Osteopontin | KO | FTIRM | 40 | |
| TGF-beta | KO | FTIRI | 41 | |
| Osteonectin | KO | Vanishing bone disease | FTIRM, FTIRI | 25 |
| Vitamin D receptor | TG | Osteoporosis | FTIRM | 42 |
| Alkaline Phosphatase | KO | Rickets | FTIRM | 43 |
| IGF-binding protein 5 | TG | FTIRI | 44 | |
| Dentin matrix protein 1 | KO | FTIRI | 45 | |
| Biglycan | KO | Osteopenia | FTIRM | 46 |
| Beta-galactosidase | KO | Fabry’s Disease | FTIRI | 47 |
In humans, FT-IR spectroscopic imaging and microspectroscopy have been used to characterize disease- related changes (Table III [49–54]). In diseased bones, FT-IR imaging data reveal striking differences in mineral and matrix properties [1,55]. For example, in biopsies of bone from patients with osteoporosis there are increases in crystallinity and in collagen maturity relative to healthy bone. Moreover, while healthy individuals show a wide range of values with maximal values in the center of the trabeculae, comparing the extent of change from the bone surface to the highest value for each of the FTIRI parameters in patients with low and high turnover osteoporosis show minimal change relative to those noted in normal trabeculae (figure 3). Cases of osteopetrosis show increased mineral density with decreased crystal size [54], while spectral imaging and microscopy data from bones of animal models with osteogenesis imperfecta indicate decreases in crystal size, altered crystal acid phosphate content and mineral density [38,39].
Table III.
IR Spectroscopic Imaging (FTIRI) and Microspectroscopic (FTIRM) Studies of Human Diseased Bone
Figure 3.
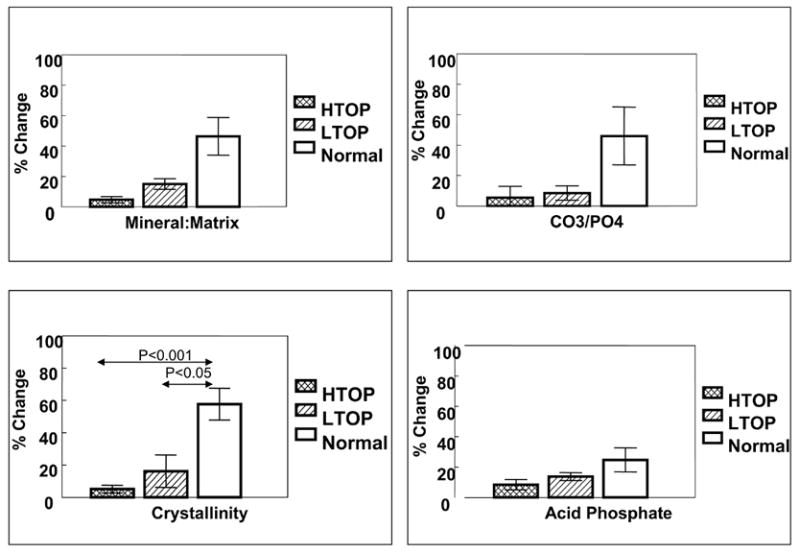
Mineral properties in osteoporotic bone show different patterns when the maximum value in the center of the trabeculae is compared to the lowest value (generally at the edge). This figure, summarizing data described in Boskey et al [50], shows the mean (±SD) % change in iliac crest biopsies of both female and male patients with high-(HTOP) and low-(LTOP)- turnover osteoporosis as contrasted with age-matched normal controls for mineral/matrix ratio (top left), carbonate/phosphate ratio (top right), crystallinity (bottom left), and acid phosphate content (bottom right).
An important feature of bone is its ability to support load, and adapt to deformations created during normal exposure to stress and strain. This exposure usually causes damage to the tissue, which in the health individual is repaired. A recent study from Burr’s group used synchrotron radiation-based spectroscopy to study canine vertebrae that had been stained with basic fuschin to identify micro-damage. The bone adjacent to the damaged areas had comparable mineral content (mineral/matrix ratio), comparable crystallinity, but decreased carbonate/phosphate ratios, increased acid phosphate content, and increased collagen maturity [56].
FT-IR Imaging of tissue engineered bone structures
Knowledge of bone compositional variation facilitates the application of infrared imaging to the study of tissue engineered products. Implant scaffold compositions are often evaluated as homogenized samples by FT-IR [57–60] and the homogenized mineralized matrix expressed by human stem cells of different origin when plated on these substrates has been shown to be “bone-like” by FT-IR [61]. FT-IR has also been used to characterize the mineral formed on different materials [62] but the spatial distribution of these materials is not often addressed. Yet FT-IR images offer the capability for demonstrating that the tissue engineered construct and the tissue it forms mimics the type of bone it is designed to replace. For example, a comparison of images of materials with different surface roughness seeded with rat calvarial osteoblasts demonstrated that only those cells treated with BMP-2 and plated on a rough surface formed a bone-like matrix, and that the mineral was closely associated with that matrix, while other surfaces did not support the deposition of a bone-like mineral and matrix (figure 4) [63]. The advantages of using FT-IR microspectroscopy for analyses of bone and dental implant materials is reviewed elsewhere [64] and is illustrated by studies of the changes in the spatial distribution of components of dental composites mapped by FT-IR microspectroscopy [65], and the contact of injected bone cement with underlying bone tissues [66]. Another recent study used FT-IR Imaging to localize where hydroxyapatite formed on bioglass templates when they were placed in saline [67].
Figure 4.
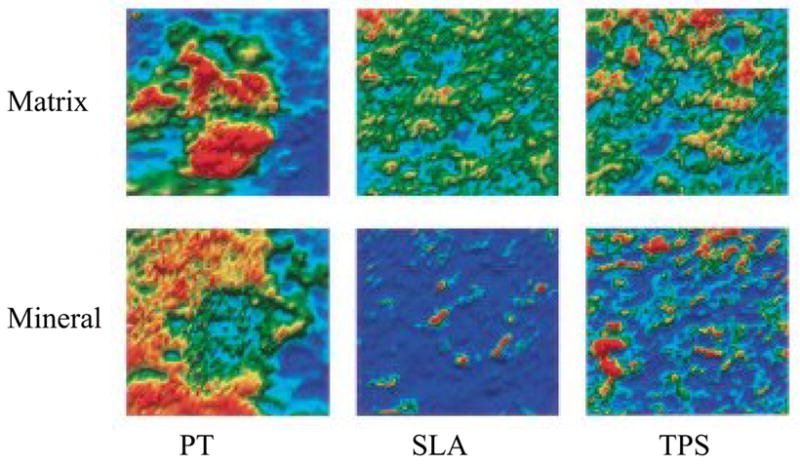
Qualitative images of matrix (a) and mineral(b) distribution on surface roughened titanium implants with bmp-2 (20 ng/ml) treated fetal rat calvarial osteoblasts. The cells were cultured on titanium implant materials (PT, pretreated; SLA-course grit blasted and acid etched, and TPS – Ti plasma sprayed). Only SLA and TPS showed close association of mineral and matrix with the greatest yield on the TPS plates. Reprinted with permission from B.D. Boyan et al [61].
FT-IR Imaging of Native and Tissue-Engineered Cartilage
Composition of Cartilage
Articular cartilage is a specialized connective tissue that lines the ends of the bones and provides a smooth, frictionless surface for weight-bearing during joint loading and motion [68]. The framework of cartilage is comprised of a network of type II collagen, a triple helical fibrillar protein, that is associated with other collagens, non-collagenous proteins, and proteoglycan (PG) components [69]. Aggrecan, the primary cartilage PG, contains covalently attached side chains of the glycosaminoglycans chondroitin sulfate and keratan sulfate linked to a protein core. Cartilage displays zonal heterogeneity with respect to its molecular composition and structure. The superficial surface layer of cartilage has densely packed type II collagen fibrils that are oriented parallel to the surface, a small amount of PG and a high water content [70;71] The middle transitional zone has a lower water content, a higher concentration of PG, and a lower concentration of collagen fibrils that are randomly oriented. The deep zone contains radially oriented collagen fibrils, has the highest concentration of PG, and lowest percentage of water compared to the other zones. Pathological changes in the macromolecular structure and content of the primary cartilage components are hallmarks of cartilage degeneration [72–74]. Such changes are characteristic of osteoarthritis (OA), a progressively disabling musculoskeletal disease that affects millions of individuals in the United States [75], with prevalence directly correlated to age. When articular cartilage is damaged as a result of OA or injury, the tissue has limited capacity for repair and regeneration, and as such, advanced stages of OA are typically characterized by extensive cartilage damage that can eventually lead to joint arthroplasty.
There has been extensive research into techniques to repair damaged cartilage, including the use of microfracture techniques [76–80], autograft and allograft transplants [81–85] and autologous chondrocyte implantation procedures [86–90]. Emerging tissue engineering techniques include bioreactor growth of cartilagenous tissue [91–94] and the use of three-dimensional scaffolds, such as hydrogels, in combination with cell seeding [95–98]. In general, the goal of these tissue engineering strategies is to produce a cartilage-like tissue that has a normal organization and molecular structure, and can sustain load. Since cartilage is spatially heterogeneous, quantification of both native articular cartilage and engineered tissues at the macroscopic, microscopic and molecular levels is critical.
FT-IR Parameters Utilized to Monitor Normal and Degenerative Cartilage
FT-IR spectroscopy is a powerful tool to assess degenerative cartilage structure. Although there have been several conventional FT-IR studies on collagen molecular changes and hydration [99–101], and on extracted proteoglycans from various tissues [102–104], until very recently, infrared spectroscopic studies on articular cartilage were non-existent. The first IR studies on cartilage were imaging spectroscopy (FT-IRIS) studies from our group [105] followed closely by Potter et al [106]. In our initial studies, FT-IR imaging data acquired through the superficial, middle, and deep zones of thin, histological sections of bovine articular cartilage showed variation in the absorbance bands that arise from the primary non-aqueous components of cartilage, collagen, and proteoglycans (primarily aggrecan), and thus reflected the differences in quantity of these specific components (figure 1-b). In addition, spectra of mixtures of model compounds, which had varying proportions of type II collagen and aggrecan, were analyzed to identify spectral markers that could be used to quantitatively analyze these components in cartilage. It was found that the integrated area of the amide I absorbance (1590 – 1720 cm−1) correlated with collagen concentration, and the ratio of the integrated area of the PG sugar ring C-O absorbance (985–1140 cm−1) to the amide I absorbance area correlated to the quantity of PG. The quantification of PG was further validated in studies of tissue-engineered cartilage where biochemical assessment of glycosaminoglycan (GAG) content correlated with the FT-IR-derived spectral parameter [107]. Polarization experiments were also performed to determine the spatial distribution of the collagen orientation in articular cartilage, and the ratio of the collagen amide I/amide II absorbance was utilized as a spectral marker of collagen orientation [105;108].
Another spectral parameter that has been utilized to assess normal and degenerative cartilage structure is the 1338 cm−1 absorbance, a feature that arises from collagen CH2 side chain vibrations. In earlier studies, this absorbance band was shown to decrease in intensity as collagen denatures [109]. Initial cartilage studies found that the integrated area of this band (ratioed to the amide II collagen band) was reduced in human osteoarthritic tissues compared to normal tissues [4]. Further work to elucidate the molecular origin of this change confirmed that the reduction in the 1338 cm−1 absorbance was linked to collagen degradation [110]. Figure 5 shows an example of collagen and PG distribution, collagen integrity (based on the 1338 cm−1 absorbance), and collagen orientation in articular cartilage from a rabbit surgical model of osteoarthritis. Differences in these parameters in the OA compared to the normal control tissue reflect compositional and structural changes that arise at an early stage of disease, the most obvious being loss of PG (~35% decrease) and changes in collagen orientation as evidenced by an almost complete loss of deep zone collagen fibrils orientated perpendicular to the articular surface. Collagen integrity was slightly higher in the OA tissues at this early stage ( ~ 20 % increase), a finding consistent with increased collagen synthesis early in the development of OA, possibly indicative of an active repair response.
Figure 5.
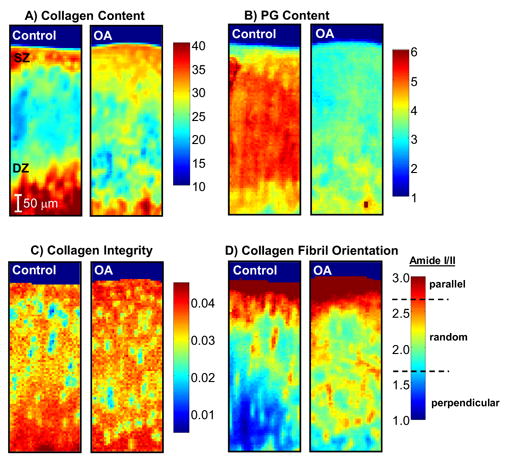
FT-IR images of collagen content (amide I area) (i), PG content (PG sugar ring C-O absorbance (985–1140 cm−1) normalized to amide I area) (ii), collagen integrity (1338 cm−1 normalized to amide II area ratio) (iii), and collagen orientation (amide I/amide II ratio in polarized images) (iv) from the articular surface (superficial zone, SZ) down to the tidemark (lower boundary of deep zone, DZ), acquired from the medial femoral condyle of an OA (right panel) and non-surgical control (left panel) rabbit at two weeks post-surgery. The color scale indicates the pixel values for collagen and PG content, and collagen integrity index, where red and dark blue represent highest and lowest values, respectively. For the polarized data, the boundaries on the color bar indicate the three collagen fibril orientation categories with respect to the articular surface, corresponding to amide I / amide II peak area ratios ≥ 2.7 (parallel fibrils), between 2.7 and 1.7 (random fibrils), and ≤ 1.7 (perpendicular fibrils), respectively. A marked reduction in PG content is noted in the OA compared to Control cartilage.
Taken together, these parameters provide a framework in which complex pathological changes in articular cartilage and engineered tissues can be assessed by FT-IR imaging spectroscopy. Recent studies that have applied FT-IR imaging to normal and degenerative cartilage include work that addresses the contribution of collagen and PG composition and structure to the mechanical properties of cartilage in compression [111], evaluation of molecular contributions to stresses in the chondrocyte microenvironment [112] and imaging of human osteoarthritic cartilage[113,114].
Preparation of Cartilage Specimens for FT-IR Microscopic and Imaging Analyses
Soft tissues such as cartilage may be cryosectioned without embedding for FT-IR imaging analysis, but typically are paraffin-embedded to ensure optimal preservation of the tissue structure. If bone is attached to the cartilaginous tissue, samples are decalcified prior to paraffin processing. The processing sequence includes fixation/dehydration in ethanol or formalin with cetyl pyridinium choloride (CPC) added to preserve proteoglycans, decalcification with EDTA, and embedding in paraffin. For FT-IR imaging data acquisition in transmittance, sections 5 to 10 microns in thickness are cut onto an infrared-transmissive substance such as a BaF2 window. It is also possible to sample the tissues in reflectance mode using a reflective substrate such as MirrIR low-e microscope slides (Kevley Technologies, Chesterl and, OH).
FT-IR Imaging of Tissue-Engineered Cartilage
The composition of tissue-engineered cartilage can be considered to be predictive of its in vivo performance. Therefore, the ability to monitor changes in the tissue matrix components during engineered cartilage development, including collagen, PG, and water, would be a key element in determining whether a protocol is viable. A previous FT-IR imaging study evaluated PG content in cartilage grown from avian chondrocytes within a hollow fiber bioreactor (HFBR) system, where a gradient of PG content was found, with the highest content in the tissue center near the nutritive fibers and the lowest near the interior surface of the HFBR [107]. Recent studies have utilized FT-IR imaging to assess tissue matrix changes during development of mammalian cartilage in a custom-designed single-fiber HFBR [115]. Immature bovine chondrocytes were inoculated (100 million/0.7mL) into a HFBR and cultured for a period of 8 weeks. Figure 6 shows FT-IR images based on collagen and PG content obtained from histological sections of the HFBR cartilage grown for 2, 4 and 8 weeks in culture, and comparisons made to type II collagen immunohistochemistry and PG distribution determined from alcian blue histology. The FT-IR imaging data show qualitative temporal changes in collagen quantity, increased at 4 and 8 weeks, and PG distribution. The highest amount of PG was near the fiber (center) at 2 and 4 weeks, but was nearer the tissue edges at 8 weeks. Based on the FT-IR imaging data, it is likely that both increased collagen and redistribution of PG around the tissue periphery contribute to improved mechanical properties noted at 8 weeks of growth.
Figure 6.
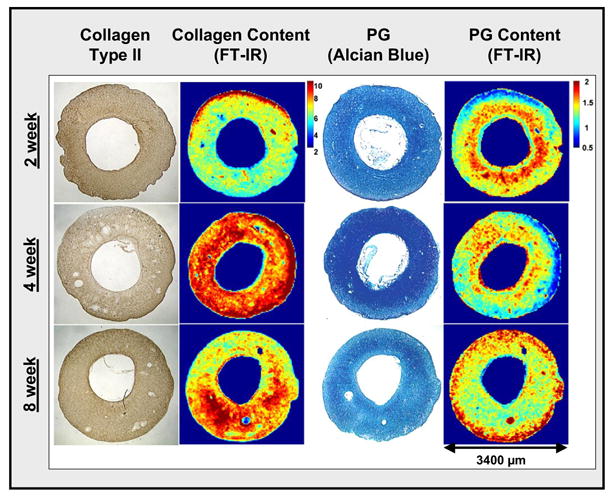
Images from cross-sections of engineered mammalian cartilage grown in a hollow fiber bioreactor for 2, 4 and 8 weeks. Data include immunohistochemical type II collagen distribution, histological PG distribution (Alcian Blue stain), and FT-IR-determined collagen (amide I area) and proteoglycan ((PG sugar ring C-O absorbance (985–1140 cm−1) normalized to amide I area) distribution. Qualitatively, increased collagen and a change in the distribution of PG can be observed at 4 and 8 weeks compared to 2 weeks of growth.
FT-IR Imaging of Cartilage Repair Tissue
Many studies have utilized animal models to assess therapeutic modalities for cartilage repair [116–118]. In general, such studies require the harvested repair tissue to be subjected to several different analyses to obtain a full picture of the quality of the repair tissue formed. These would include histology for PG evaluation, immunohistochemistry for type I and type II collagen, and polarized light microscopy to assess collagen fibril organization. The use of FT-IR imaging to assess harvested repair tissue enables one unstained tissue section to be evaluated for several features simultaneously, including collagen organization. One recent study investigated repair tissue formed in a rabbit osteochondral defect treated with TP508, a synthetic peptide that contains a receptor-binding domain of thrombin [119]. TP508 binds to high affinity non-proteolytically activated thrombin receptors and modulates thrombin-mediated chemotaxis and mitogenesis. The study investigated whether application of this peptide in a sustained release delivery vehicle to a full-thickness osteochondral defect would result in neochondrogenesis in an articular cartilage defect site. FT-IR imaging data obtained from histological sections of the defect site and adjacent cartilage at 6 weeks post-treatment showed that there was new tissue formation in the defect (figure 7). In the data shown, the tissue filled the defect site. Compared to the adjacent cartilage, the repair tissue had a lower collagen content (~30% reduction), but also displayed regions where the PG content was similar to that in the native tissue. In addition, there was some orientation of the collagen fibrils in the repair tissue as evidenced by the parallel layer of fibrils observed at the tissue surface.
Figure 7.
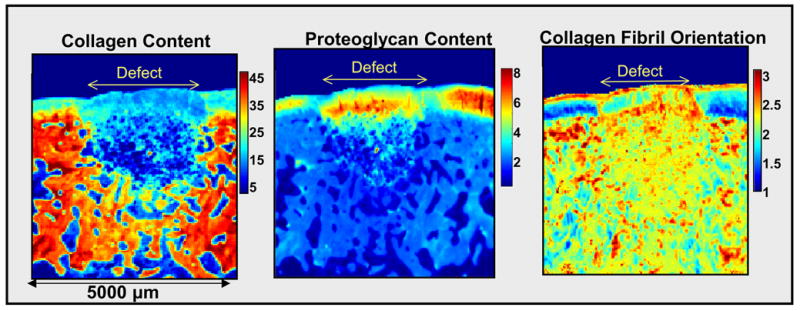
FT-IR images of rabbit osteochondral defect at 6 weeks post-repair with TP 508 protein. The defect repair cartilage has lower collagen content (amide I area) compared to the adjacent articular cartilage, but also has regions with PG content ((PG sugar ring C-O absorbance (985–1140 cm−1)) of a similar magnitude to that in the native cartilage. There is some orientation present in the repair cartilage, as evidenced by the layer of fibrils parallel to the surface. For the orientation data, the boundaries on the color bar indicate the three collagen fibril orientation categories with respect to the articular surface, corresponding to amide I / amide II peak area ratios ≥ 2.7 (parallel fibrils), between 2.7 and 1.7 (random fibrils), and ≤ 1.7 (perpendicular fibrils), respectively.
FT-IR Imaging of Cartilage Scaffolds
A final illustration of the application of FT-IR imaging to cartilage tissue engineering involves the assessment of a tissue-engineered porous hydrogel scaffold for filling cartilage defects. As with other tissue engineering strategies, the ultimate goal is for the synthetic material to recover the initial composition and function of cartilage and to integrate into adjacent normal cartilage. In our recent study, a combination of non-degradable and degradable polymers, polyvinyl-alcohol (PVA) and poly (lactic co-glycolic acid) (PLGA), were evaluated. FT-IR imaging spectroscopy was utilized to assess PLGA degradation-induced changes in hydrogel structure and self-mobilized chondrocyte migration via porous channels [120]. Infrared absorbance bands unique to PLGA (1756 cm−1), and PVA (1092 cm−1), were utilized to monitor the distribution of these components within thin sections of the hydrogel (figure 8-a). The morphology of the hydrogels was altered with increasing quantity of PLGA, a feature that can be utilized to optimize the hydrogel structure. Factor Analysis, a multivariate technique recently applied to IR imaging determination of protein structure and distribution in skin [121], was utilized here to evaluate the matrix formed by infiltration of chondrocytes into the hydrogel (figure 8-b). The presence of matrix formation is clearly distinguished from the hydrogel, supporting the utility of such analyses for assessment of tissue integration into cartilage scaffolds.
Figure 8.
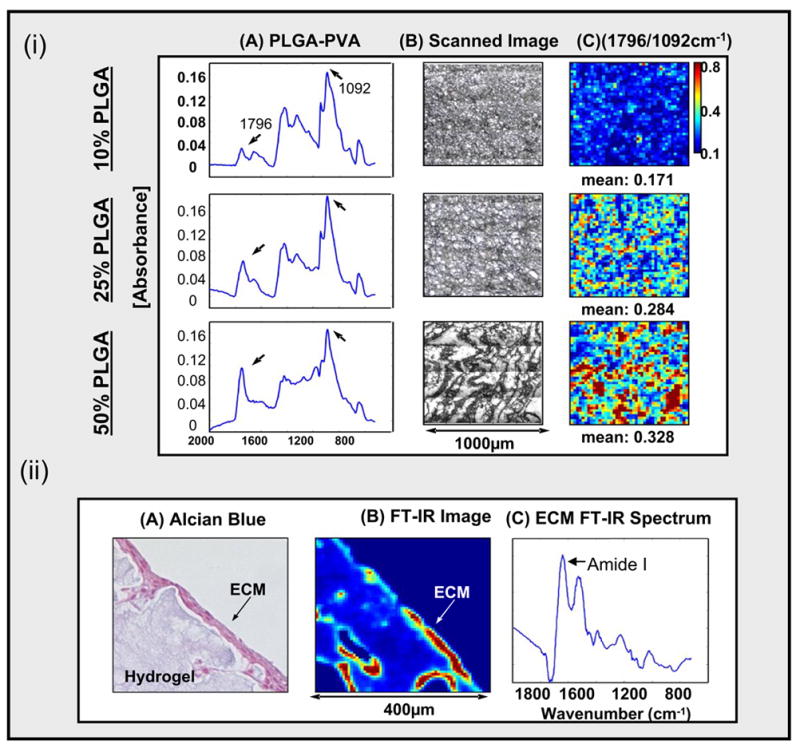
(i). FT-IR and SEM images of PVA/PLGA hydrogels comprised of 10, 25, or 50% PLGA. Infrared absorbance peaks unique to PLGA and PVA are at 1756 cm−1 and 1092 cm−1, respectively, and the ratio of the peaks was used to monitor the quantity and distribution of the PLGA within the hydrogel. The hydrogel morphology changed with increaseing PLGA content.
(ii). Extracellular matrix (ECM) produced by chondrocytic infiltration into the hydrogel was evident on Alcian Blue stained hydrogel sections, and was monitored by FT-IR imaging of the protein Amide I absorbance.
CONCLUSIONS
In conclusion, the data presented demonstrate the utility and flexibility of infrared imaging for investigations into the micro and molecular structure of bone and cartilage and related engineered constructs. The ability to utilize one unstained histological or thick section to obtain a multitude of information on the content and distribution of native and engineered molecular components makes this an exceedingly powerful technique. Although IR imaging is currently limited to assessment of harvested tissues, the development of related techniques that can be utilized in a minimally-invasive environment, such as with a fiber optic probe [122], are emerging.
Acknowledgments
The authors work described in this study was supported by NIH grants DE04141, AR037661, and AR043125 (to ALB) and AR48337 and EB00744 (to NPC). Images were obtained using the NIH sponsored Core Center (AR046121) at the Hospital for Special Surgery. Research performed at the Hospital for Special Surgery described in this review was conducted in a facility constructed with support from Research Facilities Improvement Program Grant C06-RR12538-01 from the National Center for Research Resources, National Institutes of Health.
Footnotes
Publisher's Disclaimer: This is a PDF file of an unedited manuscript that has been accepted for publication. As a service to our customers we are providing this early version of the manuscript. The manuscript will undergo copyediting, typesetting, and review of the resulting proof before it is published in its final citable form. Please note that during the production process errors may be discovered which could affect the content, and all legal disclaimers that apply to the journal pertain.
References
- 1.Boskey A, Mendelsohn R. Infrared analysis of bone in health and disease. J Biomed Opt. 2005;10:031102–031106. doi: 10.1117/1.1922927. [DOI] [PubMed] [Google Scholar]
- 2.Carden A, Morris MD. Application of vibrational spectroscopy to the study of mineralized tissues. J Biomed Opt. 2000;5:259–268. doi: 10.1117/1.429994. [DOI] [PubMed] [Google Scholar]
- 3.Miller LM, Dumas P. Chemical imaging of biological tissue with synchrotron infrared light. Biochim Biophys Acta. 2006;1758:846–857. doi: 10.1016/j.bbamem.2006.04.010. [DOI] [PubMed] [Google Scholar]
- 4.West PA, Bostrom MP, Torzilli PA, Camacho NP. Fourier transform infrared spectral analysis of degenerative cartilage: an infrared fiber optic probe and imaging study. Appl Spectrosc. 2004;58:376–81. doi: 10.1366/000370204773580194. [DOI] [PubMed] [Google Scholar]
- 5.Barer R, Cole ARH, Thompson HW. Infrared spectroscopy with the reflecting microscope in physics, chemistry and biology. Nature. 1949;163:198–201. doi: 10.1038/163198a0. [DOI] [PubMed] [Google Scholar]
- 6.Mendelsohn R, Hassankhani A, DiCarlo E, Boskey A. FT-IR microscopy of endochondral ossification at 20 mu spatial resolution. Calcif Tissue Int. 1989;44:20–24. doi: 10.1007/BF02556236. [DOI] [PubMed] [Google Scholar]
- 7.Rintoul L, Panayiotou H, Kokot S, George G, Cash G, Frost R, Bui T, Fredericks P. Fourier transform infrared spectrometry: a versatile technique for real world samples. Analyst. 1998;123:571–577. doi: 10.1039/a707111f. [DOI] [PubMed] [Google Scholar]
- 8.Manoharan R, Baraga JJ, Rava RP, Dasari RR, Fitzmaurice M, Feld MS. Biochemical analysis and mapping of atherosclerotic human artery using FT-IR microspectroscopy. Atherosclerosis. 1993;103:181–193. doi: 10.1016/0021-9150(93)90261-r. [DOI] [PubMed] [Google Scholar]
- 9.Choo LP, Wetzel DL, Halliday WC, Jackson M, LeVine SM, Mantsch HH. In situ characterization of beta-amyloid in Alzheimer’s diseased tissue by synchrotron Fourier transform infrared microspectroscopy. Biophys J. 1996;71:1672–1679. doi: 10.1016/S0006-3495(96)79411-0. [DOI] [PMC free article] [PubMed] [Google Scholar]
- 10.Diem M, Chiriboga L, Yee H. Infrared spectroscopy of human cells and tissue. VIII. Strategies for analysis of infrared tissue mapping data and applications to liver tissue. Biopolymers. 2000;57:282–290. doi: 10.1002/1097-0282(2000)57:5<282::AID-BIP50>3.0.CO;2-R. [DOI] [PubMed] [Google Scholar]
- 11.Lasch P, Pacifico A, Diem M. Spatially resolved IR microspectroscopy of single cells. Biopolymers. 2002;67:335–338. doi: 10.1002/bip.10095. [DOI] [PubMed] [Google Scholar]
- 12.Kalasinsky KS, Kalasinsky VF. Infrared and Raman microspectroscopy of foreign materials in tissue specimens. Spectrochim Acta A Mol Biomol Spectrosc. 2005;61:1707–1713. doi: 10.1016/j.saa.2004.12.048. [DOI] [PubMed] [Google Scholar]
- 13.Pachman LM, Veis A, Stock S, Abbott K, Vicari F, Patel P, Giczewski D, Webb C, Spevak L, Boskey AL. Composition of calcifications in children with juvenile dermatomyositis: association with chronic cutaneous inflammation. Arthritis Rheum. 2006;54:3345–3350. doi: 10.1002/art.22158. [DOI] [PMC free article] [PubMed] [Google Scholar]
- 14.Lewis EN, Treado PJ, Reeder RC, Story GM, Dowrey AE, Marcott C, Levin IW. Fourier transform spectroscopic imaging using an infrared focal-plane array detector. Anal Chem. 1995;67:3377–3381. doi: 10.1021/ac00115a003. [DOI] [PubMed] [Google Scholar]
- 15.Marcott C, Reeder RC, Paschalis EP, Tatakis DN, Boskey AL, Mendelsohn R. Infrared microspectroscopic imaging of biomineralized tissues using a mercury-cadmium-telluride focal-plane array detector. Cell Mol Biol (Noisy-le-grand) 1998;44:109–115. [PubMed] [Google Scholar]
- 16.Miller LM, Smith RJ. Synchrotrons versus globars, point-detectors versus focal plane arrays: Selecting the best source and detector for specific infrared microscopy and imaging applications, Vib. Spec. 2005;38:237–240. [Google Scholar]
- 17.Levin IW, Bhargava R. Fourier transform infrared vibrational spectroscopic imaging: integrating microscopy and molecular recognition. Annu Rev Phys Chem. 2005;56:429–74. doi: 10.1146/annurev.physchem.56.092503.141205. [DOI] [PubMed] [Google Scholar]
- 18.Boskey AL. Bone Mineralization. In: Cowin SC, editor. Bone Biomechanics. 3. CRC Press; Boca Raton, FL: 2001. pp. 5.1–5.34. [Google Scholar]
- 19.Fowler BO, Moreno EC, Brown WE. Infra-red spectra of hydroxyapatite, octacalcium phosphate and pyrolysed octacalcium phosphate. Arch Oral Biol. 1966;11:477–492. doi: 10.1016/0003-9969(66)90154-3. [DOI] [PubMed] [Google Scholar]
- 20.Rey C, Shimizu M, Collins B, Glimcher MJ. Resolution-enhanced Fourier transform infrared spectroscopy study of the environment of phosphate ions in the early deposits of a solid phase of calcium-phosphate in bone and enamel, and their evolution with age. I: Investigations in the upsilon 4 PO4 domain. Calcif Tissue Int. 1990;46:384–394. doi: 10.1007/BF02554969. [DOI] [PubMed] [Google Scholar]
- 21.Walters MA, Leung YC, Blumenthal NC, LeGeros RZ, Konsker KA. A Raman and infrared spectroscopic investigation of biological hydroxyapatite. J Inorg Biochem. 1990;39:193–200. doi: 10.1016/0162-0134(90)84002-7. [DOI] [PubMed] [Google Scholar]
- 22.Lazarev YA, Grishkovsky BA, Khromova TB. Amide I band of IR spectrum and structure of collagen and related polypeptides. Biopolymers. 1985;24:1449–1478. doi: 10.1002/bip.360240804. [DOI] [PubMed] [Google Scholar]
- 23.Juszczak LJ. Comparative vibrational spectroscopy of intracellular tau and extracellular collagen I reveals parallels of gelation and fibrillar structure. J Biol Chem. 2004;279:7395–7404. doi: 10.1074/jbc.M309971200. [DOI] [PubMed] [Google Scholar]
- 24.Rey C, Collins B, Goehl T, Dickson IR, Glimcher MJ. The carbonate environment in bone mineral: a resolution-enhanced Fourier Transform Infrared Spectroscopy Study. Calcif Tissue Int. 1989;45:157–164. doi: 10.1007/BF02556059. [DOI] [PubMed] [Google Scholar]
- 25.Boskey AL, Moore DJ, Amling M, Canalis E, Delany AM. Infrared analysis of the mineral and matrix in bones of osteonectin-null mice and their wildtype controls. J Bone Miner Res. 2003;18:1005–1011. doi: 10.1359/jbmr.2003.18.6.1005. [DOI] [PubMed] [Google Scholar]
- 26.Aparicio S, Doty SB, Camacho NP, Paschalis EP, Spevak L, Mendelsohn R, Boskey AL. Optimal methods for processing mineralized tissues for Fourier transform infrared microspectroscopy. Calcif Tissue Int. 2002;70:422–429. doi: 10.1007/s00223-001-1016-z. [DOI] [PubMed] [Google Scholar]
- 27.Gadaleta SJ, Boskey AL, Paschalis E, Carlson C, Menschik F, Baldini T, Peterson M, Rimnac CM. A physical, chemical, and mechanical study of lumbar vertebrae from normal, ovariectomized, and nandrolone decanoate-treated cynomolgus monkeys (Macaca fascicularis) Bone. 2000;27:541–550. doi: 10.1016/s8756-3282(00)00362-8. [DOI] [PubMed] [Google Scholar]
- 28.Ouyang H, Sherman PJ, Paschalis EP, Boskey AL, Mendelsohn R. Fourier transform infrared microscopic imaging: effects of estrogen and estrogen deficiency on fracture healing in rat femurs. Appl Spectrosc. 2004;58:1–9. doi: 10.1366/000370204322729405. [DOI] [PubMed] [Google Scholar]
- 29.Verberckmoes SC, Behets GJ, Oste L, Bervoets AR, Lamberts LV, Drakopoulos M, Somogyi A, Cool P, Dorrine W, De Broe ME, D’Haese PC. Effects of strontium on the physicochemical characteristics of hydroxyapatite. Calcif Tissue Int. 2004;75:405–415. doi: 10.1007/s00223-004-0260-4. [DOI] [PubMed] [Google Scholar]
- 30.Masse PG, Rimnac CM, Yamauchi M, Coburn SP, Rucker RB, Howell DS, Boskey AL. Pyridoxine deficiency affects biomechanical properties of chick tibial bone. Bone. 1996;18:567–574. doi: 10.1016/8756-3282(96)00072-5. [DOI] [PubMed] [Google Scholar]
- 31.Kim HM, Rey C, Glimcher MJ. Isolation of calcium-phosphate crystals of bone by non-aqueous methods at low temperature. J Bone Miner Res. 1995;10:1589–1601. doi: 10.1002/jbmr.5650101021. [DOI] [PubMed] [Google Scholar]
- 32.Pienkowski D, Doers TM, Monier-Faugere MC, Geng Z, Camacho NP, Boskey AL, Malluche HH. Calcitonin alters bone quality in beagle dogs. J Bone Miner Res. 1997;12:1936–1943. doi: 10.1359/jbmr.1997.12.11.1936. [DOI] [PubMed] [Google Scholar]
- 33.Burr DB, Miller L, Grynpas M, Li J, Boyde A, Mashiba T, Hirano T, Johnston CC. Tissue mineralization is increased following 1-year treatment with high doses of bisphosphonates in dogs. Bone. 2003;33:960–969. doi: 10.1016/j.bone.2003.08.004. [DOI] [PubMed] [Google Scholar]
- 34.Paschalis EP, Burr DB, Mendelsohn R, Hock JM, Boskey AL. Bone mineral and collagen quality in humeri of ovariectomized cynomolgus monkeys given rhPTH (1–34) for 18 months. J Bone Miner Res. 2003;18:769–775. doi: 10.1359/jbmr.2003.18.4.769. [DOI] [PubMed] [Google Scholar]
- 35.Paschalis EP, Jacenko O, Olsen B, Mendelsohn R, Boskey AL. Fourier transform infrared microspectroscopic analysis identifies alterations in mineral properties in bones from mice transgenic for type X collagen. Bone. 1996;19:151–156. doi: 10.1016/8756-3282(96)00164-0. [DOI] [PubMed] [Google Scholar]
- 36.Boskey AL, Gadaleta S, Gundberg C, Doty SB, Ducy P, Karsenty G. Fourier transform infrared microspectroscopic analysis of bones of osteocalcin-deficient mice provides insight into the function of osteocalcin. Bone. 1998;23:187–196. doi: 10.1016/s8756-3282(98)00092-1. [DOI] [PubMed] [Google Scholar]
- 37.Camacho NP, Rimnac CM, Meyer RA, Jr, Doty S, Boskey AL. Effect of abnormal mineralization on the mechanical behavior of X-linked hypophosphatemic mice femora. Bone. 1995;17:271–278. doi: 10.1016/8756-3282(95)00210-5. [DOI] [PubMed] [Google Scholar]
- 38.Camacho NP, Carroll P, Raggio CL. Fourier transform infrared imaging spectroscopy (FT-IRIS) of mineralization in bisphosphonate-treated oim/oim mice. Calcif Tissue Int. 2003;72:604–609. doi: 10.1007/s00223-002-1038-1. [DOI] [PubMed] [Google Scholar]
- 39.Camacho NP, Landis WJ, Boskey AL. Mineral changes in a mouse model of osteogenesis imperfecta detected by Fourier transform infrared microscopy. Connect Tissue Res. 1996;35:259–265. doi: 10.3109/03008209609029199. [DOI] [PubMed] [Google Scholar]
- 40.Boskey AL, Spevak L, Paschalis E, Doty SB, McKee MD. Osteopontin deficiency increases mineral content and mineral crystallinity in mouse bone. Calcif Tissue Int. 2002;71:145–154. doi: 10.1007/s00223-001-1121-z. [DOI] [PubMed] [Google Scholar]
- 41.Atti E, Gomez S, Wahl SM, Mendelsohn R, Paschalis E, Boskey AL. Effects of transforming growth factor-beta deficiency on bone development: a Fourier transform-infrared imaging analysis. Bone. 2002;31:675–684. doi: 10.1016/s8756-3282(02)00905-5. [DOI] [PubMed] [Google Scholar]
- 42.Misof BM, Roschger P, Tesch W, Baldock PA, Valenta A, Messmer P, Eisman JA, Boskey AL, Gardiner EM, Fratzl P, Klaushofer K. Targeted overexpression of vitamin D receptor in osteoblasts increases calcium concentration without affecting structural properties of bone mineral crystals. Calcif Tissue Int. 2003;73:251–257. doi: 10.1007/s00223-002-2139-6. [DOI] [PubMed] [Google Scholar]
- 43.Anderson HC, Sipe JB, Hessle L, Dhanyamraju R, Atti E, Camacho NP, Millan JL. Impaired calcification around matrix vesicles of growth plate and bone in alkaline phosphatase- deficient mice. Am J Pathol. 2004;164:841–847. doi: 10.1016/s0002-9440(10)63172-0. [DOI] [PMC free article] [PubMed] [Google Scholar]
- 44.Atti E, Boskey AL, Canalis E. Overexpression of IGF-binding protein 5 alters mineral and matrix properties in mouse femora: an infrared imaging study. Calcif Tissue Int. 2005;76:187–193. doi: 10.1007/s00223-004-0076-2. [DOI] [PubMed] [Google Scholar]
- 45.Ling Y, Rios HF, Myers ER, Lu Y, Feng JQ, Boskey AL. DMP1 depletion decreases bone mineralization in vivo: an FTIR imaging analysis. J Bone Miner Res. 2005;20:2169–2177. doi: 10.1359/JBMR.050815. [DOI] [PMC free article] [PubMed] [Google Scholar]
- 46.Xu T, Bianco P, Fisher LW, Longenecker G, Smith E, Goldstein S, Bonadio J, Boskey A, Heegaard AM, Sommer B, Satomura K, Dominguez P, Zhao C, Kulkarni AB, Robey PG, Young MF. Targeted disruption of the biglycan gene leads to an osteoporosis-like phenotype in mice. Nat Genet. 1998;20:78–82. doi: 10.1038/1746. [DOI] [PubMed] [Google Scholar]
- 47.Boskey AL, Goldberg M, Kulkarni A, Gomez S. Infrared imaging microscopy of bone: Illustrations from a mouse model of Fabry disease. Biochim Biophys Acta. 2006;1758:942–947. doi: 10.1016/j.bbamem.2006.02.019. [DOI] [PMC free article] [PubMed] [Google Scholar]
- 48.Boskey AL. Bone mineral crystal size. Osteoporosis International. 2003;14(S5):16–21. doi: 10.1007/s00198-003-1468-2. [DOI] [PubMed] [Google Scholar]
- 49.Paschalis EP, Betts F, DiCarlo E, Mendelsohn R, Boskey AL. FTIR micro-spectroscopic analysis of human iliac crest biopsies from untreated osteoporotic bone. Calcif Tissue Int. 1997;61:487–492. doi: 10.1007/s002239900372. [DOI] [PubMed] [Google Scholar]
- 50.Boskey AL, DiCarlo E, Paschalis E, West P, Mendelsohn R. Comparison of mineral quality and quantity in iliac crest biopsies from high- and low-turnover osteoporosis: an FT-IR microspectroscopic investigation. Osteoporos Int. 2005;16:2031–2038. doi: 10.1007/s00198-005-1992-3. [DOI] [PMC free article] [PubMed] [Google Scholar]
- 51.Huang RY, Miller LM, Carlson CS, Chance MR. In situ chemistry of osteoporosis revealed by synchrotron infrared microspectroscopy. Bone. 2003;33:514–521. doi: 10.1016/s8756-3282(03)00233-3. [DOI] [PubMed] [Google Scholar]
- 52.Faibish D, Ott SM, Boskey AL. Mineral changes in osteoporosis: a review. Clin Orthop Relat Res. 2006;443:28–38. doi: 10.1097/01.blo.0000200241.14684.4e. [DOI] [PMC free article] [PubMed] [Google Scholar]
- 53.Faibish D, Gomes A, Boivin G, Binderman I, Boskey A. Infrared imaging of calcified tissue in bone biopsies from adults with osteomalacia. Bone. 2005;36:6–12. doi: 10.1016/j.bone.2004.08.019. [DOI] [PubMed] [Google Scholar]
- 54.Boskey A. Mineral changes in osteopetrosis. Crit Rev Eukaryot Gene Expr. 2003;13:109–116. doi: 10.1615/critreveukaryotgeneexpr.v13.i24.50. [DOI] [PubMed] [Google Scholar]
- 55.Boskey A, Mendelsohn R. referenced above Boskey AL. Assessment of bone mineral and matrix using backscatter electron imaging and FTIR imaging. Curr Osteoporos Rep. 2006;4:71–75. doi: 10.1007/s11914-006-0005-6. [DOI] [PubMed] [Google Scholar]
- 56.Ruppel ME, Burr DB, Miller LM. Chemical makeup of microdamaged bone differs from undamaged bone. Bone. 2006;39:318–324. doi: 10.1016/j.bone.2006.02.052. [DOI] [PubMed] [Google Scholar]
- 57.Zhang Y, Zhang M. Three-dimensional macroporous calcium phosphate bioceramics with nested chitosan sponges for load-bearing bone implants. J Biomed Mater Res. 2002;61:1–8. doi: 10.1002/jbm.10176. [DOI] [PubMed] [Google Scholar]
- 58.Dekker RJ, de Bruijn JD, Stigter M, Barrere F, Layrolle P, van Blitterswijk CA. Bone tissue engineering on amorphous carbonated apatite and crystalline octacalcium phosphate-coated titanium discs. Biomaterials. 2005;26:5231–5239. doi: 10.1016/j.biomaterials.2005.01.057. [DOI] [PubMed] [Google Scholar]
- 59.Li J, Yun H, Gong Y, Zhao N, Zhang X. Investigation of MC3T3-E1 cell behavior on the surface of GRGDS-coupled chitosan. Biomacromolecules. 2006;7:1112–1123. doi: 10.1021/bm050913r. [DOI] [PubMed] [Google Scholar]
- 60.Verma D, Katti K, Katti D. Bioactivity in in situ hydroxyapatite-polycaprolactone composites. J Biomed Mater Res A. 2006;78:772–780. doi: 10.1002/jbm.a.30774. [DOI] [PubMed] [Google Scholar]
- 61.Boyan BD, Bonewald LF, Paschalis EP, Lohmann CH, Rosser J, Cochran DL, Dean DD, Schwartz Z, Boskey AL. Osteoblast-mediated mineral deposition in culture is dependent on surface microtopography. Calcif Tissue Int. 2002;71:519–529. doi: 10.1007/s00223-001-1114-y. [DOI] [PubMed] [Google Scholar]
- 62.Halvorsen YD, Franklin D, Bond AL, Hitt DC, Auchter C, Boskey AL, Paschalis EP, Wilkison WO, Gimble JM. Extracellular matrix mineralization and osteoblast gene expression by human adipose tissue-derived stromal cells. Tissue Eng. 2001;7:729–741. doi: 10.1089/107632701753337681. [DOI] [PubMed] [Google Scholar]
- 63.Toworfe GK, Composto RJ, Shapiro IM, Ducheyne P. Nucleation and growth of calcium phosphate on amine-, carboxyl- and hydroxyl-silane self-assembled monolayers. Biomaterials. 2006;27:631–642. doi: 10.1016/j.biomaterials.2005.06.017. [DOI] [PubMed] [Google Scholar]
- 64.Weiss P, Bohic S, Lapkowski M, Daculsi G. Application of FT-IR microspectroscopy to the study of an injectable composite for bone and dental surgery. J Biomed Mater Res. 1998;41:167–170. doi: 10.1002/(sici)1097-4636(199807)41:1<167::aid-jbm20>3.0.co;2-j. [DOI] [PubMed] [Google Scholar]
- 65.Skrtic D, Antonucci JM, Eanes ED, Eidelman N. Dental composites based on hybrid and surface-modified amorphous calcium phosphates. Biomaterials. 2004;25:1141–1150. doi: 10.1016/j.biomaterials.2003.08.001. [DOI] [PubMed] [Google Scholar]
- 66.Schmitt M, Weiss P, Bourges X, Amador del Valle G, Daculsi G. Crystallization at the polymer/calcium-phosphate interface in a sterilized injectable bone substitute IBS. Biomaterials. 2002;23:2789–2794. doi: 10.1016/s0142-9612(02)00015-7. [DOI] [PubMed] [Google Scholar]
- 67.Kazarian SG, Chan KL, Maquet V, Boccaccini AR. Characterisation of bioactive and resorbable polylactide/Bioglass composites by FTIR spectroscopic imaging. Biomaterials. 2004;25:3931–3938. doi: 10.1016/j.biomaterials.2003.10.099. [DOI] [PubMed] [Google Scholar]
- 68.Huber M, Trattnig S, Lintner F. Anatomy, biochemistry, and physiology of articular cartilage. Investigative Radiology. 2000;35:573–580. doi: 10.1097/00004424-200010000-00003. [DOI] [PubMed] [Google Scholar]
- 69.Goldring MB. The Musculoskeletal System: Articular Cartilage. In: Klippel JH, Weyand CM, Wortmann RL, editors. Primer on the Rheumatic Diseases. Atlanta: The Arthritis Foundation; 1997. pp. 14–18. [Google Scholar]
- 70.Aydelotte MB, Greenhill RR, Kuettner KE. Differences between sub-populations of cultured bovine articular chondrocytes. II. Proteoglycan metabolism. Connect Tissue Res. 1988;18:223–234. doi: 10.3109/03008208809016809. [DOI] [PubMed] [Google Scholar]
- 71.Aydelotte MB, Kuettner KE. Differences between sub-populations of cultured bovine articular chondrocytes. I. Morphology and cartilage matrix production. Connect Tissue Res. 1988;18:205–222. doi: 10.3109/03008208809016808. [DOI] [PubMed] [Google Scholar]
- 72.Iannone F, Lapadula G. The pathophysiology of osteoarthritis. Aging Clin Exp Res. 2003;15:364–72. doi: 10.1007/BF03327357. [DOI] [PubMed] [Google Scholar]
- 73.Malemud CJ, Islam N, Haqqi TM. Pathophysiological mechanisms in osteoarthritis lead to novel therapeutic strategies. Cells Tissues Organs. 2003;174:34–48. doi: 10.1159/000070573. [DOI] [PubMed] [Google Scholar]
- 74.Mort JS, Billington CJ. Articular cartilage and changes in arthritis: matrix degradation. Arthritis Res. 2001;3:337–341. doi: 10.1186/ar325. [DOI] [PMC free article] [PubMed] [Google Scholar]
- 75.Jackson DW, Simon TM, Aberman HM. Symptomatic articular cartilage degeneration: the impact in the new millennium. Clin Orthop Relat Res. 2001:S14–S25. [PubMed] [Google Scholar]
- 76.Mithoefer K, Williams RJ, III, Warren RF, Potter HG, Spock CR, Jones EC, Wickiewicz TL, Marx RG. The microfracture technique for the treatment of articular cartilage lesions in the knee. A prospective cohort study. J Bone Joint Surg Am. 2005;87:1911–1920. doi: 10.2106/JBJS.D.02846. [DOI] [PubMed] [Google Scholar]
- 77.Gudas R, Stankevicius E, Monastyreckiene E, Pranys D, Kalesinskas RJ. Osteochondral autologous transplantation versus microfracture for the treatment of articular cartilage defects in the knee joint in athletes. Knee Surg Sports Traumatol Arthrosc. 2006;14:834–842. doi: 10.1007/s00167-006-0067-0. [DOI] [PubMed] [Google Scholar]
- 78.Bae DK, Yoon KH, Song SJ. Cartilage healing after microfracture in osteoarthritic knees. Arthroscopy. 2006;22:367–374. doi: 10.1016/j.arthro.2006.01.015. [DOI] [PubMed] [Google Scholar]
- 79.Mithoefer K, Williams RJ, III, Warren RF, Wickiewicz TL, Marx RG. High-Impact Athletics After Knee Articular Cartilage Repair: A Prospective Evaluation of the Microfracture Technique. Am J Sports Med. 2006;34:1413–1418. doi: 10.1177/0363546506288240. [DOI] [PubMed] [Google Scholar]
- 80.Kuo AC, Rodrigo JJ, Reddi AH, Curtiss S, Grotkopp E, Chiu M. Microfracture and bone morphogenetic protein 7 (BMP-7) synergistically stimulate articular cartilage repair. Osteoarthritis Cartilage. 2006;14:1126–1135. doi: 10.1016/j.joca.2006.04.004. [DOI] [PubMed] [Google Scholar]
- 81.Pennock AT, Robertson CM, Wagner F, Harwood FL, Bugbee WD, Amiel D. Does subchondral bone affect the fate of osteochondral allografts during storage? Am J Sports Med. 2006;34:586–591. doi: 10.1177/0363546505281815. [DOI] [PubMed] [Google Scholar]
- 82.Glenn RE, Jr, McCarty EC, Potter HG, Juliao SF, Gordon JD, Spindler KP. Comparison of fresh osteochondral autografts and allografts: a canine model. Am J Sports Med. 2006;34:1084–1093. doi: 10.1177/0363546505284846. [DOI] [PubMed] [Google Scholar]
- 83.Alford JW, Cole BJ. Cartilage restoration, part 2: techniques, outcomes, and future directions. Am J Sports Med. 2005;33:443–460. doi: 10.1177/0363546505274578. [DOI] [PubMed] [Google Scholar]
- 84.Ginat DT, Kenan S, Steiner GC. Osteoarticular allograft of the proximal humerus--histopathological study 18 years after implantation. Acta Orthop. 2005;76:934–938. doi: 10.1080/17453670610046136. [DOI] [PubMed] [Google Scholar]
- 85.Malinin T, Temple HT, Buck BE. Transplantation of osteochondral allografts after cold storage. J Bone Joint Surg Am. 2006;88:762–770. doi: 10.2106/JBJS.D.02991. [DOI] [PubMed] [Google Scholar]
- 86.Amin AA, Bartlett W, Gooding CR Sood M, Skinner JA, Carrington RW, Briggs TW, Bentley G. The use of autologous chondrocyte implantation following and combined with anterior cruciate ligament reconstruction. Int Orthop. 2006;30:48–53. doi: 10.1007/s00264-005-0025-3. [DOI] [PMC free article] [PubMed] [Google Scholar]
- 87.Krishnan SP, Skinner JA, Carrington RW, Flanagan AM, Briggs TW, Bentley G. Collagen-covered autologous chondrocyte implantation for osteochondritis dissecans of the knee: two- to seven-year results. J Bone Joint Surg Br. 2006;88:203–205. doi: 10.1302/0301-620X.88B2.17009. [DOI] [PubMed] [Google Scholar]
- 88.Gooding CR, Bartlett W, Bentley G, Skinner JA, Carrington R, Flanagan A. A prospective, randomised study comparing two techniques of autologous chondrocyte implantation for osteochondral defects in the knee: Periosteum covered versus type I/III collagen covered. Knee. 2006;13:203–210. doi: 10.1016/j.knee.2006.02.011. [DOI] [PubMed] [Google Scholar]
- 89.Wasiak J, Clar C, Villanueva E. Cochrane Database Syst Rev. Autologous cartilage implantation for full thickness articular cartilage defects of the knee. 2006;3:CD003323. doi: 10.1002/14651858.CD003323.pub2. [DOI] [PubMed] [Google Scholar]
- 90.Roberts S, Hollander AP, Caterson B, Menage J, Richardson JB. Matrix turnover in human cartilage repair tissue in autologous chondrocyte implantation. Arthritis Rheum. 2001;44:2586–2598. doi: 10.1002/1529-0131(200111)44:11<2586::aid-art439>3.0.co;2-i. [DOI] [PubMed] [Google Scholar]
- 91.Gemmiti CV, Guldberg RE. Fluid flow increases type II collagen deposition and tensile mechanical properties in bioreactor-grown tissue-engineered cartilage. Tissue Eng. 2006;12:469–479. doi: 10.1089/ten.2006.12.469. [DOI] [PubMed] [Google Scholar]
- 92.Mahmoudifar N, Doran PM. Effect of seeding and bioreactor culture conditions on the development of human tissue-engineered cartilage. Tissue Eng. 2006;12:1675–1685. doi: 10.1089/ten.2006.12.1675. [DOI] [PubMed] [Google Scholar]
- 93.Potter K, Butler JJ, Adams C, Fishbein KW, McFarland EW, Horton WE, Spencer RG. Cartilage formation in a hollow fiber bioreactor studied by proton magnetic resonance microscopy. Matrix Biol. 1998;17:513–523. doi: 10.1016/s0945-053x(98)90099-3. [DOI] [PubMed] [Google Scholar]
- 94.Potter K, Fishbein KW, Horton WE, Spencer RG. Morphometric analysis of cartilage grown in a hollow fiber bioreactor using NMR microscopy. In: Blümler P, Blümlich B, Botto R, Fukushima E, editors. Spatially Resolved Magnetic Resonance. Weinheim: Wiley–VCH Press; 1998. pp. 363–371. [Google Scholar]
- 95.Huin-Amargier C, Marchal P, Payan E, Netter P, Dellacherie E. New physically and chemically crosslinked hyaluronate (HA)-based hydrogels for cartilage repair. J Biomed Mater Res A. 2006;76:416–424. doi: 10.1002/jbm.a.30536. [DOI] [PubMed] [Google Scholar]
- 96.Yamaoka H, Asato H, Ogasawara T, Nishizawa S, Takahashi T, Nakatsuka T, Koshima I, Nakamura K, Kawaguchi H, Chung UI, Takato T, Hoshi K. Cartilage tissue engineering using human auricular chondrocytes embedded in different hydrogel materials. J Biomed Mater Res A. 2006;78:1–11. doi: 10.1002/jbm.a.30655. [DOI] [PubMed] [Google Scholar]
- 97.Montembault A, Tahiri K, Korwin-Zmijowska C, Chevalier X, Corvol MT, Domard A. A material decoy of biological media based on chitosan physical hydrogels: application to cartilage tissue engineering. Biochimie. 2006;88:551–564. doi: 10.1016/j.biochi.2006.03.002. [DOI] [PubMed] [Google Scholar]
- 98.Vinatier C, Guicheux J, Daculsi G, Layrolle P, Weiss P. Cartilage and bone tissue engineering using hydrogels. Biomed Mater Eng. 2006;16:S107–S113. [PubMed] [Google Scholar]
- 99.George A, Veis A. FTIRS in H2O demonstrates that collagen monomers undergo a conformational transition prior to thermal self-assembly in vitro. Biochemistry. 1991;30:2372–2377. doi: 10.1021/bi00223a011. [DOI] [PubMed] [Google Scholar]
- 100.Lazarev YA, Grishkovsky BA, Khromova TB. Amide I band of IR spectrum and structure of collagen and related polypeptides. Biopolymers. 1985;24:1449–1478. doi: 10.1002/bip.360240804. [DOI] [PubMed] [Google Scholar]
- 101.Lazarev YA, Grishkovsky BA, Khromova TB, Lazareva AV, Grechishko VS. Bound water in collagen-like triple helical structure. Biopolymers. 1992;32:189–195. doi: 10.1002/bip.360320209. [DOI] [PubMed] [Google Scholar]
- 102.Bychkov SM, Bogatov VN, Kuz’mina SA. [Study of different proteoglycan salts] Biull Eksp Biol Med. 1981;92:302–305. [PubMed] [Google Scholar]
- 103.Bychkov SM, Kuz’mina SA. [Study of eye proteoglycans by means of infrared spectroscopy] Biull Eksp Biol Med. 1991;111:475–477. [PubMed] [Google Scholar]
- 104.Bychkov SM, Kuz’mina SA. [Study of tissue proteoglycans by means of infrared spectroscopy] Biull Eksp Biol Med. 1992;114:246–249. [PubMed] [Google Scholar]
- 105.Camacho NP, West P, Torzilli PA, Mendelsohn R. FTIR microscopic imaging of collagen and proteoglycan in bovine cartilage. Biopolymers. 2001;62:1–8. doi: 10.1002/1097-0282(2001)62:1<1::AID-BIP10>3.0.CO;2-O. [DOI] [PubMed] [Google Scholar]
- 106.Potter K, Kidder LH, Levin IW, Lewis EN, Spencer RG. Imaging of collagen and proteoglycan in cartilage sections using Fourier transform infrared spectral imaging. Arthritis Rheum. 2001;44:846–855. doi: 10.1002/1529-0131(200104)44:4<846::AID-ANR141>3.0.CO;2-E. [DOI] [PubMed] [Google Scholar]
- 107.Kim M, Bi X, Horton WE, Spencer RG, Camacho NP. Fourier transform infrared imaging spectroscopic analysis of tissue engineered cartilage: histologic and biochemical correlations. J Biomed Opt. 2005;10:031105. doi: 10.1117/1.1922329. [DOI] [PubMed] [Google Scholar]
- 108.Bi X, Li G, Doty SB, Camacho NP. A novel method for determination of collagen orientation in cartilage by Fourier transform infrared imaging spectroscopy (FT-IRIS) Osteoarthritis Cartilage. 2005;13:1050–1058. doi: 10.1016/j.joca.2005.07.008. [DOI] [PubMed] [Google Scholar]
- 109.Jackson M, Choo LP, Watson PH, Halliday WC, Mantsch HH. Beware of connective tissue proteins: assignment and implications of collagen absorptions in infrared spectra of human tissues. Biochim Biophys Acta. 1995;1270:1–6. doi: 10.1016/0925-4439(94)00056-v. [DOI] [PubMed] [Google Scholar]
- 110.West PA, Torzilli PA, Chen C, Lin P, Camacho NP. Fourier transform infrared imaging spectroscopy analysis of collagenase-induced cartilage degradation. J Biomed Opt. 2005;10:14015. doi: 10.1117/1.1854131. [DOI] [PubMed] [Google Scholar]
- 111.Kiviranta P, Rieppo J, Korhonen RK, Julkunen P, Toyras J, Jurvelin JS. Collagen network primarily controls Poisson’s ratio of bovine articular cartilage in compression. J Orthop Res. 2006;24:690–699. doi: 10.1002/jor.20107. [DOI] [PubMed] [Google Scholar]
- 112.Korhonen RK, Julkunen P, Rieppo J, Lappalainen R, Konttinen YT, Jurvelin JS. Collagen network of articular cartilage modulates fluid flow and mechanical stresses in chondrocyte. Biomech Model Mechanobiol. 2006;5:150–159. doi: 10.1007/s10237-006-0021-6. [DOI] [PubMed] [Google Scholar]
- 113.David-Vaudey E, Burghardt A, Keshari K, Brouchet A, Ries M, Majumdar S. Fourier Transform Infrared Imaging of focal lesions in human osteoarthritic cartilage. Eur Cell Mater. 2005;10:51–60. doi: 10.22203/ecm.v010a06. [DOI] [PubMed] [Google Scholar]
- 114.Bi X, Yang X, Bostrom MP, Camacho NP. Fourier transform infrared imaging spectroscopy investigations in the pathogenesis and repair of cartilage. Biochim Biophys Acta. 2006;1758:934–941. doi: 10.1016/j.bbamem.2006.05.014. [DOI] [PubMed] [Google Scholar]
- 115.Kim M, Hidaka C, Cheng C, Ramaswamy S, Spencer RG, Camacho NP. Development and Analysis of Tissue-Engineered Mammalian Cartilage in a Hollow-Fiber Bioreactor: FTIR Spectroscopic and Gene Expression Studies. 6th Symposium of the International Cartilage Repair Society; 2006. pp. P3–5. abstr. [Google Scholar]
- 116.Dorotka R, Windberger U, Macfelda K, Bindreiter U, Toma C, Nehrer S. Repair of articular cartilage defects treated by microfracture and a three-dimensional collagen matrix. Biomaterials. 2005;26:3617–3629. doi: 10.1016/j.biomaterials.2004.09.034. [DOI] [PubMed] [Google Scholar]
- 117.Gill TJ, McCulloch PC, Glasson SS, Blanchet T, Morris EA. Chondral defect repair after the microfracture procedure: a nonhuman primate model. Am J Sports Med. 2005;33:680–685. doi: 10.1177/0363546504271744. [DOI] [PubMed] [Google Scholar]
- 118.Litzke LE, Wagner E, Baumgaertner W, Hetzel U, Josimovic-Alasevic O, Libera J. Repair of extensive articular cartilage defects in horses by autologous chondrocyte transplantation. Ann Biomed Eng. 2004;32:57–69. doi: 10.1023/b:abme.0000007791.81433.1a. [DOI] [PubMed] [Google Scholar]
- 119.Potter HG, Foo LF, Tamaroff E, Lyman S, Camacho NP, Kim M, Ryaby J, Moynihan D, Grande DA. MRI, Quantitative T2 Mapping And FT-IRIS Of Cartilage Repair Using A Synthetic Thrombin Receptor-Based Peptide (TP-508). A Rabbit Model; 6th Symposium of the International Cartilage Repair Society; 2006. pp. P3–37. abstr. [Google Scholar]
- 120.Kim M, Charlton D, Doty SB, Camacho NP, Maher SA. Distribution of PLGA and PVA in Hydrogels as Determined By Fourier Transform Infrared Imaging Spectroscopy (FT-IRIS). 6th Symposium of the International Cartilage Repair Society; 2006. pp. P3–54. abstr. [Google Scholar]
- 121.Mendelsohn R, Flach CR, Moore DJ. Determination of molecular conformation and permeation in skin via IR spectroscopy, microscopy, and imaging. Biochim Biophys Acta. 2006;1758:923–933. doi: 10.1016/j.bbamem.2006.04.009. [DOI] [PubMed] [Google Scholar]
- 122.Li G, Thomson M, Dicarlo E, Yang X, Nestor B, Bostrom MP, Camacho NP. A chemometric analysis for evaluation of early-stage cartilage degradation by infrared fiber-optic probe spectroscopy. Appl Spectrosc. 2005;59:1527–1533. doi: 10.1366/000370205775142593. [DOI] [PubMed] [Google Scholar]