Abstract
The mapping of functional genes plays an important role in studies of genome structure, function, and evolution, as well as allowing gene cloning and marker-assisted selection to improve agriculturally important traits. Simple sequence repeats (SSRs) developed from expressed sequence tags (ESTs), EST–SSR (eSSR), can be employed as putative functional marker loci to easily tag corresponding functional genes. In this paper, 2218 eSSRs, 1554 from G. raimondii-derived and 754 from G. hirsutum-derived ESTs, were developed and used to screen polymorphisms to enhance our backbone genetic map in allotetraploid cotton. Of the 1554 G. raimondii-derived eSSRs, 744 eSSRs were able to successfully amplify polymorphisms between our two mapping parents, TM-1 and Hai7124, presenting a polymorphic rate of 47.9%. However, only a 23.9% (159/754) polymorphic rate was produced from G. hirsutum-derived eSSRs. No relationship was observed between the level of polymorphism, motif type, and tissue origin, but the polymorphism appeared to be correlated with repeat type. After integrating these new eSSRs, our enhanced genetic map consists of 1790 loci in 26 linkage groups and covers 3425.8 cM with an average intermarker distance of 1.91 cM. This microsatellite-based, gene-rich linkage map contains 71.96% functional marker loci, of which 87.11% are eSSR loci. There were 132 duplicated loci bridging 13 homeologous At/Dt chromosome pairs. Two reciprocal translocations after polyploidization between A2 and A3, and between A4 and A5, chromosomes were further confirmed. A functional analysis of 975 ESTs producing 1122 eSSR loci tagged in the map revealed that 60% had clear BLASTX hits (<1e−10) to the Uniprot database and that 475 were associated mainly with genes belonging to the three major gene ontology categories of biological process, cellular component, and molecular function; many of the ESTs were associated with two or more category functions. The results presented here will provide new insights for future investigations of functional and evolutionary genomics, especially those associated with cotton fiber improvement.
COTTON (Gossypium spp.) is a major cash crop, being the world's leading natural fiber for the manufacture of textiles and edible oil. Cotton consists of at least 45 diploid and 5 allotetraploid species (Fryxell 1992). The allotetraploid cotton species, which include two commercially important cultivated species, Gossypium hirsutum L. and G. barbadense L., were generated by A- and D-compound genomes (Fryxell 1992). The best living models of the ancestral A- and D-genome parents are G. herbaceum and G. raimondii, respectively (Endrizzi et al. 1985). A-genome diploid cottons produce spinnable fibers and have been cultivated, while D-genome species produce very short and appressed fibers. Nevertheless, many quantitative trait loci (QTL) for fiber-related traits have been identified in the D-subgenome of tetraploid cotton (Jiang et al. 1998; Kohel et al. 2001; Park et al. 2005; Paterson et al. 2003; Shen et al. 2005; Ulloa et al. 2005), suggesting that the D-genome contains important genes or regulators of fiber morphogenesis and fiber properties.
In recent years, the goal of cotton breeding has changed from enhancing yield to improving fiber quality with the acceleration of spinning speeds. Therefore, systematically elucidating the molecular mechanisms of cotton fiber development and regulation and identifying the key genes or QTL affecting fiber quality will be of great significance to improving cotton fiber quality. A high-density molecular map, especially one that includes functional markers associated with fiber genes or the fiber transcriptome, will be very important in allowing direct tagging of target genes associated with fiber quality. A genetic map will supply molecular markers linked closely with fiber quality QTL and allow the study of interactions among functional genes. To date, several genetic maps of cotton genomes have been constructed using diverse DNA molecular markers and mapping populations (Ulloa and Meredith 2000; Ulloa et al. 2002; Zhang et al. 2002; Lacape et al. 2003; Mei et al. 2004; Rong et al. 2004; Zhang et al. 2005; Frelichowski et al. 2006). The most saturated tetraploid cotton map is from Rong et al. (2004), which is composed of 2584 loci at 1.72-cM intervals in 26 linkage groups. However, these tagged loci were mostly from restriction fragment length polymorphism (RFLP) probes, which are not practical for molecular marker-assisted selection breeding.
Microsatellites or simple sequence repeats (SSRs) are tandem repeats of short (1 to 6 bp) DNA sequences. SSRs exist throughout the whole genome of an organism in both noncoding and coding regions. The distinguishing features of SSR loci include their high information content, codominant inheritance pattern, even distribution along chromosomes, reproducibility, and locus specificity (Kashi et al. 1997; Röder et al. 1998a,b). In the past, genomic SSRs (gSSRs) were developed on the basis of isolating and sequencing clones containing putative SSR regions in cotton, together with designing and testing flanking primers. Their development is typically costly, time consuming, and labor intensive. However, as a plethora of DNA sequences have been deposited in online databases, they can now be easily downloaded from GenBank and surveyed for identification of SSRs. Expressed sequence tag (EST) derived-SSRs (eSSRs) have some intrinsic advantages over gSSRs because they are obtained easily and inexpensively by electronic sorting and are present in expressed regions of the genome. The usefulness of eSSRs also lies in their expected transferability because the primers are designed on the basis of the more highly conserved coding regions of the genome (Varshney et al. 2005). In recent years, great efforts have been made to develop genome SSRs (Reddy et al. 2001; Nguyen et al. 2004; Frelichouski et al. 2006) (http://www.resgen.com) and EST–SSRs (Saha et al. 2003; Qureshi et al. 2004; Han et al. 2004, 2006; Taliercio et al. 2006) for cotton, and a web page (http://www.genome.clemson.edu/projects/cotton) for cotton microsatellite database (CMD) involving all of the available cotton SSR information has been constructed (Blenda et al. 2006). These SSR markers have been widely used in cotton genetic mapping (Reddy et al. 2001; Zhang et al. 2002; Han et al. 2004; Nguyen et al. 2004; Abdurakhmonov et al. 2005; Song et al. 2005; Park et al. 2005; Frelichouski et al. 2006; Han et al. 2006). Recently, more cotton ESTs, mostly from different fiber developmental stages, were publicly released in GenBank (http://www.ncbi.nlm.nih.gov/dbEST/dbEST_summary.html), and a global assembly of cotton ESTs from 30 cDNA libraries with their Uniport BLASTX hits, gene ontology annotation, and Pfam analysis results have been made freely accessible (Udall et al. 2006). These important data provide new valuable resources for developing functional markers and performing functional analysis on the basis of mapping information.
In our laboratory, a polymerase chain reaction (PCR)-based linkage map was constructed and enhanced using a [(TM-1 × Hai7124) × TM-1] interspecific BC1 mapping population in allotetraploid cotton (Han et al. 2004, 2006; Song et al. 2005). In this study, 2218 new eSSR markers from EST sequences in G. raimondii (C. B. Wang et al. 2006) and G. hirsutum were developed and used to screen polymorphisms between the mapping parents TM-1 and Hai7124. The results enabled us to integrate 816 polymorphic eSSR marker loci into our backbone genetic map. This mostly microsatellite-based, gene-rich, saturated cotton linkage map is helpful for improving our understanding of structural and evolutionary genomics and, ultimately, for mining new genes associated with fiber development to aid in the molecular breeding of fiber-related genes.
MATERIALS AND METHODS
Development of eSSR markers:
New eSSR primer pairs (2218) (designated as “NAU” for Nanjing Agricultural University) were developed using 58,906 nonredundant EST sequences from G. raimondii, 12,463 from G. hirsutum acc. TM-1, and 11,692 from G. hirsutum cv. Xuzhou142, which are publicly available in GenBank (http://www.ncbi.nlm.nih.gov/dbEST/dbEST_summary.html). Among the 1554 G. raimondii-derived eSSRs, 747 were derived from 719 EST sequences from the first true leaf library and 807 were derived from 778 EST sequences from a −3- to 3-day post-anthesis (dpa) ovule cDNA library (C. B. Wang et al. 2006). Of the 664 G. hirsutum-derived eSSRs, 454 were derived from 454 EST sequences from a −3- to 3-dpa TM-1 ovule cDNA library and 210 were derived from 295 EST sequences from a 5- to 10-dpa Xuzhou142 fiber cDNA library. The search standards for different repeat motifs are as described in C. B. Wang et al. (2006). The program Primer 3.0 (http://frodo.wi.mit.edu/cgi-bin/primer3/primer3_www.cgi) was used in eSSR primer design. The primers were synthesized by Invitrogen (Shanghai, China). These newly developed eSSR primer sequences, Genbank accession number, repeat motif and number, expected product size, and polymorphic information between TM-1 and Hai7124 are presented in supplemental Table S1 at http://www.genetics.org/supplemental/. Other SSR primer information used in the article can be easily downloaded at http://www.mainlab.clemson.edu/cmd/projects.
Plant material, DNA extraction, PCR amplification, and electrophoresis:
The mapping population was composed of 138 BC1 individuals that were generated from the cross [(TM-1 × Hai7124) × TM-1] (Song et al. 2005). TM-1 is a genetic standard line of Upland cotton and Hai7124 is a commercial Sea island Verticillium-resistant cultivar.
Cotton genomic DNA was isolated from the two parents and each BC1 individual as described by Paterson et al. (1993). SSR–PCR amplifications were performed using a Peltier Thermal Cycler-225 (MJ Research) and electrophoresis of the products was performed as described by Zhang et al. (2000, 2002).
Construction of genetic linkage map:
All 2218 eSSR primer pairs were first used to screen polymorphisms between TM-1 and Hai7124. Markers found to be polymorphic were then used to survey 138 individuals of the BC1 mapping population. The maternal (TM-1) genotype and the heterozygous (F1) genotype were scored as 1 and 3 in the BC1 population, respectively. Missing data were noted as “—”. The χ2 test for goodness of fit was used to assess the Mendelian 1:1 inheritance in the BC1 segregating population.
JoinMap 3.0 (van Ooijen and Voorrips 2001) was employed to construct the genetic linkage map. The Kosambi mapping function (Kosambi 1944) was used to convert recombination frequency to genetic map distance (centimorgan, cM). All linkage groups were determined at log-of-odds (LOD) scores ≥6. Linkage groups were assigned to chromosomes on the basis of our backbone linkage maps (Han et al. 2004, 2006) and BAC–FISH [fluorescence in situ hybridization (FISH) using bacterial artificial chromosome (BAC) clones as probes] results (K. Wang et al. 2006). So we used our published chromosome naming system (K. Wang et al. 2006) in which the A-subgenome chromosomes are identified as A1 through A13, and the homeologous D-subgenome chromosomes are designated D1 through D13 since chromosome homeology has been established following Cotton Genetic Nomenclature in the United States (Kohel 1973). Aneuploid tests using a series of cytologically identified monotelodisomic (25II + Ii) and monosomic (25II + I) chromosome substitution aneuploid lines (F1) available for those newly anchored markers on the distal regions were used to confirm linkage groups. These aneuploid hybrids were produced by crossing aneuploids with a TM-1 background with G. barbadense acc. 3-79.
Putative gene ontology and metabolic pathway analysis:
The mapped markers were categorized on the basis of their homologous gene function. A putative gene ontology and a high-level functional category of mapped markers were obtained on the basis of the UniProt Gene Ontology database (Camon et al. 2004). A perl script that allows these ESTs to be compared with the UniProt protein database (http://www.pir.uniprot.org) has been written. A list of gene associations between the UniProt database entries and their gene annotations are maintained by the Gene Ontology Consortium (http://www.geneontology.org/GO.current.annotations.shtml). The gene ontology numbers for the best homologous hits were used to find molecular function, cellular component, and biological process ontology for these sequences. Furthermore, BLAST2GO (http://www.blast2go.de) offers metabolic pathway analysis using the KEGG (Kyoto Encyclopedia of Genes and Genomes) database (http://www.genome.jp/kegg/) (Kanehisa and Goto 2000).
RESULTS
High polymorphism amplified by G.raimondii-derived eSSRs:
A total of 58,906 nonredundant EST sequences in G. raimondii from the NCBI were selected and characterized for eSSRs. A total of 2620 microsatellite sequences containing 2818 eSSRs with motifs ranging from 1 to 6 bp were searched, with trinucleotide repeats being most abundant (38.31%), followed by dinucleotide repeats (24.09%) (C. B. Wang et al. 2006). From these ESTs containing SSRs in G. raimondii, 1554 eSSR primer pairs were developed and used to screen the interspecific polymorphisms between the two mapping parents, G. hirsutum acc. TM-1 and G. barbadense cv. Hai7124. Among them, 744 of the primer pairs amplified polymorphisms and yielded a 47.9% polymorphic rate, which is more than twice as high as the 18.2% rate from G. hirsutum and the 23.3% rate from G. arboreum-derived eSSRs reported previously (Han et al. 2004, 2006). The highly polymorphic G. raimondii-derived primers can supply the more portable PCR markers needed for saturated genetic map construction and marker-assisted improvement of the world's leading fiber crop.
To explore why these G. raimondii-derived eSSRs produce such a high polymorphism rate (47.9%) in tetraploid cotton, the relationships between polymorphism, repeat, motif type, and tissue origin were further investigated. Of our 1554 newly developed eSSR primer pairs, 763, 361, 138, 89, and 66 were for trinucleotide, dinucleotide, tetranucleotide, hexanucleotide, and pentanucleotide repeats, respectively. Their polymorphic rates were as high as 58.43% (52/89) for hexanucleotide repeats, followed by 52.17% (72/138) for tetranucleotide, 50.69% (183/361) for dinucleotide, 44.30% (338/763) for trinucleotide, and 37.88% (25/66) for pentanucleotide repeat motif eSSRs. Furthermore, a polymorphic rate as high as 54.01% (74/137) was also observed for the compound motif eSSRs. Thus the polymorphic rate from tetranucleotide and dinucleotide repeat types was slightly higher than that from trinucleotide repeat types at 51.10 and 45.77%, respectively.
Among all identified motif types, A/T occurred at the highest frequency (18.37%), followed by AT/TA (14.83%), AAG/TTC (9.62%), and AG/TC (6.46%) (C. B. Wang et al. 2006). With the exception of the A/T motif, ESTs containing di- to hexa- SSR repeat motifs were used to design EST–SSR primer pairs. Our comparison of different motif types between the polymorphic and monomorphic eSSRs revealed no relationship between polymorphism and motif type. AT/TA was the most abundant motif with a polymorphic frequency of 17.91%, followed by the motifs AAG/TTC (10.59%) and AG/TC (7.46%) (Figure 1). At the same time, the most repeated motif types were also AT/TA followed by AAG/TTC in monomorphic eSSR. Therefore, AT/TA and AAG/TTC appeared to be the most abundant repeat motif types in G. raimondii ESTs.
Figure 1.—
Polymorphism and distribution frequency of EST-derived SSRs from G. raimondii based on motif types.
No relationship was observed between polymorphism and tissue origins. Of 744 polymorphic eSSRs, 387 corresponded to ESTs from the −3- to 3-dpa ovule cDNA library and 357 were from the first true leaf cDNA library. However, the polymorphic rates were similar, 47.9 and 47.8%, respectively, for these two origins between TM-1 and Hai7124.
Construction of a microsatellite-based, gene-rich linkage map in tetraploid cotton:
Both the 1554 G. raimondii-derived and 664 G. hirsutum-derived eSSRs (supplemental Table S1 at http://www.genetics.org/supplemental/) were employed to screen interspecific polymorphisms between G. hirsutum L. acc. TM-1 and G. barbadense L. cv. Hai7124. Among them, 744 and 159 amplified polymorphisms and yielded polymorphic rates of 47.9 and 23.9%, respectively. Of these polymorphic markers, 604 were codominant, 158 were dominant in Hai7124, and 141 were dominant in TM-1. As TM-1 was used as the recurrent parent in the backcrossing population, the 141 dominant loci from TM-1 could not be used to construct genetic maps. Therefore, 762 polymorphic eSSRs were used to enhance our genetic map. From them, a total of 885 discrete loci were generated, with 650 SSRs amplifying a single locus, 101 SSRs amplifying two loci, and 11 SSRs amplifying three loci.
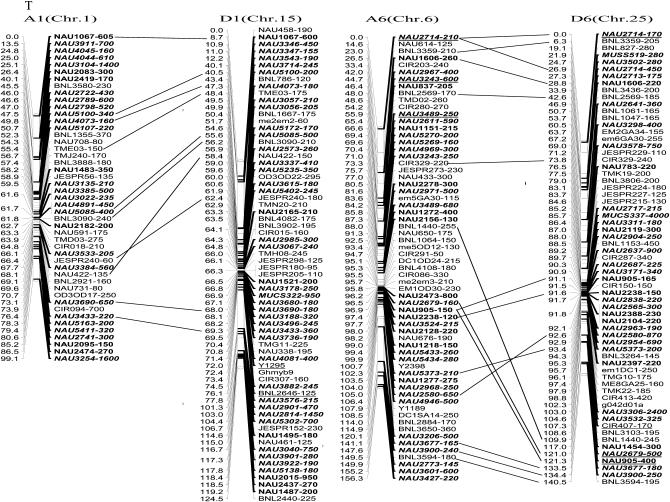
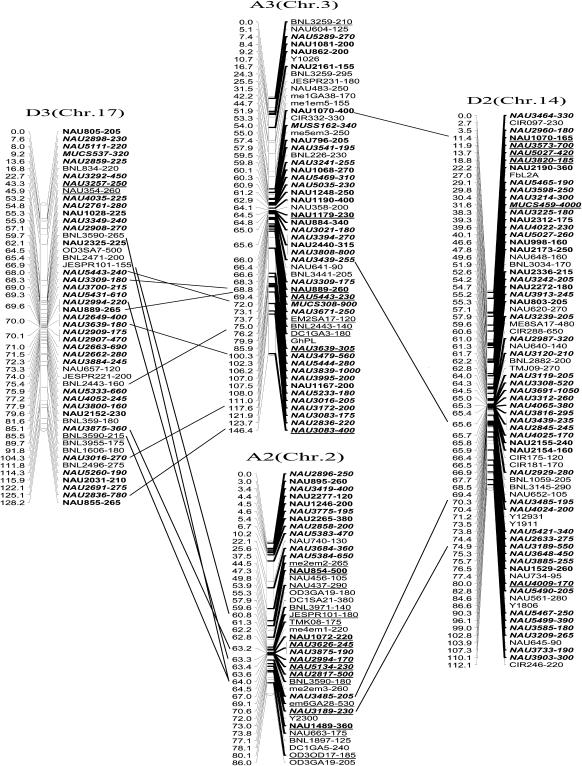
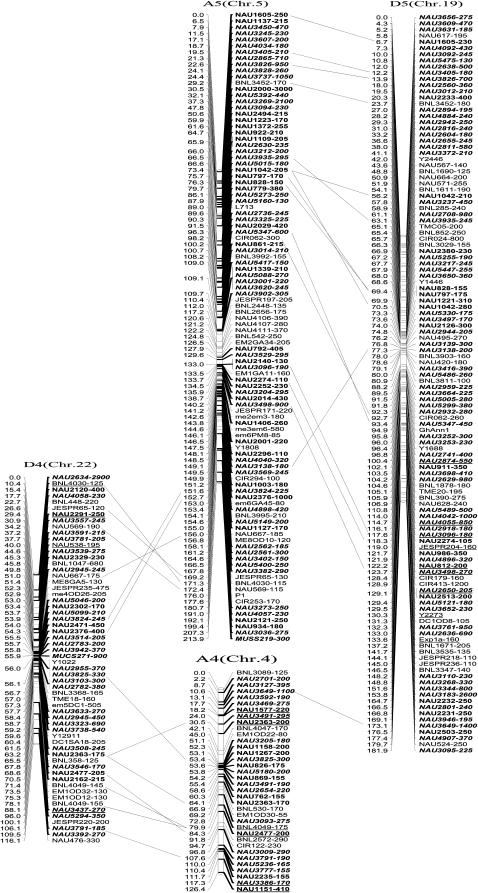
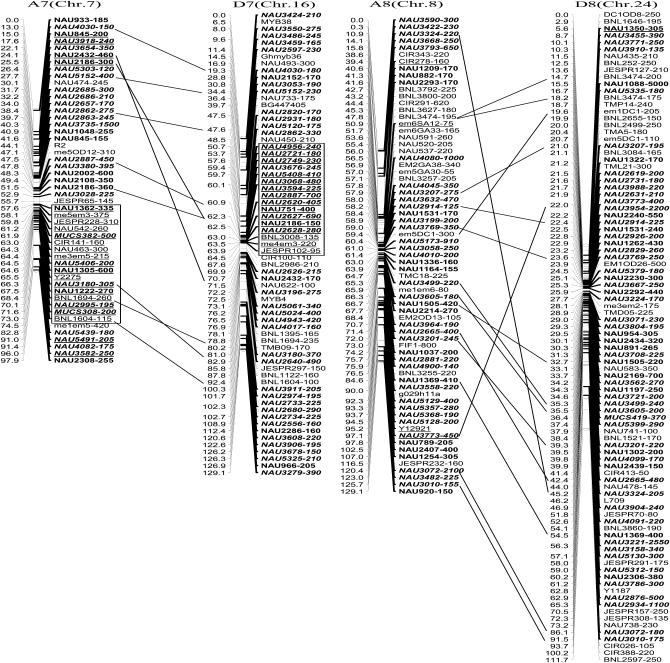
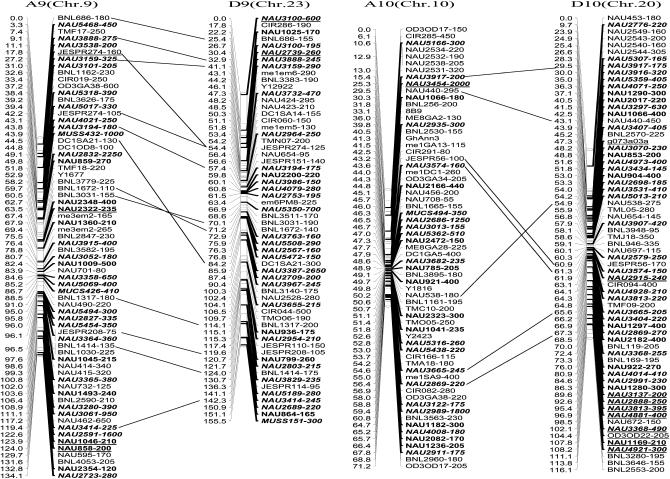
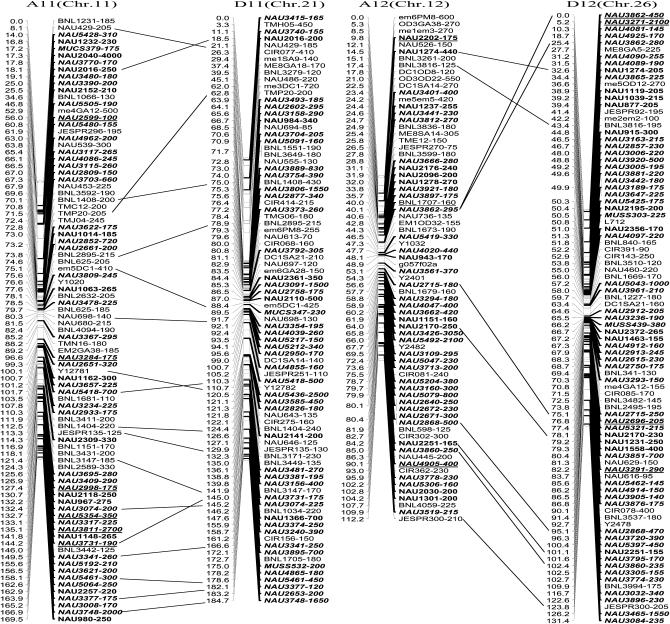
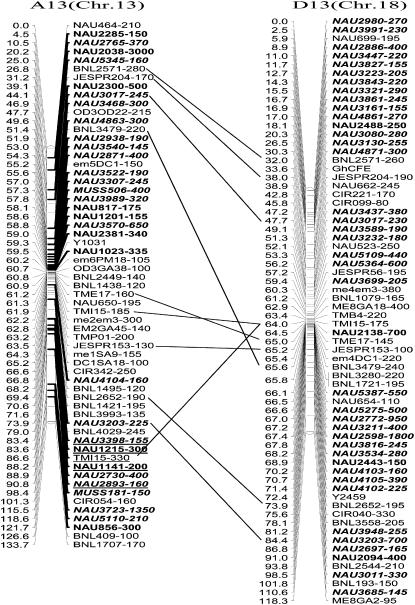
The newly constructed genetic map using Joinmap software is composed of 1790 loci including 1122 eSSR loci, 495 genomic gSSR loci, 121 SRAP marker loci, 7 loci from end-sequencing data of BAC clones and 45 genes (data not shown) in 26 linkage groups and cover 3425.8 cM with an average intermarker distance of 1.91 cM (Figure 2). Of these, 883 loci were integrated into our previously published map containing 907 loci and spanning 5060 cM with an average intermarker distance of 5.57 cM using Mapmaker software (Han et al. 2006). The enhanced linkage groups account for 820 loci (1675.6 cM) with a 2.04-cM interval distance in the A-subgenomes and 970 loci (1750.2 cM) with a 1.80-cM interval distance in the D-subgenomes. The largest gap between two adjacent loci is 28.0 cM (on chromosome D1). The number of intervals remaining in the tetraploid map >10 cM was reduced to 33. Among these, 20 were in the At genome and 13 were in the Dt genome (Table 1).
Figure 2.—
An enhanced genetic map constructed using a BC1 population obtained from the interspecific cross: G. hirsutum L. acc. TM-1 × G. barbadense L. cv. Hai7124. Chromosomes and linkage groups are arranged by 13 homeologous pairs and their corresponding conventional chromosome numbers as chromosome 1–26 in parentheses. Positions of loci are given in centimorgans (Kosambi 1944). Fragment sizes from Hai7124 allele (in base pair) are given next to the marker name, and the unmarked marker loci fragment sizes indicate unpublished tagged genes. All EST–SSR markers are indicated in boldface type and newly developed EST–SSR markers in this study are in boldface italics. Deviated loci are underlined and the deviated interval in A7 and D7 is boxed. Homeologous loci identified are connected by a bar.
TABLE 1.
Loci composition and recombination distances of chromosomes in the enhanced genetic map of G. hirsutum L. cv. TM-1 and G. barbadense L. cv. Hai7124
| Chromosomea | Total loci | Size (cM) | Average distance (cM) | No. of gaps >10 cM (largest) |
|---|---|---|---|---|
| A-subgenome | ||||
| A1 (Chr. 1) | 47 | 99.1 | 2.11 | 4 (13.7) |
| A2 (Chr. 2) | 40 | 86.0 | 2.15 | 2 (11.9) |
| A3 (Chr. 3) | 56 | 146.4 | 2.61 | 3 (22.7) |
| A4 (Chr. 4) | 36 | 126.4 | 3.51 | 2 (11.6) |
| A5 (Chr. 5) | 102 | 213.9 | 2.10 | 2 (10.6) |
| A6 (Chr. 6) | 64 | 156.3 | 2.44 | 2 (20.9) |
| A7 (Chr. 7) | 50 | 97.9 | 1.96 | 1 (13.0) |
| A8(Chr. 8) | 69 | 129.1 | 1.87 | 2 (22.9) |
| A9 (Chr. 9) | 68 | 134.1 | 1.97 | 0 (9.5) |
| A10 (Chr. 10) | 65 | 71.2 | 1.10 | 0 (9.8) |
| A11 (Chr. 11) | 88 | 169.5 | 1.93 | 1 (12.2) |
| A12 (Chr. 12) | 74 | 112.2 | 1.52 | 0 (6.3) |
| A13 (Chr. 13) | 61 | 133.7 | 2.19 | 1 (14.2) |
| At-Total | 820 | 1675.6 | 2.04 | 20 (22.9) |
| D-subgenome | ||||
| D1(Chr. 15) | 68 | 124.5 | 1.83 | 2 (28.0) |
| D2 (Chr. 14) | 75 | 112.1 | 1.49 | 0 (7.9) |
| D3 (Chr. 17) | 51 | 128.2 | 2.51 | 2 (20.6) |
| D4 (Chr. 22) | 60 | 116.1 | 1.94 | 1 (10.4) |
| D5 (Chr. 19) | 120 | 181.9 | 1.52 | 1 (11.0) |
| D6 (Chr. 25) | 65 | 140.5 | 2.16 | 2 (12.9) |
| D7 (Chr. 16) | 67 | 129.1 | 1.93 | 0 (9.5) |
| D8 (Chr. 24) | 94 | 111.7 | 1.19 | 2 (12.9) |
| D9 (Chr. 23) | 60 | 155.5 | 2.59 | 1 (17.8) |
| D10 (Chr. 20) | 67 | 116.1 | 1.73 | 1 (14.2) |
| D11 (Chr. 21) | 86 | 184.7 | 2.15 | 1 (16.9) |
| D12 (Chr. 26) | 89 | 131.4 | 1.48 | 0 (8.5) |
| D13 (Chr. 18) | 68 | 118.3 | 1.74 | 0 (8.8) |
| Dt-Total | 970 | 1750.2 | 1.80 | 13 (27.8) |
| Total | 1790 | 3425.8 | 1.91 | 33 (28.0) |
Chromosomes are designated using A and D codes corresponding to 13 homeologous group pairs according to K. Wang et al. (2006). Their corresponding conventional chromosome numbers as chromosomes 1–13 in A-genome and chromosomes 14–26 in D-genome chromosome are in parentheses.
Notably, the D- and A-genome species-derived eSSRs were preferentially tagged in their corresponding homologous subgenome in the tetraploid map. However, the polymorphic eSSRs from G. hirsutum were evenly distributed in the At/Dt subgenome and chromosome (Table 2). Among 660 loci amplified by G. raimondii-derived eSSR, 257 loci (141 from fiber and 116 from leaf ESTs) were assigned to A-subgenome chromosomes and 403 loci (206 from fiber and 197 from leaf ESTs) were assigned to D-subgenome chromosomes, with a ratio of tagged loci of At:Dt = 1:1.6. Some linkage groups were greatly saturated due to the addition of loci identified using G. raimondii-derived eSSR. For example, 53 new loci were added to D5, 40 to D12, 36 to D8, 35 to A5, and 34 to both D2 and D7. The polymorphic eSSR from G. arboreum mapped 95 loci to the A-subgenome and 64 loci to the D-subgenome, with a ratio of tagged loci of At:Dt = 1.5:1. However, the polymorphic eSSR from G. hirsutum contributed 150 loci to the A-subgenome and 153 loci to the D-subgenome, with a ratio of tagged loci of At:Dt = 1:1. A similar phenomenon was also observed in the mapping of G. arboreum and G. hirsutum-derived eSSR (Han et al. 2004, 2006).
TABLE 2.
Tagging information in chromosomes of EST–SSRs from different genomes
| Genome (no. of primer pairs designed)
|
||||
|---|---|---|---|---|
| Chromosomea | Ab (1379) | ADc (1250) | Dd (1554) | Total (4453) |
| No. loci tagged | ||||
| A1 (Chr. 1) | 2 | 11 | 17 | 30 |
| A2 (Chr. 2) | 4 | 6 | 11 | 21 |
| A3 (Chr. 3) | 12 | 9 | 17 | 38 |
| A4 (Chr. 4) | 5 | 8 | 15 | 28 |
| A5 (Chr. 5) | 14 | 25 | 35 | 74 |
| A6 (Chr. 6) | 6 | 13 | 18 | 37 |
| A7 (Chr. 7) | 7 | 13 | 16 | 36 |
| A8 (Chr. 8) | 10 | 10 | 25 | 45 |
| A9 (Chr. 9) | 9 | 9 | 18 | 36 |
| A10 (Chr. 10) | 6 | 9 | 13 | 28 |
| A11 (Chr. 11) | 8 | 15 | 32 | 55 |
| A12 (Chr. 12) | 6 | 13 | 24 | 43 |
| A13 (Chr. 13) | 6 | 9 | 16 | 31 |
| Total in A-subgenome | 95 | 150 | 257 | 502 |
| D1(Chr. 15) | 5 | 10 | 27 | 42 |
| D2 (Chr. 14) | 4 | 15 | 34 | 53 |
| D3 (Chr. 17) | 3 | 10 | 24 | 37 |
| D4 (Chr. 22) | 1 | 12 | 24 | 37 |
| D5 (Chr. 19) | 6 | 24 | 53 | 83 |
| D6 (Chr. 25) | 6 | 7 | 23 | 36 |
| D7 (Chr. 16) | 2 | 12 | 34 | 48 |
| D8 (Chr. 24) | 12 | 12 | 36 | 60 |
| D9 (Chr. 23) | 4 | 6 | 22 | 32 |
| D10 (Chr. 20) | 7 | 10 | 25 | 42 |
| D11 (Chr. 21) | 4 | 12 | 31 | 47 |
| D12 (Chr. 26) | 10 | 13 | 40 | 63 |
| D13 (Chr. 18) | 0 | 10 | 30 | 40 |
| Total in D-subgenome | 64 | 153 | 403 | 620 |
| At:Dt | 1.5:1 | 1:1 | 1:1.6 | |
The chromosome designation is the same as in Table1.
The ESTs used to develop 1379 EST–SSR primer pairs were from fiber EST databases in a 7- to 10-dpa fiber cDNA library in Gossypium arboreum cv. AKA8401. Of these primer pairs, 544 were developed by Han et al. (2004), 219 by Wilkins (http://cfg.ucdavis.edu), and 616 by Park et al. (2005).
The ESTs used to develop 1250 EST–SSR primer pairs were from fiber EST databases in six cDNA libraries of Gossypium hirsutum. Of these primer pairs, 489 were developed by Han et al. (2004) from 3 cDNA libraries of 5- to 25-dpa of germplasm “7235,” -0 to 5-dpa ovules, and 3- to 22-dpa fibers from G. hirsutum cv. Xuzhou 142 (Gou and Chen); 454 from cDNA library of −3- to 3-dpa ovules from G. hirsutum cv. TM-1 (Yang and Chen); 97 from cotton boll abscission zone cDNA library (Wan and Wing); 210 from 5- to 10-dpa fibers from G. hirsutum cv. Xuzhou 142 (Zhu et al.).
The ESTs used to develop 1554 EST–SSR primer pairs were from G. raimondii ESTs, with 747 from the first true leaf library and 807 from ovules from −3- to 3-dpa cDNA library (Udall et al.). All ESTs were released in GenBank (http://www.ncbi.nlm.nih.gov/dbEST/dbEST_summary.html).
More duplicated loci had been integrated into the 13 homeologous chromosome pairs in tetraploid cotton. In this map, the duplicated loci identified by 132 SSR primer pairs sufficiently bridged 13 expected homeologous At/Dt chromosomes. Ten duplicated loci were in A1 and D1 homeologous chromosomes, 2 in A2 and D2, 7 in A3 and D3, 5 in A4 and D4, 14 in A5 and D5, 14 in A6 and D6, 9 in A7 and D7, 16 in A8 and D8, 12 in A9 and D9, 7 in A10 and D10, 18 in A11 and D11, 9 in A12 and D12, and 9 in A13 and D13 (Figure 2 and supplemental Table S2 at http://www.genetics.org/supplemental/).
Two post-polyploidization reciprocal translocations of A2/A3 and A4/A5 in the At subgenome were also further confirmed by several homologous loci, such as NAU2994, NAU3875, BNL3590, and JESPR101 in A2 and D3; NAU1070 and NAU3439 in A3 and D2; NAU569, NAU667, NAU2376, NAU3824, BNL4030, and JESPR65 in A5 and D4; and NAU3649 in A4 and D5 (Figure 2).
Of 885 newly produced discrete loci, 780 (87.7%) loci fit and 105 (12.3%) deviated from Mendelian 1:1 inheritance. Of 105 deviated segregation loci, 50 favored an excess of heterozygotes and 55 favored an excess of homozygotes. Notably, the most distorted segregated loci integrated in the map were clustered to several chromosomal regions. Two distorted intervals were found in the A7 and D7 homeologous chromosome pairs. Seventeen consecutive loci were spanning 15.4 cM in A7 and 16 loci spanning 13.2 cM in D7, with each located near the distal region of their corresponding chromosome. All were skewed toward the heterozygotes (Figure 2), which indicated that Hai7124 alleles were preferentially transmitted in these intervals.
We mapped 1122 eSSR loci homologous to ESTs, 121 SRAP loci with target coding sequences in the genome (Li and Quiros 2001), and 45 genes in the presently revised map containing 1790 loci. The newly developed map contained 71.96% functional marker loci, in which 87.11% were eSSR loci. Furthermore, 1122 eSSR loci were identified mainly by 993 eSSRs developed from 975 ESTs belonging to the transcriptomes of different cDNA libraries from G. arboreum, G. raimondii, and G. hirsutum. The chromosome tagging information of these ESTs is shown in Table 2. In this tetraploid map, 502 eSSR loci were tagged in the A-subgenome, with 74, 55, and 45 loci on the A5, A11, and A8 chromosomes, respectively, and 620 eSSR loci were tagged in the D-subgenome, with 83, 63, and 60 loci on the D5, D12, and D8 chromosomes, respectively. Because most ESTs homologous to the mapped eSSR loci were from fiber ESTs, further exploring the relationship between these EST loci and fiber developmental genes and their potential usages in QTL mapping of fiber qualities may prove to be interesting.
Putative functions of the products of ESTs containing SSR:
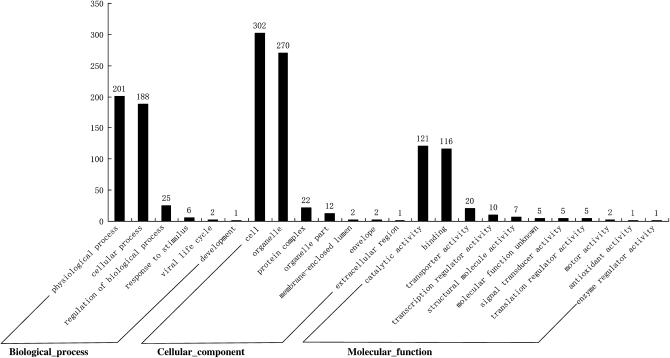
The revised map contains 1122 mapped markers homologous to 975 ESTs from the A-, AD-, and D-transcriptomes. To explore the potential utility of the eSSR markers for use in the research of cotton genome structure and functional distribution, 975 ESTs were used to search for similar protein sequences in the Uniprot database (BLASTX). The functional information and chromosome location of 1122 eSSR loci homologous to ESTs is presented online as supplemental Table S2 (http://www.genetics.org/supplemental/). Using the best hits found by BLASTX (<1e−10), an inferred putative gene ontology annotation was found for nearly 50% of the tagged sequences. Of the 475 known functional ESTs, 247 were associated with genes belonging to biological process, 324 with cellular component, and 290 with molecular function. Of the 247 known biological-process annotations, two main types were associated with physiological and cellular processes, 81.4 and 76.1%, respectively. Of the 324 annotations belonging to the cellular-component function, 93.2% were associated with cells and 83.3% with organelles. Of the 290 ESTs that belong to the molecular-function category, the functions of the largest portions were catalysis (41.7%) and binding (40.0%) (Figure 3). Many ESTs were elucidated functions in two or more categories, with 109 associated with the three major gene ontology categories, 47 with biological processes and cellular components, 73 with biological processes and molecular functions, and 48 with cellular components and molecular functions. The number of ESTs with only one known function of a biological process, cellular component, or molecular function was 18, 120, and 60, respectively.
Figure 3.—
Gene ontology (GO) categories of 975 fiber ESTs producing 1122 mapped markers.
Further investigation of the chromosomal distribution of ESTs with known molecular function showed that most loci of known function were found in the A5 and D5 homeologous groups. Many ESTs in the two linkage groups appeared to be involved with transcription, including transcription factor activity, DNA binding, RNA binding, ethylene-responsive element binding, GTP binding, ATP binding, and calmodulin binding. Moreover, some important functional genes associated with fiber development such as E6 and the fiber proteins Fb37 and Fb28, as well as cellulose synthase, were also tagged in the pair of homeologous groups.
Next, 475 known functional ESTs were searched using the KEGG database to determine whether they had a role in metabolism, which showed that only 39 belonged to a known metabolic pathway (supplemental Table S3 and supplemental Figure S1 at http://www.genetics.org/supplemental/). A representative sample of the major metabolic pathways consisted of 21 ESTs located on 13 chromosomes that were responsible for carbohydrate/energy metabolism, 11 ESTs located on 6 chromosomes responsible for amino acid metabolism, 6 ESTs located on 5 chromosomes responsible for lipid metabolism, 6 ESTs located on 4 chromosomes responsible for folding, sorting, and degradation, and 3 ESTs located on 3 chromosomes responsible for signal transduction. Interestingly, 5 ESTs responsible for carbohydrate/energy metabolism, 4 for amino acid metabolism, and 2 for folding, sorting, and degradation were simultaneously found on the A7 chromosome.
DISCUSSION
A high-density genetic map is an important tool for elucidating cotton genome structure and evolution. In particular, a PCR-based and gene-rich genetic map will provide an important opportunity to tag genes conferring traits of interest, integrate the information between genes and QTL, and allow gene cloning and marker-assisted selection breeding. EST–SSR is one type of functional marker whose polymorphisms can cause changes in gene function and bring phenotypic variation, such as the waxy gene controlling amylase content in rice (Ayers et al. 1997). As numerous EST sequences from many species have become publicly available, eSSR markers have been widely used for QTL mapping and the construction of genetic linkage groups. In recent years, many ESTs from different cotton genomes or tissues, especially cotton fiber, have been released, and the allelic diversity of microsatellites in coding sequences has been exploited. Han et al. (2004, 2006) mapped 109 G. arboreum-derived and 123 G. hirsutum-derived eSSR loci into our backbone map. Park et al. (2005) also developed 1232 eSSR markers derived from G. arboreum and identified 193 polymorphic loci with 121 anchored in a tetraploid cotton map. In this study, we constructed a genetic map containing 1790 loci and covering 3425.8 cM, with an average intermarker distance of 1.91 cM in cultivated tetraploid cotton species. Compared with the most saturated tetraploid interspecific genetic map, which includes 2584 loci at 1.72-cM intervals based mostly on RFLP probes (Rong et al. 2004), our gene-rich map contained 1122 eSSR loci, 121 SRAP loci, and 45 genes in tetraploid cotton. Unlike the RFLP map, the distribution of functional markers in our map might mirror the distribution of genes along the map. On the basis of studies showing that the genetic complexity of the cotton fiber transcriptome accounts for as much as 50% of the cotton genome (Arpat et al. 2004; Wilkins and Arpat 2005; Wilkins et al. 2005), and most EST sequences used in this article are from fiber development libraries, these anchored functional loci may be very useful not only for cotton comparative mapping and evolutionary studies, but also for marker-assisted selection to improve fiber quality and allow cloning of genes important for fiber development, especially when the markers reside in the genes responsible for a phenotypic trait of interest. We are currently conducting association mapping using phenotype data from [(TM-1 × Hai7124) × TM-1] BC1 and functional information from mapping loci and the integration between mapping loci and the QTL for fiber quality.
Many studies have revealed higher polymorphism levels in genomic SSR markers than in transcribed regions of DNA, i.e., eSSRs. Using 20 eSSRs and 22 gSSRs to genotype the A- and B-genomes of wheat, the eSSRs produced a 25% polymorphism rate whereas the gSSRs produced a 53% polymorphism rate (Eujayl et al. 2002). This is also true in Gossypium, where polymorphism between G. hirsutum and G. barbadense is as high as 49 and 56%, respectively, for gSSRs markers (Reddy et al. 2001; Nguyen et al. 2004). One exception is that only a 21% polymorphism rate was observed between G. hirsutum and G. barbadense, which was identified by developing BAC-ends SSR markers (Frelichowski et al. 2006). A roughly similar polymorphism rate was observed between G. hirsutum and G. barbadense for eSSR markers. Han et al. (2004, 2006) identified a 23.3 and 18.2% polymorphic rate between TM-1 and Hai7124, respectively, from G. arboreum and G. hirsutum-derived eSSRs. Similarly, Park et al. (2005) also detected a 19.8% polymorphic rate using G. arboreum-derived eSSRs. In this study, a 23.9% polymorphic rate between TM-1 and Hai7124 was identified from eSSRs developed from two cDNA libraries in G. hirsutum. However, a nearly 48% polymorphism rate between G. hirsutum and G. barbadense was observed using G. raimondii-derived eSSR, which is much higher than that observed by previous public data. The set of G. raimondii-derived primers with a high polymorphic frequency between G. hirsutum and G. barbadense have been used to construct the saturated genetic map; meanwhile, they are also useful for elucidating the role of the D-genome in the origin and evolution of tetraploid cotton species.
Why do G. raimondii-derived eSSRs have much higher polymorphism than that derived from G. arboreum and G. hirsutum species? From an evolutionary standpoint, the AD-tetraploid species (2n = 4x = 52) originates from an interspecific hybridization event between A- and D-genome diploid Gossypium species. The A- and D-genome diploids are estimated to have diverged from a common ancestor between 6 and 11 million years ago (Wendel 1989). G. arboreum are Old World cultivated cotton species and G. hirsutum are New World cultivated cotton species, whereas G. raimondii is wild and cannot produce spinnable fiber. Studies have shown that the expression of duplicated genes in tetraploid species at the transcriptional level may have three fates: (1) silencing of one of the duplicated copies (Wendel 2000; Adams et al. 2003); (2) molecular interactions mediated by concerted evolutionary processes leading to a rapid sequence conversion of homologous loci, homology-specific sequence elimination, and extensive genomic rearrangements (Wendel et al. 1995; Adams et al. 2003); or (3) independent evolution of the duplicated copies in allopolyploids (Cronn et al. 1999; Small and Wendel 2000).
Incorporating EST data from different cotton species and tissues in molecular genetic studies can allow a preliminary analysis of phylogenetic evolution. The eSSR markers employed in this study were developed in our laboratory from seven libraries: GA_Ea (G. arboreum developing fibers; 7–10 dpa), GH_7235 (G. hirsutum acc. 7235 developing fibers; 5–25 dpa), GH_ Xuzhou 142 (G. hirsutum cv. Xuzhou 142; 0- to 5-dpa ovules, 5–10 dpa, and 3- to 22-dpa fibers); GH_TMO (G. hirsutum acc. TM-1; −3- to 3-dpa immature ovules); GR_Ea (G. raimondii whole seedlings with the first true leaves), and GR_Eb (G. raimondii bolls; −3-dpa flower buds to +3-dpa bolls). All SSR searches from the above EST sequences used the same cut-off values for primer design.
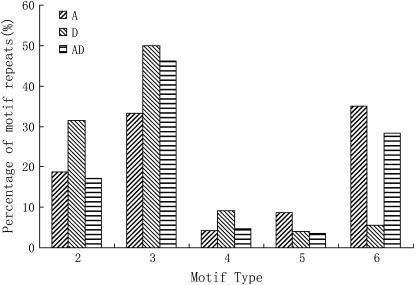
A comparison of the polymorphism rates between G. hirsutum and G. barbadense derived from different genomes, yielded the highest polymorphism rates (47.9% from fiber development tissue and 47.8% from the first true leaf tissue) for G. raimondii-derived eSSRs. Even when the eSSRs were all from fiber developmental tissue of different cotton species, the polymorphism rate from D-genome species was also higher than that from A- and AD-genome cultivated species. Further comparison of eSSR distributions among A-, AD-, and D-transcriptomes showed that the three genome species were similar in their abundance of common motifs. The frequency of trinucleotide and hexanucleotide motif repeats were most common at 74.55% for AD-, 68.43% for A-, and 55.57% for D-genome species, followed by the dinucleotide motif at 31.42% for D-, 18.68% for A-, and 17.15% for AD-genome species.
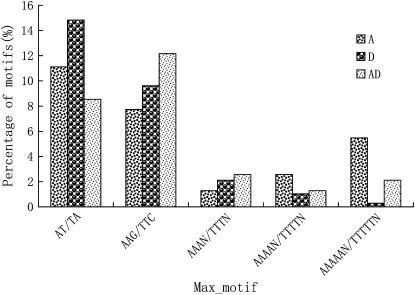
The repeat frequencies of tetranucleotide and petanucleotide were at a low level in the three species (Figure 4). The most common motif in the three genome species was AT/TA for dinucleotide, AAG/TTC for trinucleotide, and AAAN/TTTN, AAAAN/TTTTN, and AAAAAN/TTTTTN for tetranucleotide, petanucleotide, and hexanucleotide, respectively (Figure 5). However, differences in the type of abundant motifs were observed in the three genome species; i.e., D-genome species had fewer trinucleotide and hexanucleotide motif repeats and more dinucleotide repeats than A- and AD-genome species. Because trinucleotide and hexanucleotide motifs could stably reside in the coding region and suppress frameshift mutations (Varshney et al. 2005) and AT dimeric repeats have been found in the untranslated region of many species (Morgante et al. 2002; Sook et al. 2005), the differences in the type of abundant motifs may imply that different transcriptomes can potentially function as factors regulating gene expression in their individual genome species, leading to different expression characteristics of A- and D-subgenomes in tetraploid genomes. The different transcribed sequences from G. raimondii might undergo relaxed selection in their corresponding paralogous regions, evolve into silent or nonsynonymous sites, or code for genes unrelated to fiber development. This hypothesis is strongly supported by previous reports. A-genome diploid and AD-tetraploid cottons each produce spinnable fibers (Fryxell 1979). Many AA-subgenome ESTs associated with fiber development are selectively enriched in G. hirsutum (Yang et al. 2006). Purifying transcripts from the diploid A-genome and tetraploid A-subgenome revealed that tagging efficiencies in a cultivated tetraploid genetic map were relatively low. On the other hand, the D-subgenome harbored greater nucleotide and allelic diversity than did the A-subgenome in both species of G. hirsutum and G. barbadense on the basis of a comparison of duplicated paralogous Adh loci (Small and Wendel 2002; Small et al. 1999), which also suggested that differential evolutionary pressures act on the two D-subgenomes. On the basis of the above analysis, the transcriptional products from diploid D-genome species coupled with less selection pressure in the tetraploid genome could lead to a higher frequency of recombination in their paralogous sites in allotetraploid cotton. Using EST information from diploid G. raimondii combined with expression and gene diversity studies in allotetraploids might provide new information for understanding the evolution of allotetraploid species.
Figure 4.—
Comparison of the SSR repeat types derived ESTs in G. arboreum (A), G. raimondii (D), and G. hirsutum (AD).
Figure 5.—
Comparison of the maximum SSR motifs derived ESTs in G. arboreum (A), G. raimondii (D), and G. hirsutum (AD).
The tagging results for the A-, D-, and AD-genome-derived eSSRs also showed that eSSRs derived from A-genome species were preferentially tagged in the A-subgenome, and that eSSRs from D-genome species were preferentially tagged in the D-subgenome in the tetraploid linkage map. However, eSSRs derived from AD-genome species were evenly tagged in the A- and D-subgenomes of the tetraploid linkage map. These findings indicated that there were different rates of gene evolution among A- and D-genome species even though the A- and D-genome types have a common genetic origin with Gossypium. However, in AD-genome species formed by a polyploidization event of the diploid A- and D-genome, duplicated functional genes from the A- and D-subgenome were independently expressed at the same abundance owing to the At:Dt = 1:1 tagging efficiency of allotetraploid transcriptional products from fiber development stages. Even though D-genome species could not produce spinnable fiber, many studies have suggested that there are important genes that are most likely regulators of fiber morphogenesis and fiber properties in the D-subgenome in cultivated tetraploid species (Jiang et al. 1998; Kohel et al. 2001; Paterson et al. 2003; Park et al. 2005; Shen et al. 2005; Ulloa et al. 2005). Data obtained from the tagging of A-, AD-, and D-genome markers may provide new insights into polyploidy evolution and provide a foundation for elucidating the role of the D-genome in tetraploid cotton species in the future.
Acknowledgments
We thank R. J. Kohel and John Z. Yu at U. S. Department of Agriculture–Agricultural Research Service, Southern Plains Agriculture Research Center, Crop Germplasm Research Unit for supplying one set of cotton aneuploid material DNA. This work was supported by grants from National Science Foundation of China (No. 30471104), the State Key Basic Research and Development Plan of China (No. 2002CB111303), the National High-tech Program (2006AA10Z111), the Program for New Century Excellent Talents in University (NCET-04-0500), and the Program for Changjiang Scholars and Innovative Research Team in University.
References
- Abdurakhmonov, I. Y., A. A. Abdullaev, S. Saha, Z. T. Buriev, D. Arslanov et al., 2005. Simple sequence repeat marker associated with a natural leaf defoliation trait in tetraploid cotton. J. Hered. 96: 644–653. [DOI] [PubMed] [Google Scholar]
- Adams, K. L., R. Cronn, R. Percifield and J. F. Wendel, 2003. Genes duplicated by polyploidy show unequal contributions to the transcriptome and organ-specific reciprocal silencing. Proc. Natl. Acad. Sci. USA 100: 4649–4654. [DOI] [PMC free article] [PubMed] [Google Scholar]
- Arpat, A. B., M. Waugh, J. P. Sullivan, M. Gonzales, D. Frisch et al., 2004. Functional genomics of cell elongation in developing cotton fibers. Plant Mol. Biol. 54: 911–929. [DOI] [PubMed] [Google Scholar]
- Ayers, N. M., A. M. McClung, P. D. Larkin, H. F. J. Bligh, C. A. Jones et al., 1997. Microsatellite and single nucleotide polymorphism differentiate apparent amylase classes in an extended pedigree of US rice germplasm. Theor. Appl. Genet. 94: 773–781. [Google Scholar]
- Blenda, A., J. Scheffler, B. Scheffler, M. Palmer, J. M. Lacape et al., 2006. CMD: A Cotton Microsatellite Database resource for Gossypium genomics. BMC Bioinformatics 7: 132. [DOI] [PMC free article] [PubMed] [Google Scholar]
- Camon, E., M. Magrane, D. Barrell, V. Lee, E. Dimmer et al., 2004. The gene Ontology Annotation (GOA) database: sharing knowledge in uniprot with gene ontology. Nucleic Acids Res. 32: D262–D266. [DOI] [PMC free article] [PubMed] [Google Scholar]
- Cronn, R. C., R. L. Small and J. F. Wendel, 1999. Duplicated genes evolve independently after polyploid formation in cotton. Proc. Natl. Acad. Sci. USA 96: 14406–14411. [DOI] [PMC free article] [PubMed] [Google Scholar]
- Endrizzi, J. E., E. L. Turcotte and R. J. Kohel, 1985. Genetics, cytology, and evolution of Gossypium. Adv. Genet. 23: 271–375. [Google Scholar]
- Eujayl, I., M. E. Sorrells, M. Baum and P. Wolters, 2002. Isolation of EST-derived microsatellite markers for genotyping the A and B-genomes of wheat. Theor. Appl. Genet. 104: 399–407. [DOI] [PubMed] [Google Scholar]
- Frelichowski, Jr., J. E., M. B. Palmer, D. Main, J. P. Tomkins, R. G. Cantrell et al., 2006. Cotton genome mapping with new microsatellites from Acala ‘Maxxa’ BAC-ends. Mol. Gen. Genomics 275: 479–491. [DOI] [PubMed] [Google Scholar]
- Fryxell, P. A., 1979. The Natural History of the Cotton Tribe, pp. 37–47. Texas A&M University Press, College Station, TX.
- Fryxell, P. A., 1992. A revised taxonomic interpretation of Gossypium L. (Malvaceae). Rheedea 2: 108–165. [Google Scholar]
- Han, Z. G., W. Z. Guo, X. L. Song and T. Z. Zhang, 2004. Genetic mapping of EST-derived microsatellites from the diploid Gossypium arboreum in allotetraploid cotton. Mol. Genet. Genomics 272: 308–327. [DOI] [PubMed] [Google Scholar]
- Han, Z. G., C. B. Wang, X. L. Song, W. Z. Guo, J. Y. Guo et al., 2006. Characteristics, development and mapping of Gossypium hirsutum derived EST-SSR in allotetraploid cotton. Theor. Appl. Genet. 112: 430–439. [DOI] [PubMed] [Google Scholar]
- Jiang, C. X., R. J. Wright, K. M. El-Zik and A. H. Paterson, 1998. Polyploid formation created unique avenues for response to selection in Gossypium (Cotton). Proc. Natl. Acad. Sci. USA 95: 4419–4424. [DOI] [PMC free article] [PubMed] [Google Scholar]
- Kanehisa, M., and S. Goto, 2000. KEGG: Kyoto Encyclopedia of Genes and Genomes. Nucleic Acids Res. 28: 27–30. [DOI] [PMC free article] [PubMed] [Google Scholar]
- Kashi, Y., D. King and M. Soller, 1997. Simple sequence repeats as a source of quantitative genetic variation. Trends Genet. 13: 74–78. [DOI] [PubMed] [Google Scholar]
- Kohel, R. J., 1973. Genentic nomenclature in cotton. J. Hered. 64: 291–295. [Google Scholar]
- Kohel, R. J., J. Yu, Y-H. Park and G. R. Lazo, 2001. Molecular mapping and characterization of traits controlling fiber quality in cotton. Euphytica 121: 163–172. [Google Scholar]
- Kosambi, D. D., 1944. The estimation of map distance from recombination values. Ann. Eugen. 12: 172–175. [Google Scholar]
- Lacape, J. M., T. B. Nguyen, S. Thibivilliers, B. Bojinov, B. Courtois et al., 2003. A combined RFLP-SSR-AFLP map of tetraploid cotton based on a Gossypium hirsutum × Gossypium barbadense backcross population. Genome 46: 612–626. [DOI] [PubMed] [Google Scholar]
- Li, G., and C. F. Quiros, 2001. Sequence-related amplified polymorphism (SRAP), a new marker system based on a simple PCR reaction: its application to mapping and gene tagging in Brassica. Theor. Appl. Genet. 103: 455–461. [Google Scholar]
- Mei, M., N. H. Syed, W. Gao, P. M. Thaxton, C. W. Smith et al., 2004. Genetic mapping and QTL analysis of fiber-related traits in cotton (Gossypium). Theor. Appl. Genet. 108: 280–291. [DOI] [PubMed] [Google Scholar]
- Morgante, M., M. Hanafey and W. Powell, 2002. Microsatellites are preferentially associated with non-repetitive DNA in plant genomes. Nat. Genet. 30: 194–200. [DOI] [PubMed] [Google Scholar]
- Nguyen, T. B., M. Giband, P. Brottier, A. M. Risterucci and J. M. Lacape, 2004. Wide coverage of the tetraploid cotton genome using newly developed microsatellite markers. Theor. Appl. Genet. 109: 167–175. [DOI] [PubMed] [Google Scholar]
- Park, Y. H., M. S. Alabady, M. Ulloa, B. Sickler, T. A. Wilkins et al., 2005. Genetic mapping of new cotton fiber loci using EST-derived microsatellites in an interspecific recombinant inbred line cotton population. Mol. Gen. Genomics 274: 428–441. [DOI] [PubMed] [Google Scholar]
- Paterson, A. H., C. Brubaker and J. F. Wendel, 1993. A rapid method for extraction of cotton (Gossypium spp.) genomic DNA suitable for RFLP or PCR analysis. Plant Mol. Biol. Rep. 11: 122–127. [Google Scholar]
- Paterson, A. H., Y. Saranga, M. Menz, C. Jiang and R. J. Wright, 2003. QTL analysis of genotype × environmental interactions affecting cotton fiber quality. Theor. Appl. Genet. 106: 384–396. [DOI] [PubMed] [Google Scholar]
- Qureshi, S. N., S. Saha, R. V. Kantaty and J. N. Jenkins, 2004. EST-SSR: a new class of genetic markers in cotton. J. Cotton Sci. 8: 112–123. [Google Scholar]
- Reddy, O. U. K., A. E. Pepper, I. Y. Abdurakhmonov, S. Saha, J. N. Jenkins et al., 2001. The identification of dinucleotide and trinucleotide microsatellite repeat loci from cotton G. hirsutum L. J. Cotton Sci. 5: 103–113. [Google Scholar]
- Röder, M. S., V. Korzun, K. Wendehake, J. Plaschke, M. H. Tixier et al., 1998. a A microsatellite map of wheat. Genetics 149: 2007–2023. [DOI] [PMC free article] [PubMed] [Google Scholar]
- Röder, M. S., V. Korzun, B. S. Gill and M. W. Ganal, 1998. b The physical mapping of microsatellite markers in wheat. Genome 41: 278–283. [Google Scholar]
- Rong, J. K., C. Abbey, J. E. Bowers, C. L. Brubaker, C. Chang et al., 2004. A 3347-locus genetic recombination map of sequence-tagged sites reveals features of genome organization, transmission and evolution of cotton (Gossypium). Genetics 166: 389–417. [DOI] [PMC free article] [PubMed] [Google Scholar]
- Saha, S., M. Karaca, J. N. Jenkins, A. E. Zipf, U. K. Reddy et al., 2003. Simple sequence repeats as useful resources to study transcribed genes of cotton. Euphytica 130: 355–364. [Google Scholar]
- Shen, X. L., W. Z. Guo, X. F. Zhu, Y. L. Yuan, J. Z. Yu et al., 2005. Molecular mapping of QTLs for qualities in three diverse lines in Upland cotton using SSR markers. Mol. Breed. 15: 169–181. [Google Scholar]
- Small, R. L., and J. F. Wendel, 2000. Phylogeny, duplication, and intraspecific variation of Adh sequences in new world diploid cotton (Gossypium L., Malvaceae). Mol. Phyl. Evol. 16: 73–84. [DOI] [PubMed] [Google Scholar]
- Small, R. L., and J. F. Wendel, 2002. Differential evolutionary dynamics of duplicated paralogous Adh loci in allotetraploid cotton (Gossypium). Mol. Biol. Evol. 19: 597–607. [DOI] [PubMed] [Google Scholar]
- Small, R. L., J. A. Ryburn and J. F. Wendel, 1999. Low levels of nucleotide diversity at homeologous Adh loci in allotetraploid cotton (Gossypium L.). Mol. Biol. Evol. 16: 491–501. [DOI] [PubMed] [Google Scholar]
- Song, X. L., K. Wang, W. Z. Guo, J. Zhang and T. Z. Zhang, 2005. A comparison of genetic maps constructed from haploid and BC1 mapping populations from the same crossing between Gossypium hirsutum L. × G. barbadense L. Genome 48: 378–390. [DOI] [PubMed] [Google Scholar]
- Sook, J., A. Albert, J. Christopher, T. Jeff and M. Dorrie, 2005. Frequency, type, distribution and annotation of simple sequence repeats in Rosaceae ESTs. Funct. Integr. Genomics 5: 136–143. [DOI] [PubMed] [Google Scholar]
- Taliercio, E., R. D. Allen, M. Essenberg, N. Klueva, H. Nguyen et al., 2006. Analysis of ESTs from multiple Gossypium hirsutum tissues and identification of SSRs. Genome 49: 306–319. [DOI] [PubMed] [Google Scholar]
- Udall, J. A., J. M. Swanson, K. Haller, R. A. Rapp, M. E. Sparks et al., 2006. A global assembly of cotton ESTs. Genome Res. 16: 441–450. [DOI] [PMC free article] [PubMed] [Google Scholar]
- Ulloa, M., and W. R.. Meredith, Jr., 2000. Genetic linkage map and QTL analysis of agronomic and fiber quality traits in an intraspecific population. J. Cotton Sci. 4: 161–170. [Google Scholar]
- Ulloa, M., W. R. Meredith, Jr., Z. W. Shapply and A. L. Kahler, 2002. RFLP genetic linkage maps from F2.3 populations and a joinmap of Gossypium hirsutum L. Theor. Appl. Genet. 104: 200–208. [DOI] [PubMed] [Google Scholar]
- Ulloa, M., S. Saha, J. N. Jenkins, W. R. Meredith, J. C. McCarty et al., 2005. Chromosomal assignment of RFLP linkage groups harboring important QTLs on an intraspecific cotton (Gossypium hirsutum L.) joinmap. J. Hered. 96: 132–144. [DOI] [PubMed] [Google Scholar]
- van Ooijen, J. W., and R. E. Voorrips, 2001. Joinmap Version 3.0: Software for the Calculation of Genetic Linkage Maps. CPRO-DLO, Wageningen, The Netherlands.
- Varshney, R. K., A. Graner and M. E. Sorrells, 2005. Genic microsatellite markers in plants: features and applications. Trends Biotechnol. 23: 48–55. [DOI] [PubMed] [Google Scholar]
- Wang, C. B., W. Z. Guo, C. P. Cai and T. Z. Zhang, 2006. Characterization, development and exploitation of EST- derived microsatellites in Gossypium raimondii. Ulbrich. Chin. Sci. Bull. 51: 557–561. [Google Scholar]
- Wang, K., X. L. Song, Z. G. Han, W. Z. Guo, J. Z. Yu et al., 2006. Complete assignment of the chromosomes of Gossypium hirsutum L. by translocation and fluorescence in situ hybridization mapping. Theor. Appl. Genet. 113: 73–80. [DOI] [PubMed] [Google Scholar]
- Wendel, J. F., 1989. New World tetraploid cottons contain Old World cytoplasm. Proc. Natl. Acad. Sci. USA 86: 4132–4136. [DOI] [PMC free article] [PubMed] [Google Scholar]
- Wendel, J. F., 2000. Genome evolution in polyploids. Plant Mol. Biol. 42: 225–224. [PubMed] [Google Scholar]
- Wendel, J. F., A. Schnabel and T. Seelanan, 1995. Bidirectional interlocus concerted following allopolyploid speciation in cotton (Gossypium). Proc. Natl. Acad. Sci. USA 92: 280–284. [DOI] [PMC free article] [PubMed] [Google Scholar]
- Wilkins, T. A., and A. B. Arpat, 2005. The cotton fiber transcriptome. Physiol. Plantm. 124: 295–300. [Google Scholar]
- Wilkins, T. A., A. B. Arpat and B. Sickler, 2005. Cotton fiber genomics: developmental mechanisms. Pflanzenschutz-Nachrichten Bayer. 58: 119–139. [Google Scholar]
- Yang, S. S., F. Cheung, J. J. Lee, M. Ha, N. E. Wei et al., 2006. Accumulation of genome-specific transcripts, transcription factors and phytohormonal regulators during early stages of fiber cell development in allotetraploid cotton. Plant J. 47: 761–775. [DOI] [PMC free article] [PubMed] [Google Scholar]
- Zhang, J., Y. T. Wu, W. Z. Guo and T. Z. Zhang, 2000. Fast screening of microsatellite markers in cotton with PAGE/silver staining. Cotton Sci. Sin. 12: 267–269. [Google Scholar]
- Zhang, J., W. Z. Guo and T. Z. Zhang, 2002. Molecular linkage map of allotetraploid cotton (Gossypium hirsutum L. × Gossypium barbadense L.) with a haploid population. Theor. Appl. Genet. 105: 1166–1174. [DOI] [PubMed] [Google Scholar]
- Zhang, Z. S., Y. H. Xiao, M. Luo, X. B. Li, X. Y. Luo et al., 2005. Construction of a genetic linkage map and QTL analysis of fiber-related traits in upland cotton (Gossypium hirsutum L.). Euphytica 144: 91–99. [Google Scholar]


