

Abstract
The ability of a virus population to colonize a novel host is predicted to depend on the equilibrium frequency of potential colonists (i.e., genotypes capable of infecting the novel host) in the source population. In this study, we investigated the determinants of the equilibrium frequency of potential colonists in the RNA bacteriophage φ6. We isolated 40 spontaneous mutants capable of infecting a novel Pseudomonas syringae host and sequenced their host attachment genes to identify the responsible mutations. We observed 16 different mutations in the host attachment gene and used a new statistical approach to estimate that 39 additional mutations were missed by our screen. Phenotypic and fitness assays confirmed that the proximate mechanism underlying host range expansion was an increase in the ability to attach to the novel host and that acquisition of this ability most often imposed a cost for growth rate on two standard hosts. Considered in a population genetic framework, our data suggest that host range mutations should exist in phage populations at an equilibrium frequency (3 × 10⁻⁴) that exceeds the phage mutation rate by more than two orders of magnitude. Thus, colonization of novel hosts is unlikely to be limited by an inability to produce appropriate mutations.
THE increasing threat of disease emergence, especially among RNA viruses, provides considerable incentive for predicting whether and when virus populations will acquire the ability to colonize and adapt to a novel host. To make such predictions we must identify the factors that explain why viruses like human immunodeficiency virus (HIV) and influenza successfully adapted to human hosts, whereas viruses like severe acute respiratory syndrome caused outbreaks but failed to persist. Progress toward this goal will likely come from the application of ecological models that describe the colonization of sink habitats to the study of emerging pathogens (Sokurenko et al. 2006). In this study, we focus on one of the primary predictors of colonization success in these models (Holt and Gomulkiewicz 1997; Gomulkiewicz et al. 1999; Holt et al. 2003, 2004): the rate of migration into the novel habitat.
In particular, we consider the scenario in which the ability to infect a novel host requires a mutation. In this case, the migration rate will depend jointly on the rate at which viruses are transmitted to the novel host and on the equilibrium frequency of potential colonists (i.e., genotypes capable of infecting the novel host) in the source population. Although transmission rate is determined by ecological factors that must be measured in the field, the equilibrium frequency of potential colonists is determined by two evolutionary factors that can be investigated in the laboratory: mutation and selection. Mutation will act to increase the frequency of potential colonists. In contrast, if the ability to infect a novel host imposes a pleiotropic fitness cost on the standard host, selection will act to reduce the frequency of potential colonists. An equilibrium will be achieved when the effects of mutation are exactly balanced by the effects of selection. Therefore, the equilibrium frequency of potential colonists in a population growing on its standard host will depend on the mutation rate, the number of different mutations that confer the ability to infect the novel host, and the abundance and magnitude of pleiotropic fitness costs among these mutations.
There have been numerous investigations of the identity and effects of mutations that expand host range (Grez et al. 1991; Subbarao et al. 1993; Morris et al. 1994; Shioda et al. 1994; Kozak and Chakraborti 1996; Llamas-Saiz et al. 1996; Doi et al. 1997; Jonah et al. 2003; Duffy et al. 2006). However, several characteristics of these investigations limit their ability to predict equilibrium frequencies of potential colonists in natural populations. First, investigations of mutations that expand host range have tended to examine only one or a few mutations, making it difficult to infer whether other mutations are possible. Second, the mutations examined in these studies were usually the result of long-term adaptation in a laboratory or natural setting (i.e., fixed mutations). Fixed mutations have been sieved by natural selection acting on one or both of the standard and novel hosts, and therefore it is likely that the distribution of pleiotropic fitness costs among fixed mutations will differ from the distribution among new spontaneous mutations. Finally, many of these investigations were of vertebrate viruses and fitness was assayed in tissue culture, which likely mimics the natural host environment to a limited extent (e.g., because the host immune system is missing).
To overcome these obstacles we investigated the possible genetic bases of host range expansion in the RNA bacteriophage φ6, a model system in which it was possible to isolate a large random sample of mutants with an expanded host range and to measure fitness in a manner that more closely mimics the natural environment (i.e., we can measure fitness in unmanipulated bacterial hosts). We screened spontaneous φ6 mutants for the ability to infect a novel Pseudomonas syringae host. We sequenced the host attachment gene of 40 of the resulting phage to identify the mutations responsible for host range expansion and developed a statistical method to estimate the total number of ways the attachment gene can mutate to acquire the ability to infect the novel host. In addition, we determined the abundance and magnitude of the pleiotropic fitness costs associated with these mutations on two standard (permissive) hosts and identified the phenotypic basis of the host range expansion.
MATERIALS AND METHODS
Strain and culture conditions:
The double-stranded RNA bacteriophage φ6 (Cystoviridae) used in this study is a laboratory genotype descended from the original isolate (Vidaver et al. 1973). The standard laboratory host of φ6, P. syringae pathovar phaseolicola strain HB10Y, was obtained from the American Type Culture Collection (ATCC) (no. 21781); an alternate permissive host, P. syringae pathovar japonica strain M301072, was obtained from D. Guttman (University of Toronto, Toronto); and the novel host P. syringae pathovar glycinea strain R4a was obtained from J. Dangl (University of North Carolina, Chapel Hill, NC). Hereafter, hosts are referred to by their pathovar designations. Details of diluting, filtering, culture, and storage of phage and bacteria are published (Mindich et al. 1976; Chao and Tran 1997). Phage and bacteria were cultured in LC media (5 g yeast extract, 5 g NaCl, and 10 g Bacto-tryptone/liter of H2O) and stored in 4:6 glycerol:LC media (v/v) at −20° and −80°, respectively. For growth on plates, phages were mixed with the appropriate host bacteria in top agar (0.7% agar) and plated on LC plates (1.5% agar).
Mutant isolation:
φ6 clones were plated onto a lawn of the standard (permissive) host phaseolicola and incubated overnight to allow the phages to reproduce and form plaques. After 24 hr, phages were harvested from a randomly chosen isolated plaque and plated onto a fresh lawn of 200 μl of a stationary phase culture of the novel host glycinea. Only phages that acquired a host range mutation during growth of the plaque on phaseolicola form plaques on glycinea. After 24 hr, an isolated plaque was chosen randomly from the glycinea plate, and phages from this plaque were plated on a fresh lawn of glycinea to purify the mutant phages of wild-type φ6. A single plaque was harvested and stored for later use in 4:6 glycerol:LC media (v/v) at −20°. This process was repeated 40 times to obtain 40 independent host range mutants.
Sequencing:
Genome amplification and sequencing were performed as previously described (Duffy et al. 2006). Briefly, phages were grown to a high titer and viral RNA was extracted using a QIAamp Viral RNA Mini Kit (QIAGEN, Valencia, CA). Viral RNA was reverse transcribed using random hexamer primers and Superscript II RNase H- RT (Invitrogen, Carlsbad, CA), and the resulting cDNA was used as template for PCR with Taq Polymerase (Invitrogen). We amplified three sections of the medium genome segment, corresponding to bases 1298–2142, 2042–3052, and 2877–3873, which encompassed the host attachment gene, P3. PCR products were purified using EXO-SapIT (US Biological, Swampscott, MA) and sequenced in both directions using PCR primers and primers internal to each amplicon. Sequencing was performed using BigDye v3.1 (Applied Biosystems, Foster City, CA) either locally with an Avant-3100 Genetic Analyzer Sequencer (Applied Biosystems) or at the UNC Automated Sequencing Facility (University of North Carolina, Chapel Hill, NC).
Examining the characteristics of host range mutations:
We used χ2-tests to compare the chemical properties of the observed P3 mutations to the random expectation. Random expectations were determined from the frequencies of P3 codons with particular chemical properties: acidic (D, E), basic (K, R, H), hydrophilic (N, Q, S, T, Y), or hydrophobic (A, C, F, G, I, L, M, P, V, W).
Paired growth fitness assay:
Paired growth assays are a standard method for assaying fitness in φ6 (Chao 1990) and were used to assay fitness on the permissive host japonica. Each host range mutant was mixed with the wild-type φ6 at a 1:1 ratio. This mixture was plated on a bacterial lawn and incubated for 24 hr. The ratio of phage genotypes before and after the incubation was determined by plating on a mixed lawn of 200 μl of a 1:1 mixture of phaseolicola and glycinea, on which the wild-type φ6 forms turbid plaques and mutant φ6 form clear plaques. The relative fitnesses of mutant genotypes were then determined as W = R1/R0, where R0 and R1 are the ratio of mutant to wild-type phage before and after the 24-hr incubation, respectively. Replicate assays (N = 4) were collected in blocks on different days.
Plaque size fitness assay:
We recently developed a plaque size assay as an alternative means of measuring fitness on phaseolicola (Burch and Chao 2004), and this assay proved useful for measuring fitness on the novel host glycinea, on which paired growth assays are not possible (because wild-type φ6 does not grow on this host). On phaseolicola, the relationship between the paired growth measure of log(fitness) and plaque area (in square millimeters) is described by the equation: log(fitness) = 0.044 × (plaque size) − 0.34 (Burch and Chao 2004). To calibrate the relationship on glycinea, we measured plaque size and the number of phages per plaque for eight host range mutants grown on lawns of glycinea for 24 hr. As on phaseolicola, there is a linear relationship between log(fitness) and plaque area [log(phage/plaque) = 0.71498 × (plaque size) + 4.34418; R2 = 0.7721, F1,6 = 24.71, P = 0.0025]. Plaque sizes were determined by plating phages onto a lawn of the appropriate host at a low density (<50 phages per plate) to ensure nonoverlapping plaques, incubating at 25° for 24 hr, and taking digital pictures for analysis using ImageJ (NIH, Bethesda, MD; http://rsb.info.nih.gov/ij/). Each plaque size measure is a mean area of plaques on an individual plate. For each genotype, six replicate assays were collected in blocks on different days.
Attachment assays:
Attachment assays were performed following the method of Stent (1963). An exponentially growing culture of glycinea was incubated by shaking at 25° until it achieved an OD of 0.8 (∼5 × 10⁸ CFU/ml), at which point the bacteria were pelleted and resuspended in one-half the total volume of LC media. A total of 103 phage was added to 1 ml of the concentrated bacterial culture and this mixture was incubated at 25° with shaking. Immediately and after 40 min a 500-μl aliquot of this culture was centrifuged at 5000 rpm, 5° for 1 min, and 200 μl of the supernatant were plated on a lawn of phaseolicola cells to obtain a count of the unbound phage remaining in the supernatant. The attachment rate constant was then calculated as  , where N is the concentration of bacteria (determined by plating), and P0 and P40 are the number of unbound phage at 0 and 40 min, respectively. Replicate assays (n = 4 for mutant genotypes, n = 8 for wild-type φ6) were collected in blocks on different days.
Statistical analyses:
Fitness data were analyzed in Microsoft (Redmond, WA) Excel 2003 and SASv9.1 (SAS Institute, Cary, NC), using Proc GLM and Proc Corr. All models in SAS included block effects, but none of these block effects were significant. To determine which mutations caused a significant reduction in fitness on permissive host types, relative to the wild-type φ6, we calculated least significant differences (LSD). The LSD is the smallest difference between any two means that is statistically significant and is used for preplanned comparisons in ANOVA (Sokal and Rohlf 1969). The t-statistic used to calculate the LSD is determined in the same manner as the t-statistic used in a two-sample t-test, except that the mean square error (MSE) is used in place of the sample variance and the degrees of freedom is based on the MSE.
We used Proc GLM (SASv9.1) to conduct a one-way ANOVA to test for an effect of genotype on attachment rate among the phages examined in this study, including the host range mutants and the wild-type φ6. In addition, we implemented a bootstrap procedure in Matlab v6.5 (Mathworks, Natick, MA) to more directly compare the mean attachment rate of the wild-type φ6 to that of the host range mutants. We pooled the replicate attachment rate measures for all the mutants and drew 1,000,000 bootstrapped samples of eight measures with replacement from this pool. The mean attachment rates for each bootstrapped sample were used to generate a frequency distribution that describes the expectation for the wild-type φ6 mean if the wild-type φ6 attachment rate did not differ from the attachment rate of mutant phage. We obtained a P-value by determining the percentage of the bootstrapped means that were lower than the observed mean attachment rate of wild-type φ6 (also a mean of eight measures). This P-value is equivalent to the probability that the wild-type φ6 attachment rate measures were drawn from the same distribution as the mutant measures.
Estimating the total number of mutations that allow growth on glycinea:
Our experiment ran n = 39 independent trials in which one of an unknown number of possible P3 mutations that enable infection of a novel host was sampled randomly (note that 1 of our 40 trials is not included here because it did not sample a mutation in P3). We know that the observed number of mutations is a lower bound on the total number of possible adaptive mutations and use the pattern of variability in the data to estimate how many such mutations may have been missed.
This statistical problem is analogous to the well-known coupon-collecting problem (Ross 2002) in which we have collected a sample of n coupons and observed K distinct coupons, with some coupons appearing multiple times in our sample. We now want to estimate the total number of distinct coupons N from which our sample has been drawn. This estimation procedure has been used by wildlife biologists since the 1970s (Heck et al. 1975) to estimate population sizes of wild populations from samples of trapped animals.
The standard coupon-collecting problem makes several simplifying assumptions that must be adjusted to adapt the methodology for the problem at hand. In particular, the standard problem assumes that every coupon was equally likely to be sampled. However, we know that transition mutations are more likely than transversion mutations and so we expect to sample adaptive transversions less often. Wildlife biologists have made similar adjustments to their models to account for sampling heterogeneity among “trap happy” and “trap shy” animals (Miller et al. 2005). Below we develop likelihood and method-of-moments frameworks for estimating the number of mutants that enable infection of a novel host.
Maximimum likelihood:
The probability of obtaining any particular collection of mutations is described by a multinomial distribution governed by the following two rules: (1) each trial can result in one of t + r possible outcomes, where t and r are, respectively, the total number of transition and transversion mutations that enable infection of the novel host; and (2) defining α as the ratio of transitions to transversions, the probabilities of sampling particular transitions and transversions are α/(αt + r) and 1/(αt + r), respectively. If we now let the random variables J = (J1, J2,…, JT,) represent the number of times the T observed transitions occurred in our data set, and the variables K = (K1, K2,…, KR) represent the number of times the R observed transversions occurred, then the likelihood of obtaining these observations is
 |
(1) |
Since α can be estimated from an external data set, we estimated the total number of mutations that enable infection of the novel host using observed values for α, T, R, J1, J2,…, JT, and K1, K2,…, KR and then determining the values of t and r that maximize this likelihood (using the R statistical package; http://www.r-project.org/).
Method of moments:
Note that maximum-likelihood estimates for t and r depend only on  , and
, and  . (Note that
  .) Recall that α is obtained from external data. Statistical theory guarantees that any estimation procedure based on the sufficient statistics T, R, and N1 will give the same quality of inference. Therefore, we developed a method-of-moments estimate based on T, R, and N1 that is simpler to calculate and should give the same quality of inference as maximum likelihood. Using the method-of-moments estimator, the expectations for T, R, and N1 are as follows:
 |
(2) |
 |
(3) |
 |
(4) |
The formulas are not too difficult to interpret. The number of transitions that you observe (T) approximates the average number of observed transitions  , where
  is total number of transitions that exist (t) minus the expected number of transitions that were missed due to sampling error. The probability of missing a particular transition in each of the N1 trials is (1 − α/(αt + r))N1, so the mean number missed is t(1 − α/(αt + r))N1.
Rearranging Equation 3 gives  , and substituting this into Equation 1 gives
 |
(5) |
This equation was solved iteratively by starting with  and defining
 |
(6) |
and  . Because α was obtained from external data,
  was determined by rearranging the definition of
  to yield
 |
(7) |
We used a parametric bootstrap to determine a 95% confidence interval for these estimates. The bootstrap assumes that the estimates of  and
and  are the true values and generates simulated data sets on the basis of
  ,
,  , and the known α. We generated 1000 simulated data sets of 39 sampled mutations and estimated
  and
and  for each data set using Equations 6 and 7. Upper and lower 95% confidence limits were calculated, respectively, as the 26th lowest and 975th highest bootstrapped estimates.
RESULTS
Mutant identification:
We isolated a total of 40 host range mutants on the novel host glycinea. To determine which of these mutants carried unique mutations, we sequenced the P3 gene from all 40 mutants. P3 encodes the host attachment spike of φ6 (Gottlieb et al. 1988), and previous studies (Gottlieb et al. 1988; Duffy et al. 2006) implicated P3 in host range expansion. The 40 host range mutants were composed of 19 unique P3 genotypes, designated A–S (Table 1). One genotype (A) had no mutations in P3, 16 genotypes had a single mutation in P3, and two genotypes (Q and R) had two mutations in P3. However, one of the mutations present in genotypes Q and R was identical to the single mutation possessed by genotype P. These data are consistent with the presence of 17 unique nucleotide mutations in our collection that confer the ability to grow on the novel host glycinea—16 in P3 and 1 elsewhere in the genome. Of the 16 mutations in P3, only 2 (G and H) produced an identical amino acid change.
TABLE 1.
Sequence changes in the attachment gene P3 of host range mutants
| Mutant | nt mutationa | aa mutationa | No. in collection | aa propertyb |
|---|---|---|---|---|
| A | None | None | 1 | Unknown |
| B | g13a | G5S | 2 | Hydrophillic |
| C | g22a | E8K | 1 | Acidic |
| D | a23g | E8G | 5 | Acidic |
| E | a434g | D145G | 3 | Acidic |
| F | a437g | N146S | 6 | Hydrophillic |
| G | g534c | E178D | 1 | Acidic |
| H | g534t | E178D | 1 | Acidic |
| I | c1016t | P339H | 1 | Hydrophobic |
| J | a1546g | T516A | 4 | Hydrophillic |
| K | a1598c | D533A | 1 | Acidic |
| L | g1603a | D535N | 1 | Acidic |
| M | a1661t | D554V | 1 | Acidic |
| N | g1660a | D554N | 2 | Acidic |
| O | a1661c | D554A | 1 | Acidic |
| P | a1661g | D554G | 6 | Acidic |
| Q | a1661g (and t779a) | D554G (and F260Y) | 1 | Acidic (and hydrophobic) |
| R | a1661g (and c318t) | D554G (and L106L) | 1 | Acidic (NA) |
| S | c1663t | L555F | 1 | Hydrophobic |
Nucleotide and amino acid substitutions are labeled according to their position in P3. Second-site mutations are shown in parentheses.
Amino acid chemical properties correspond to the wild-type residue.
Number of mutations capable of expanding host range:
Because several mutations were represented more than once in our collection, we could use the sampling distribution of particular mutations to estimate the total number of ways that the φ6 P3 gene can be mutated to allow infection of the novel host glycinea. This estimation problem is analogous to the “coupon-collecting problem” that is well known in probability and statistics, except that we divided the mutations into two rate classes: transitions and transversions. From an external data set we know that the relative rate of transitions per transition site to transversions per transversion site (α) is 24.5 (Burch
et al. 2007). We used the method of moments (MM) to estimate the total number of transitions ( ) and transversions (
 ) that allow infection of glycinea from the sampling distribution and α (we report maximum-likelihood, ML, estimates for comparison). Recall that we observed 11 transitions and 5 transversions in our mutation sample. The MM estimate of
  was 11.9, with a 95% confidence interval of 11.0 ≤ t ≤ 14.0 (using ML,
  = 11.0). The similarity between our estimate of
  and the observed number of transitions (11) is consistent with the observation that particular transition mutations were represented as many as eight times in our collection. The MM estimate of
  was 42.9, with a 95% confidence interval of 7.8 ≤ r ≤ 103.5 (using ML,
  = 41.9). Our estimate of
  was much higher than the observed number of transversions (5), an observation that is not surprising since no transversions were represented more than once in our collection. In combination, the total number of mutations in P3 estimated to allow growth on glycinea was ∼55. P3 consists of 643 amino acids, and there are a total of 4380 potential nonsynonymous changes possible in the gene. This means that 55/4380, or 1.3% of nonsynonymous mutations in P3 are predicted to confer the ability to grow on the novel host glycinea.
Note that the value of α used here is itself an estimate, and there is some degree of uncertainty associated with this estimate. However, since α was estimated from external data (Burch
et al. 2007) to incorporate the uncertainty in our estimate of α would require an extra layer of mathematical modeling and a complete discussion of the external data set. To stay on point and because it makes no difference in the interpretation of our results, we chose not to incorporate this uncertainty in our calculations of the confidence intervals surrounding  and
and  . The estimates
  = 11.9 and
  = 42.9 would remain the same, the confidence intervals surrounding
  would be affected only slightly, and the confidence intervals surrounding
  were already sufficiently wide to indicate a low confidence in the exact estimate of r. In sum, we take our analysis to provide qualitative support for the intuition that many transversions were missed by our screen; our analysis does not indicate conclusively that exactly
  +
+  = 54.8 mutations confer the ability to infect the novel host glycinea.
Mutation characteristics:
We investigated whether the observed mutations in P3 occurred in amino acid residues with specific chemical characteristics. We used a χ2-test to compare the observed numbers of mutated residues that were acidic (six), basic (zero), hydrophilic (two), or hydrophobic (three) to the expectation based on the amino acid composition of P3 (9.16% acidic, 8.69% basic, 24.53% hydrophilic, and 57.45% hydrophobic). The chemical properties of amino acids that mutated differed significantly from the random expectation (χ2 = 34.76, d.f. = 3, P < 0.0001) and resulted from the disproportionately high number of mutations that occurred in acidic residues.
Mutational effects:
We measured the fitness of the 18 host range genotypes that resulted in different amino acid sequences (all genotypes except H) on the standard hosts phaseolicola and japonica and the novel host glycinea. To narrow our focus to only the mutations that affected host range, we first compared the fitness of the genotypes with two mutations in P3 (Q and R) to that of the genotype with one of the two mutations (P). The fitness of these phages did not differ on any of the hosts (P > 0.2 by a t-test for all six comparisons), so we excluded mutants Q and R from all subsequent fitness analyses.
The fitnesses of the remaining 16 mutant genotypes and the wild-type φ6 on the standard and novel hosts are shown in Figure 1. Fitness improvements on glycinea were generally accompanied by fitness losses on phaseolicola (Figure 1A) and japonica (Figure 1B). To assess whether these losses were statistically significant we used ANOVAs to calculate the smallest difference between means required to achieve statistical significance—the LSD. Fifteen of 16 host range mutations imposed a significant fitness cost on phaseolicola, and 10/16 imposed a significant fitness cost on japonica (Figure 1; P < 0.05; one-tailed LSD). If we, instead, use a Bonferroni correction to account for multiple comparisons (16 comparisons on each host), all but one of these comparisons remains significant.
Figure 1.—

Correlations between the effects of mutations on different hosts. (A and B) The relationship between the fitness of mutant phage on the novel host glycinea and one of two standard hosts (phaseolicola or japonica). Data points are means of four replicate measures on host japonica and means of six replicate measures on hosts glycinea and phaseolicola. The solid lines are the mean value of the wild-type φ6 on the standard host and the dashed lines correspond to the value below which mutants are significantly lower in value than wild type (the LSD). (C) The relationship between fitness on the two standard hosts. To generate the data, fitness was measured using either a plaque size assay or a paired growth assay (relative growth rate, W). Plaque area increases linearly with log W.
We also examined whether the pleiotropic effects of mutations on phaseolicola and japonica were correlated with the direct effect of mutations on glycinea. The direct effects of mutations were not significantly correlated with pleiotropic effects on either phaseolicola (Pearson's r = 0.2245, d.f. = 14, P = 0.3704) or japonica (Pearson's r = 0.0466, d.f. = 14, P = 0.8543). However, there was a significant positive correlation between the pleiotropic effects on phaseolicola and the pleiotropic effects on japonica (Figure 1C; Pearson's r = 0.7452, d.f. = 14, P = 0.0004).
Phenotypic basis of host range expansion:
The fact that most of the mutations responsible for growth on the novel host glycinea were found in the candidate gene P3 suggested host attachment as a candidate mechanistic basis of host range expansion. Measures of the attachment rate constants to glycinea for the wild-type φ6 and the 16 focal mutants (genotypes H, Q, and R were again excluded) are shown in Figure 2A. The mean attachment rate constant of the wild-type φ6 was 7.35 × 10⁻¹³ (SEM = 1.24 × 10⁻¹²), a value that fell within the mutant genotype range of −1.53 × 10⁻¹²−6.77 × 10⁻¹². (Note that the lower bound is mechanically 0, but that negative values can result from error variance.)
Figure 2.—
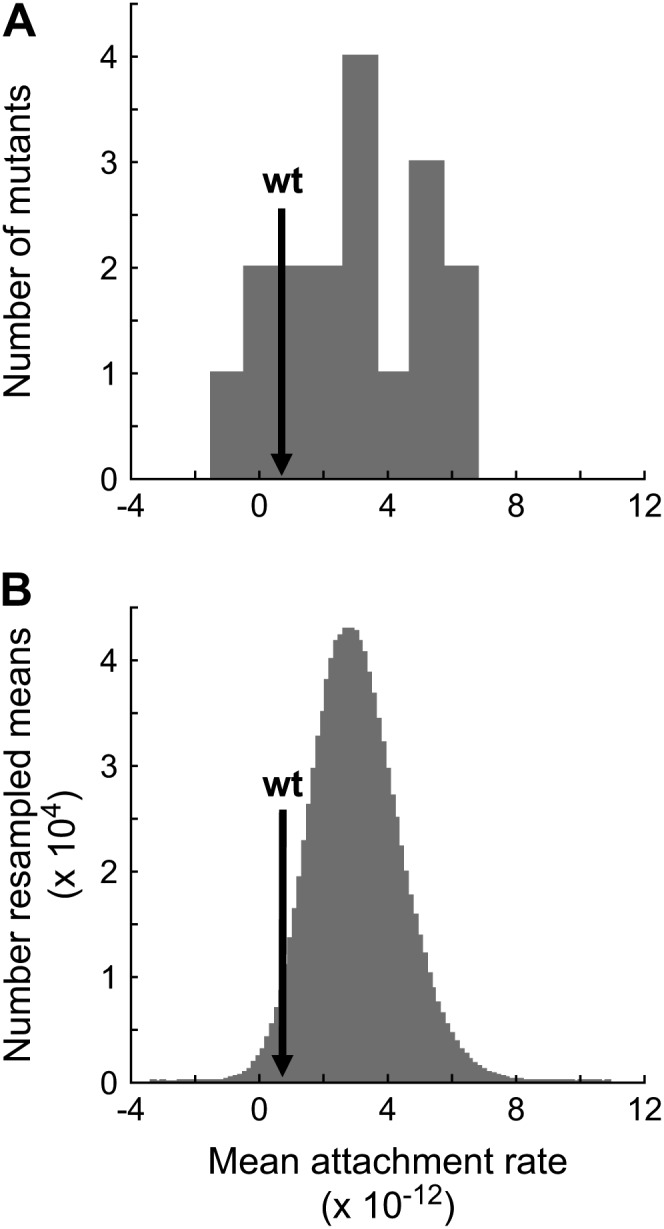
Attachment to glycinea. (A) Frequency distribution of the measured mean mutant attachment rate constant to glycinea. Mutant means are based on n = 4 replicates. The mean wild-type attachment rate constant's bin is indicated by an arrow. The wild-type mean is based on eight replicates. (B) Histogram of the distribution of mean attachment rate constants resampled from the mutant attachment data. Each resampled mean is created by a draw of n = 8 measured attachment rate constant values from the mutant attachment data. The arrow indicates the measured mean wild-type attachment rate constant. A proportion, p = 0.0342, of the resampled means lies to the left of the measured value.
If host attachment was the mechanistic basis of host range expansion, we expect the attachment rates of mutant phage to differ from that of the wild-type φ6, and we might also expect the attachment rates of mutant phage to differ from each other. However, using a one-way ANOVA to test for differences in attachment rate among these 17 phage genotypes, we failed to find a significant difference (F16,54 = 1.75, P = 0.0638). This result suggests that there are few or no differences in attachment rate among these 17 genotypes; however, the ANOVA analysis was not designed to test specifically for a difference between the mutant phage and the wild-type φ6.
Therefore, we performed a second analysis to more directly test the hypothesis that the attachment rates of mutant phage were higher than that of the wild-type φ6. In this test, we resampled the mutant data to determine how often sampling effects, alone, could produce a mean attachment rate as low as or lower than the attachment rate measured for φ6. The distribution of 106 resampled means is compared to the actual wild-type φ6 mean in Figure 2B. The proportion of resampled means that were lower than the actual mean was P = 0.034, confirming that the higher attachment rates observed in mutant phage relative to φ6 did not result by chance, but from a real increase in attachment rates in the mutant phage.
DISCUSSION
In this study we investigated the frequency and nature of mutations that expand the host range of the bacteriophage φ6. Our results corroborate the finding of a recent study in φ6 (Duffy et al. 2006), that host range expansion is usually, but not always, accompanied by a cost on the standard laboratory host, and expand on that finding in a number of ways. First, we identified 16 mutations in the host attachment gene P3 and predicted the existence of 39 additional mutations that confer the ability to infect the novel host glycinea. Second, we determined that costs of host range expansion were apparent, not only on the host to which φ6 was well adapted, but also on an alternative permissive host to which φ6 was not well adapted. And third, we identified the phenotypic basis of host range expansion, and therefore the proximate cause of the fitness costs, as an increase in attachment rate to the novel host.
These data are particularly relevant to one of the central questions in ecology—understanding the factors that limit the ability of populations to colonize new environments. The answer to this question depends on the abundance of potential colonists and the extent to which potential colonists are maladapted to novel hosts (Holt et al. 2003). Although our results may address the extent of maladaptation on novel hosts (absolute growth rate on glycinea was 104-fold lower than on phaseolicola over 24 hr, data not shown), we focus on the implications of our results for the abundance of potential colonists in natural populations. In particular, with an understanding of the mutation rate and number of mutations that expand host range, and of the abundance and magnitude of pleiotropic fitness costs, we make a population genetics prediction for the equilibrium frequency of potential colonists in natural φ6 populations.
Abundance of mutations that expand host range:
Although 1 of 40 mutants did not have a mutation in the host attachment gene P3, the presence of P3 mutations in the other 39 mutants in our collection provides strong evidence that the P3 mutations were responsible for the host range expansion. Indeed, 7 of the 18 observed P3 mutations were present in multiple mutants, ruling out any other possibility. Although 2 of these 18 mutations appeared together with another P3 mutation and could, therefore, be ruled out as the cause of host range expansion, there is strong reason to believe that the remaining 16 P3 mutations did cause the host range expansions. We sequenced a total of 101,610 nucleotides in the mutant genomes and found only 2 second-site mutations (1 each in mutants Q and R). Assuming that the φ6 mutation rate is consistent across genes, we can infer that there were only 10 second-site mutations spread among all 40 mutant genomes (2 second-site mutations/101,610 sequenced bases × 13,385 bases/genome × 40 mutants). Thus, second-site mutations appeared in a minority of genomes and do not make a likely alternative to our conclusion that the P3 mutations caused the host range expansions.
We estimated that 55 different nucleotide substitutions in P3 confer the ability to grow on the novel host glycinea. This number represents 1.3% of the possible nonsynonymous mutations in P3. To our minds this estimate is surprisingly high. Imagine that 55 different mutations enabled avian influenza to infect and transmit between humans. It seems likely that the ease with which φ6 mutates to infect glycinea is particular to this virus–host pair, and we can think of two possible reasons why so many mutations confer the ability to grow on the novel host glycinea. First, the ability to grow on glycinea may be acquired through “loss-of-character” mutations rather than “gain-of-character” mutations. Second, the close relatedness of glycinea pathovars to our standard phaseolicola host (Sarkar and Guttman 2004) might mean that only slight modifications to P3 are required for growth on glycinea.
Although acquisition of the ability to infect a novel host can be thought of as a gain of function, our data suggest that infection of the novel host may be achieved by a proximate mechanism that entails loss of a character that prevents infection rather than gain of a character that allows infection. For instance, the ability to attach to the novel host may have resulted from loss of a structure that prevented attachment rather than gain of a structure that enabled attachment. Consistent with this idea, charge loss contributed disproportionately to the observed amino acid substitutions. In addition, if the ability to grow on the novel host was acquired through loss-of-character mutations, it might explain why the effects of mutations on the standard hosts phaseolicola and japonica were correlated with each other, but uncorrelated with their effects on the novel host glycinea.
An alternative explanation for the large number of mutations that enable growth on glycinea is a close relatedness of the novel host, glycinea, and the standard host, phaseolicola. A recent phylogeny (Sarkar and Guttman 2004) of seven genomic loci of P. syringae pathovars suggests that glycinea pathovars are closely related to our standard host phaseolicola (note that the glycinea pathovar used here was not examined in Sarkar and Guttman 2004, but the two glycinea pathovars that were examined were both closely related to the phaseolicola host used here). The first step in φ6 infection is attachment of the phage to the host's type IV pilus (Roine et al. 1998), which is chromosomally encoded. Assuming that divergence in the pilus genes reflects divergence across the genome, the type IV pilus structures of glycinea and phaseolicola should be similar. In this case, only slight modifications to P3 may be required to bind to the similar type IV pilus of the novel host glycinea. If we had used a more distantly related novel host, we suspect that we would have observed fewer mutations capable of allowing growth on that host.
Abundance and nature of pleiotropic fitness costs:
Our results indicate that mutations that enable growth on a novel host are generally characterized by negative (antagonistic) pleiotropic effects for growth on standard (permissive) hosts. Although the prevalence and magnitude of negative pleiotropy differed slightly between the two permissive hosts we examined, the general form of pleiotropic effects did not differ. Negative pleiotropy predominated on both phaseolicola and japonica despite a 107-fold difference in absolute fitness of the wild-type φ6 on these two standard hosts (data not shown). The high frequency of negative pleiotropy among the mutations in ours and a previous collection of mutations that expand host range in φ6 (Duffy et al. 2006) provides consistent support for the expectation that adaptation to one host should generally be accompanied by loss of fitness on alternative hosts.
The consistency of negative pleiotropy among the mutations in our collection contrasts with the mixed results of previous studies of host range expansion in which individual mutations were approximately equally likely to exhibit positive and negative pleiotropy (Aytay and Schulze 1991; Subbarao et al. 1993; Shioda et al. 1994; Couderc et al. 1996; Llmas-Saiz et al. 1996; Kobasa et al. 1999; Hanley et al. 2003). We suspect that the high frequency of negative pleiotropy among mutations that expanded host range in φ6 resulted in part because the proximate mechanism underlying host range expansion was an increase in the rate of attachment to the novel host. Acquiring the ability to attach to a novel host (a new function) is a common mechanism of host range expansion in viruses (Baranowski et al. 2001), probably because the host surface is more divergent than components of the host cytoplasm. Further adaptation to a novel host would likely involve adapting to less divergent host cell components and be less characterized by negative pleiotropy. A similar investigation of beneficial mutations in Escherichia coli also indicated that the abundance and form of pleiotropic effects are highly dependent on the proximate mechanism of adaptation (Ostrowski et al. 2005).
It is worth considering whether the host physiology differences between the lab and natural environments had an effect on the observed frequency of negative pleiotropy in our mutant collection. Although physiology differences may have affected the magnitude of pleiotropic effects, we suspect that physiology differences probably did not affect their frequency. First, we observed that pleiotropic effects were highly correlated on the two permissive hosts despite a 107-fold difference in absolute fitness of the wild-type phage on these two hosts. Second, although it is clear that differences in host physiology would alter the absolute fitness of phage genotypes, it is not clear that physiology differences would alter the relative fitness of those genotypes. Finally, the mutations in our collection affected the attachment of phages to their hosts. Because attachment occurs outside the host cell, it should be less affected by host physiology than other aspects of the phage life cycle.
Implications for disease emergence:
In this study, we investigated the genetic determinants of a major predictor of disease emergence in models of population ecology (Sokurenko et al. 2006), the rate of transmission into the novel host. We focused on the scenario in which the ability to infect a novel host requires a mutation. In this case, transmission rate depends on the equilibrium frequency in a source population of genotypes capable of infecting the novel host (potential colonists).
By considering our data in a population genetics context, we can predict the equilibrium frequency of potential colonists in a source population growing on the standard host phaseolicola. Two forces act to determine the equilibrium frequency of potential colonists. Mutation acts to increase the frequency of potential colonists and, if the ability to infect the novel host imposes a pleiotropic fitness cost, selection acts to decrease the frequency of potential colonists. For individual mutations, the equilibrium frequency,  , at which the two forces are exactly balanced is known from population genetics (Crow and Kimura 1970) to be
  , where μ is the mutation rate and s the selection coefficient on the standard host. We consider only the mutations in our collection that exhibited pleiotropic fitness costs on the standard host phaseolicola and show the predicted equilibrium frequency of each mutation in Figure 3. We used the selection coefficients measured on the standard host phaseolicola and mutation rate estimates of μti = 1.9 × 10⁻⁶ for transitions and μtv = 1.5 × 10⁻⁷ for transversions, both of which were measured in another study (Burch
et al. 2007). It is clear from these data that the distribution of negative pleiotropic effects among mutations in our collection does not precisely predict the distribution of negative pleiotropic effects among host range mutations segregating in natural phage populations. In particular, mutations with large negative pleiotropic effects were reasonably common in our collection. However, the strength of selection acting against such mutations is expected to keep them at a relatively low frequency in natural populations.
, where μ is the mutation rate and s the selection coefficient on the standard host. We consider only the mutations in our collection that exhibited pleiotropic fitness costs on the standard host phaseolicola and show the predicted equilibrium frequency of each mutation in Figure 3. We used the selection coefficients measured on the standard host phaseolicola and mutation rate estimates of μti = 1.9 × 10⁻⁶ for transitions and μtv = 1.5 × 10⁻⁷ for transversions, both of which were measured in another study (Burch
et al. 2007). It is clear from these data that the distribution of negative pleiotropic effects among mutations in our collection does not precisely predict the distribution of negative pleiotropic effects among host range mutations segregating in natural phage populations. In particular, mutations with large negative pleiotropic effects were reasonably common in our collection. However, the strength of selection acting against such mutations is expected to keep them at a relatively low frequency in natural populations.
Figure 3.—
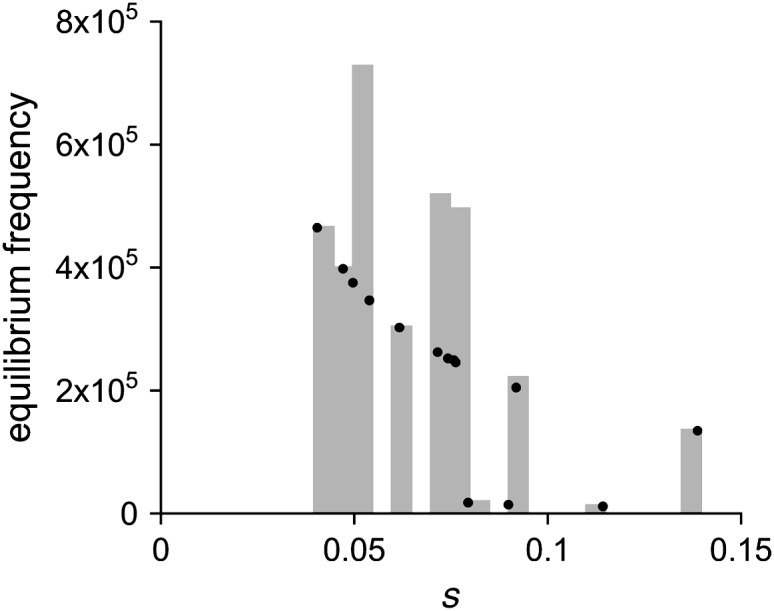
Predicted equilibrium frequencies of host range mutations before an encounter with the novel host. Equilibrium frequencies for each of the observed mutations were calculated as  , where μ is either the transition or the transversion mutation rate, and s is the observed fitness cost on the standard host phaseolicola. Solid circles indicate the equilibrium frequency of the individual observed mutations. Shaded bars depict these data as a histogram by collecting the individual mutations into bins of width 0.005.
In addition to predicting the equilibrium frequencies of individual mutations, we used our data to predict the total equilibrium frequency of host range mutations in a source population growing on the standard host phaseolicola,  , by summing the equilibrium frequencies over all the mutations in Figure 3. In this manner, we estimated an equilibrium frequency of mutations that enable infection of the novel host to be
  . Note that this equilibrium frequency is slightly underestimated because it does not include the (∼39) mutations missed by our screen, but it is slightly underestimated only because most of the missed mutations were transversions. Note that the estimate of
  is well above the phage mutation rate [μ ≈ 2 × 10⁻⁶ (Chao
et al. 2002)] because several of the mutations in our collection exhibit very small costs. Thirty-eight percent of the host range mutations present in equilibrium populations are expected to exhibit fitness costs on the standard host phaseolicola of <5% (i.e., s < 0.05).
is well above the phage mutation rate [μ ≈ 2 × 10⁻⁶ (Chao
et al. 2002)] because several of the mutations in our collection exhibit very small costs. Thirty-eight percent of the host range mutations present in equilibrium populations are expected to exhibit fitness costs on the standard host phaseolicola of <5% (i.e., s < 0.05).
The substantial variation in pleiotropic fitness costs observed here among mutations that expand host range may explain the observation in viruses and other host specialists that performance tradeoffs among hosts are more common in laboratory populations (e.g., Novella et al. 1995; e.g., Turner and Elena 2000) than in natural populations (Fry 1996). Adaptation in laboratory populations of microbes generally occurs via selection acting on novel mutations, whereas adaptation in natural populations should more often occur via selection acting on standing genetic variation (i.e., mutations present in populations that are at an equilibrium between mutation and selection). If there is variation in pleiotropic fitness costs, then novel mutations will be characterized by larger pleiotropic costs on average than the standing genetic variation, and laboratory populations would be expected to exhibit larger fitness tradeoffs among hosts than natural populations. In other words, if pleiotropic fitness costs are not universal among the mutations that expand host range, we should not expect to observe large fitness tradeoffs in nature. Adaptation to a novel host need not impose fitness costs on the standard host, at least in the short term.
Finally, our data lend support to one of two nonmutually exclusive hypotheses for why RNA viruses are the major contributor to emerging disease. Our data support the hypothesis that the high mutation rate characteristic of RNA viruses ensures the existence of a high frequency of mutations that allow colonization of a novel host before the initial transmission to that host (Morse 1995; Domingo et al. 1998; Moya et al. 2004). Although our data cannot address the alternative hypothesis that the high mutation rate of RNA viruses allows adaptation to a novel host after the initial transmission (Antia et al. 2003), we note that the first hypothesis is consistent with the accepted explanation for the rapid evolution of drug resistance in RNA viruses such as HIV. Drug resistance evolves rapidly because mutations that confer resistance are circulating in the viral population before the drug is administered (Zhang et al. 1991; Mohri et al. 1993).
Acknowledgments
We thank Corbin Jones, Siobain Duffy, and members of the Burch lab for discussions that improved both the experimental design and the final manuscript. This work was supported by grants from the National Institutes of Health (to P.J. and C.B.).
References
- Antia, R., R. R. Regoes, J. C. Koella and C. T. Bergstrom, 2003. The role of evolution in the emergence of infectious diseases. Nature 426 658–661. [DOI] [PMC free article] [PubMed] [Google Scholar]
- Aytay, S., and I. T. Schulze, 1991. Single amino-acid substitutions in the hemagglutinin can alter the host range and receptor-binding properties of H1-strains of influenza-a virus. J. Virol. 65 3022–3028. [DOI] [PMC free article] [PubMed] [Google Scholar]
- Baranowski, E., C. M. Ruiz-Jarabo and E. Domingo, 2001. Evolution of cell recognition by viruses. Science 292 1102–1105. [DOI] [PubMed] [Google Scholar]
- Burch, C. L., and L. Chao, 2004. Epistasis and its relationship to canalization in the RNA virus phi 6. Genetics 167 559–567. [DOI] [PMC free article] [PubMed] [Google Scholar]
- Burch, C. L., S. Guyader, D. Samarov and H. Shen, 2007. Experimental estimate of the abundance and effects of nearly neutral mutations in the RNA virus φ6. Genetics 176 467–476. [DOI] [PMC free article] [PubMed] [Google Scholar]
- Chao, L., 1990. Fitness of RNA virus decreased by Muller's ratchet. Nature 348 454–455. [DOI] [PubMed] [Google Scholar]
- Chao, L., and T. T. Tran, 1997. The advantage of sex in the RNA virus phi6. Genetics 147 953–959. [DOI] [PMC free article] [PubMed] [Google Scholar]
- Chao, L., C. U. Rang and L. E. Wong, 2002. Distribution of spontaneous mutants and inferences about the replication mode of the RNA bacteriophage phi 6. J. Virol. 76 3276–3281. [DOI] [PMC free article] [PubMed] [Google Scholar]
- Couderc, T., F. Delpeyroux, H. LeBlay and B. Blondel, 1996. Mouse adaptation determinants of poliovirus type 1 enhance viral uncoating. J. Virol. 70 305–312. [DOI] [PMC free article] [PubMed] [Google Scholar]
- Crow, J., and M. Kimura, 1970. An Introduction to Population Genetics Theory. Harper & Row, New York.
- Doi, K., A. Kawana, A. Iwamoto, H. Yoshikura and T. Odawara, 1997. One base change is sufficient for host range conversion of murine leukemia virus from B to NB tropism. Arch. Virol. 142 1889–1894. [DOI] [PubMed] [Google Scholar]
- Domingo, E., E. Baranowski, C. M. Ruiz-Jarabo, A. M. Martin-Hernandez, J. C. Saiz et al., 1998. Quasispecies structure and persistence of RNA viruses. Emerg. Infect. Dis. 4 521–527. [DOI] [PMC free article] [PubMed] [Google Scholar]
- Duffy, S., P. E. Turner and C. L. Burch, 2006. Pleiotropic costs of niche expansion in the RNA bacteriophage Φ6. Genetics 172 751–757. [DOI] [PMC free article] [PubMed] [Google Scholar]
- Fry, J. D., 1996. The evolution of host specialization: Are trade-offs overrated? Am. Nat. 148 S84–S107. [Google Scholar]
- Gomulkiewicz, R., R. D. Holt and M. Barfield, 1999. The effects of density dependence and immigration on local adaptation and niche evolution in a black-hole sink environment. Theor. Popul. Biol. 55 283–296. [DOI] [PubMed] [Google Scholar]
- Gottlieb, P., S. Metzger, M. Romantschuk, J. Carton, J. Strassman et al., 1988. Nucleotide sequence of the middle dsRNA segment of bacteriophage phi 6: placement of the genes of membrane-associated proteins. Virology 163 183–190. [DOI] [PubMed] [Google Scholar]
- Grez, M., M. Zornig, J. Nowock and M. Ziegler, 1991. A single point mutation activates the Moloney murine leukemia-virus long terminal repeat in embryonal stem-cells. J. Virol. 65 4691–4698. [DOI] [PMC free article] [PubMed] [Google Scholar]
- Hanley, K. A., L. R. Manlucu, L. E. Gilmore, J. E. Blaney, C. T. Hanson et al., 2003. A trade-off in replication in mosquito versus mammalian systems conferred by a point mutation in the NS4B protein of dengue virus type 4. Virology 312 222–232. [DOI] [PubMed] [Google Scholar]
- Heck, K. L., G. Vanbelle and D. Simberloff, 1975. Explicit calculation of rarefaction diversity measurement and determination of sufficient sample size. Ecology 56 1459–1461. [Google Scholar]
- Holt, R. D., and R. Gomulkiewicz, 1997. How does immigration influence local adaptation? A reexamination of a familiar paradigm. Am. Nat. 149 563–572. [Google Scholar]
- Holt, R. D., R. Gomulkiewicz and M. Barfield, 2003. The phenomology of niche evolution via quantitive traits in a “black-hole” sink. Proc. R. Soc. Lond. Ser. B Biol. Sci. 270 215–224. [DOI] [PMC free article] [PubMed] [Google Scholar]
- Holt, R. D., M. Barfield and R. Gomulkiewicz, 2004. Temporal variation can facilitate niche evolution in harsh sink environments. Am. Nat. 164 187–200. [DOI] [PubMed] [Google Scholar]
- Jonah, G., A. Rainey, A. Natonson, L. F. Maxfield and J. M. Coffin, 2003. Mechanisms of avian retroviral host range extension. J. Virol. 77 6709–6719. [DOI] [PMC free article] [PubMed] [Google Scholar]
- Kobasa, D., S. Kodihalli, M. Luo, M. R. Castrucci, I. Donatelli et al., 1999. Amino acid residues contributing to the substrate specificity of the influenza A virus neuraminidase. J. Virol. 73 6743–6751. [DOI] [PMC free article] [PubMed] [Google Scholar]
- Kozak, C. A., and A. Chakraborti, 1996. Single amino acid changes in the murine leukemia virus capsid protein gene define the target of Fv1 resistance. Virology 225 300–305. [DOI] [PubMed] [Google Scholar]
- Llamas-Saiz, A. L., M. Agbandje-McKenna, J. S. L. Parker, A. T. M. Wahid, C. R. Parrish et al., 1996. Structural analysis of a mutation in canine parvovirus which controls antigenicity and host range. Virology 225 65–71. [DOI] [PubMed] [Google Scholar]
- Miller, C. R., P. Joyce and L. P. Waits, 2005. A new method for estimating the size of small populations from genetic mark-recapture data. Mol. Ecol. 14 1991–2005. [DOI] [PubMed] [Google Scholar]
- Mindich, L., J. Cohen and M. Weisburd, 1976. Isolation of nonsense suppressor mutants in Pseudomonas. J. Bacteriol. 126 177–182. [DOI] [PMC free article] [PubMed] [Google Scholar]
- Mohri, H., M. K. Singh, W. T. Ching and D. D. Ho, 1993. Quantitation of zidovudine-resistant human immunodeficiency virus type 1 in the blood of treated and untreated patients. Proc. Natl. Acad. Sci. USA 90 25–29. [DOI] [PMC free article] [PubMed] [Google Scholar]
- Morris, J. F., E. J. Sternberg, L. Gutshall, S. R. Petteway and L. A. Ivanoff, 1994. Effect of a single amino-acid substitution in the V3 domain of the human-immunodeficiency-virus type-1—generation of revertant viruses to overcome defects in infectivity in specific cell-types. J. Virol. 68 8380–8385. [DOI] [PMC free article] [PubMed] [Google Scholar]
- Morse, S. S., 1995. Factors in the emergence of infectious-diseases. Emerg. Infect. Dis. 1 7–15. [DOI] [PMC free article] [PubMed] [Google Scholar]
- Moya, A., E. C. Holmes and F. Gonzalez-Candelas, 2004. The population genetics and evolutionary epidemiology of RNA viruses. Nat. Rev. Microbiol. 2 279–288. [DOI] [PMC free article] [PubMed] [Google Scholar]
- Novella, I. S., D. K. Clarke, J. Quer, E. A. Duarte, C. H. Lee et al., 1995. Extreme fitness fifferences in mammalian and insect hosts after continuous replication of vesicular stomatitis-virus in sandfly cells. J. Virol. 69 6805–6809. [DOI] [PMC free article] [PubMed] [Google Scholar]
- Ostrowski, E. A., D. E. Rozen and R. E. Lenski, 2005. Pleiotropic effects of beneficial mutations in Escherichia coli. Evolution 59 2343–2352. [PubMed] [Google Scholar]
- Roine, E., D. M. Raineri, M. Romantschuk, M. Wilson and D. N. Nunn, 1998. Characterization of type IV pilus genes in Pseudomonas syringae pv. tomato DC3000. Mol. Plant Microbe Interact. 11 1048–1056. [DOI] [PubMed] [Google Scholar]
- Ross, S., 2002. A First Course in Probability. Prentice-Hall, Upper Saddle River, NJ.
- Sarkar, S. F., and D. S. Guttman, 2004. Evolution of the core genome of Pseudomonas syringae, a highly clonal, endemic plant pathogen. Appl. Environ. Microbiol. 70 1999–2012. [DOI] [PMC free article] [PubMed] [Google Scholar]
- Shioda, T., S. Oka, S. Ida, K. Nokihara, H. Toriyoshi et al., 1994. A naturally-occurring single basic-amino-acid substitution in the V3 region of the human-immunodeficiency-virus type-1 Env protein alters the cellular host-range and antigenic structure of the virus. J. Virol. 68 7689–7696. [DOI] [PMC free article] [PubMed] [Google Scholar]
- Sokal, R., and F. Rohlf, 1969. Biometry. W. H. Freeman, New York.
- Sokurenko, E. V., R. Gomulkiewicz and D. E. Dykhuizen, 2006. Source-sink dynamics of virulence evolution. Nat. Rev. Microbiol. 4 548–555. [DOI] [PubMed] [Google Scholar]
- Stent, G. S., 1963. Molecular Biology of Bacterial Viruses. W. H. Freeman, San Francisco.
- Subbarao, E. K., W. London and B. R. Murphy, 1993. A single amino-acid in the Pb2-gene of influenza-a virus is a determinant of host range. J. Virol. 67 1761–1764. [DOI] [PMC free article] [PubMed] [Google Scholar]
- Turner, P. E., and S. F. Elena, 2000. Cost of host radiation in an RNA virus. Genetics 156 1465–1470. [DOI] [PMC free article] [PubMed] [Google Scholar]
- Vidaver, A. K., R. K. Koski and J. L. Van Etten, 1973. Bacteriophage phi6: a lipid-containing virus of Pseudomonas phaseolicola. J. Virol. 11 799–805. [DOI] [PMC free article] [PubMed] [Google Scholar]
- Zhang, L. Q., P. Simmonds, C. A. Ludlam and A. J. Brown, 1991. Detection, quantification and sequencing of HIV-1 from the plasma of seropositive individuals and from factor VIII concentrates. AIDS 5 675–681. [DOI] [PubMed] [Google Scholar]