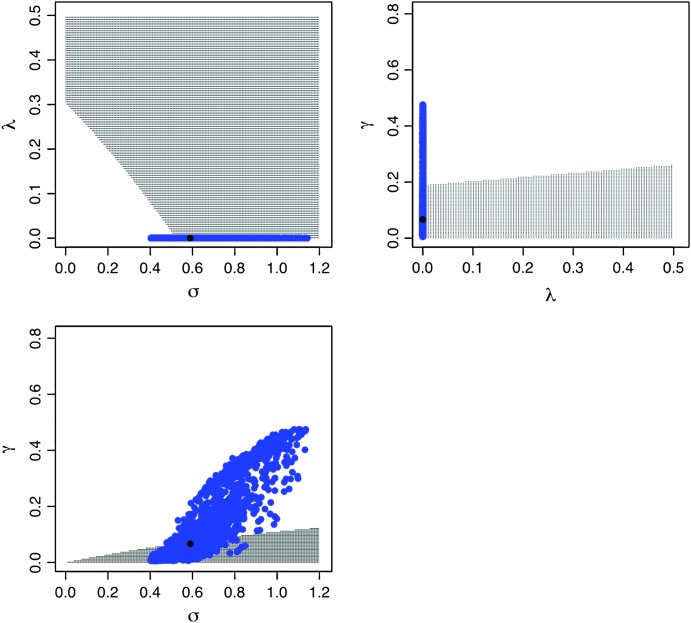
Figure 3.—
Stability boundaries for the horizontal transfer (HT) model, location of the estimated model parameters for the P21 strain and their joint approximate 95% confidence region. In each subplot, the HT model stability boundaries are plotted as a function of each parameter combination. The shaded area corresponds to the set of parameter values for which the plasmid-carrying cells eventually disappear (i.e., where the point x = 1 is stable) and the unshaded area denotes the parameter space for which the point x = 1 ceases to be a stable equilibrium and a new stable equilibrium x ∈ (0, 1) appears. In the unshaded area, a long-run coexistence between plasmid-free cells and plasmid-carrying cells is predicted. In each case, the solid dot locates the maximum-likelihood estimated parameter values and the cloud of blue points around them is their approximate joint 95% confidence cloud.

