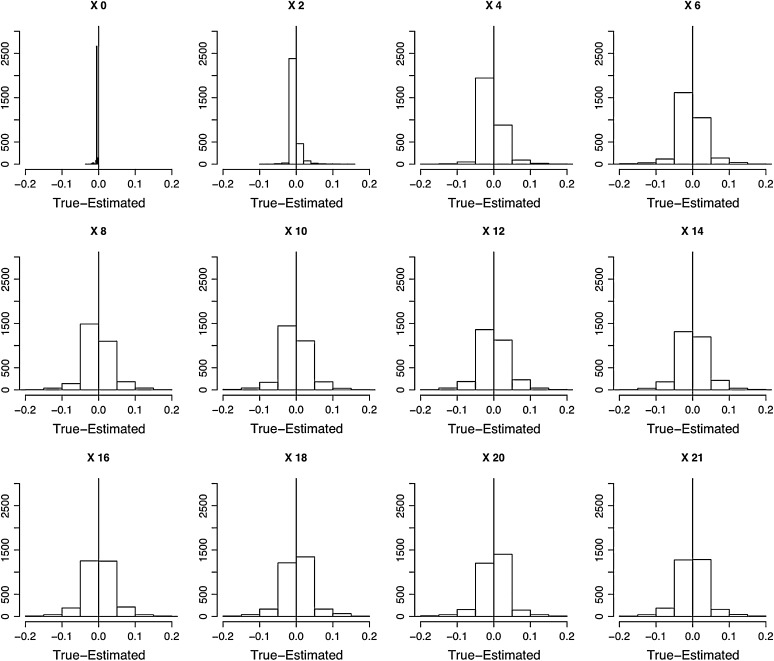
Figure 6.—
Evaluation of the performance of the HMM parameter estimation methods. One thousand data sets containing three replicated time series of plasmid loss each where simulated using the VS model plus binomial sampling error. For each data set, the posterior modes of the underlying (unseen) trajectory were estimated and their difference against the true simulated trajectory was computed. The 1000 sets of differences between the posterior mode of the X process trajectories and the true simulated value of the X process are shown as histograms, from day 0 to day 21.

