

Abstract
Human cyclophilin A, or CypA, encoded by the gene peptidyl prolyl isomerase A (PPIA), is incorporated into the HIV type 1 (HIV-1) virion and promotes HIV-1 infectivity by facilitating virus uncoating. We examined the effect of single nucleotide polymorphisms (SNPs) and haplotypes within the PPIA gene on HIV-1 infection and disease progression in five HIV-1 longitudinal history cohorts. Kaplan-Meier survival statistics and Cox proportional hazards model were used to assess time to AIDS outcomes. Among eight SNPs tested, two promoter SNPs (SNP3 and SNP4) in perfect linkage disequilibrium were associated with more rapid CD4+ T-cell loss (relative hazard = 3.7, p = 0.003) in African Americans. Among European Americans, these alleles were also associated with a significant trend to more rapid progression to AIDS in a multi-point categorical analysis (p = 0.005). Both SNPs showed differential nuclear protein-binding efficiencies in a gel shift assay. In addition, one SNP (SNP5) located in the 5′ UTR previously shown to be associated with higher ex vivo HIV-1 replication was found to be more frequent in HIV-1-positive individuals than in those highly exposed uninfected individuals. These results implicate regulatory PPIA polymorphisms as a component of genetic susceptibility to HIV-1 infection or disease progression, affirming the important role of PPIA in HIV-1 pathogenesis.
Author Summary
Individual risk of acquiring HIV type 1 (HIV-1) infection and developing AIDS is not equal; some people are more prone to HIV/AIDS than others. Susceptibility to HIV-1/AIDS is likely determined by a combination of environmental, viral, and host genetic factors. Genetic variations in host cellular factors involved in HIV-1 cell entry, replication, and host defense have been found to affect susceptibility to HIV-1/AIDS. In this report, we focused on the gene PPIA that encodes cyclophilin A, a human cellular protein that is incorporated into the HIV-1 virion and promotes viral replication. We studied genetic variation in the PPIA gene in persons with different susceptibility levels to HIV-1 infection or different rates of disease progression. We found that individuals who processed two functional variants in the promoter region of PPIA had higher risk of CD4+ T-cell loss or progression to AIDS-defining diseases. We also observed that an additional variant occurred more frequently in HIV-1-infected individuals compared to HIV-1-exposed, but uninfected, individuals. These results suggest that genetic variation in PPIA may influence host susceptibility to HIV-1 infection or disease progression and targeting PPIA might provide therapeutic benefit.
Introduction
As an obligate intracellular parasite, HIV type 1 (HIV-1) utilizes host cell factors for its replication. Human cyclophilin A (CypA), also known as peptidyl prolyl isomerase A (PPIA), is a ubiquitous cytoplasmic protein (by convention, we refer to the protein as CypA and the gene as PPIA). CypA has long been known for its incorporation into HIV-1 virions and its important role in facilitating HIV-1 replication in host cells [1,2]. CypA is a member of the cyclophilin family, members of which all possess peptidyl-prolyl cis/trans isomerase activity. Peptidyl prolyl cis/trans isomerases (PPIAses) catalyze the cis/trans isomerization of prolyl peptide bonds and are believed to be involved in protein folding [3]. The incorporation of CypA into the HIV-1 virion capsid is mediated through the direct binding between prolyl peptide bond located in a proline-rich loop of the fourth and fifth helices of the HIV-1 capsid and the active sites of CypA [4,5]. Disruption of CypA incorporation, either by HIV-1 Gag mutations or by cyclosporine A, an immunosuppressive drug that prevents HIV-1 Gag binding to CypA, leads to an attenuation of HIV-1 infectivity [2,6]. Braaten and Luban found that HIV-1 replication was decreased in CypA-null human CD4+ T cells, in which the gene encoding CypA (PPIA) was deleted through homologous recombination [7]. CypA is therefore an important host factor that regulates HIV-1 replication.
Recently, the role of CypA in HIV-1 has gained even greater attention with the discovery of a fusion protein of CypA and TRIM5α, a host restriction factor against HIV-1 [8], which confers HIV-1 resistance in owl monkey [9–11]. Both TRIM5α and CypA recognize and act on the capsid of HIV-1, but apparently confer opposite effects. TRIM5α restricts HIV-1 by promoting premature disassembly of HIV-1 capsid [12], while CypA increases viral infectivity by facilitating proper uncoating. Although the interaction between CypA and TRIM5α is still unclear, it appears that the modulation of HIV-1 infectivity by CypA is independent of TRIM5α [11,13–15]. It has been postulated that binding of CypA to capsid protects HIV-1 from an unknown restriction factor in humans [15].
The study of the influence of human gene variation on susceptibility to HIV-1 infection and progression is an approach that may reveal the in vivo host factor HIV-1 interactions and their epidemiologic importance at the population level. With this approach we have identified several AIDS-modifying variants in genes TRIM5 [16], APOBEC3G [17], and CUL5 [18] that encode human innate HIV-1 restriction factors or related proteins. In a recent study performed in the Swiss HIV Cohort Study, a variant of PPIA was implicated as a potential factor affecting HIV-1 disease progression [19]. As CypA is an essential human protein for completion of the HIV-1 life cycle, we have assessed the influence of genetic variation in the PPIA gene on HIV-1 infection and disease progression in five United States–based HIV-1 natural history cohorts.
Results
Description of PPIA Variations
The PPIA gene is approximately 7 kb in length, consisting of five exons (Figure 1A). Using PPIA-specific primers we resequenced virtually the entire PPIA gene to screen for single nucleotide polymorphisms (SNPs) in 92 European Americans (EA) and 92 African Americans (AA). Seven polymorphisms were discovered: three in the putative promoter region, one in the 5′ UTR, one in the 3′ UTR, one in intron 4, and one in the second Alu repeat region upstream of the putative promoter. No SNPs were found in the coding regions. These SNPs and four additional SNPs available from dbSNP database located in regions not detected by our sequencing were selected for genotyping in the AIDS cohorts (Figure 1 and Table 1). SNP1 genotypes deviated from the frequencies expected under the Hardy-Weinberg equilibrium (p < 0.001), probably due to its location in the Alu repetitive element; thus, SNP1 was excluded in the analysis. SNP2 was also excluded from analysis due to its rarity. The genotypic frequencies of all other SNPs conform to Hardy-Weinberg expectations.
Figure 1. Gene Map, SNPs, and Haplotypes in the Human PPIA on Chromosome 7p13.

Coding exons are marked by green blocks, and 5′ and 3′ UTRs by light green blocks. Hatched black boxes represent Alu repeats. Haplotype structure and frequencies are shown in the middle panel. The corresponding nucleotides in the chimpanzee and allele frequencies of the SNPs are presented in the bottom panel. MAF, minor allele frequency of SNPs (based on EA frequency).
Table 1.
Characterization of PPIA SNPs

Allele frequency distributions of PPIA SNPs differed in EA and AA with Fst values ranging from 0.03 to 0.40 (average 0.22). The difference is particularly pronounced for SNPs 7, 8, 9, 10, and 11 (Fst, 0.30–0.40), where the minor alleles are reversed in the two populations (Figure 1).
Linkage Disequilibrium and Haplotypes of PPIA SNPs
The extent of linkage disequilibrium (LD) among eight SNPs was assessed by calculating all pairwise D′ values, separately for AA and EA (Figure 2A and 2B). Strong LD was observed among almost all SNPs in AA (D′ range 0.87–1.0) and even stronger LD in EA (D′ range 0.97–1.0). SNP3 and SNP4 were in perfect LD in both populations (D′ = 1, r 2 = 1). As each of these two SNPs carries the same information content, SNP4 was selected as a proxy for SNP3 in the analysis. The eight SNPs in both population groups formed a single LD block as defined by the solid spine of LD method [20]. This provided a justification to use all eight SNPs spanning the entire region as one block for subsequent haplotype-based association analyses.
Figure 2. LD Structure of PPIA SNPs in AA and EA.

LD Structure of PPIA SNPs in AA (A) and EA (B). Pairwise D′ plots and haplotype blocks obtained from HAPLOVIEW. Pairwise D′ values (%) were indicated in triangle squares except for those of D′ of 1.0. High D′ values were shown in bright red (LOD >= 2) or light blue squares (LOD < 2), and low D′ values were shown in light red (LOD >= 2) and white squares (LOD < 2). Single haplotype block was defined by the solid spine algorithm.
Among AA, SNP6 presented intermediate level of LD (D′ ~0.60) with the SNPs downstream (SNP8–11); SNP6–SNP8 recombinant G-C haplotype had a frequency of 5%. Among EA, SNP5 had weak LD with SNP6–11 (D′ 0.47–0.71); the recombinant haplotype SNP5–SNP6 (G-G) had a frequency of 2.5%. This suggests an occurrence of recombination in the region between SNP5 and SNP8. The presence of multiple Alu elements in PPIA may have introduced the recombination event by promoting genomic instability [21].
Haplotype structure and maximum likelihood haplotype frequencies were estimated with the EM algorithm. There were, in total, eight haplotypes with minor allele frequency >1% in either population (Figure 1B). Five or six haplotypes were present in EA or AA, respectively, accounting for >97% of total sampled chromosomes. Among these, only three common haplotypes (minor allele frequency >5%) were shared between AA and EA (hap1, 2, and 4). Diverse distributions of haplotype frequencies between AA and EA were seen as for SNPs.
Effect of PPIA SNPs and Haplotypes on Susceptibility to HIV-1 Infection
We compared the PPIA SNP allele and haplotype frequency distributions among three groups with increasing resistance to HIV-1 infection: seroconverters (SCs), seronegatives (SNs) belonging to an HIV-1 risk group, and those with documented high-risk exposures to HIV-1 who remain uninfected (HREU) (Table 2). The minor allele of SNP5 (G) was carried in 13.7% of SCs, 13.5% of SNs, and 9.5% of HREU, respectively (Mantel-Haenszel trend test, p = 0.21). The reduced carriage of SNP5G in HREU was significant when SCs were compared to HREU (odds ratio = 1.78, p = 0.02), suggesting that the SNP5G allele carriers may have increased susceptibility to HIV-1 infection (Table 2). No distortion of frequency distribution between risk groups were observed for all other SNPs in AA or EA (unpublished data).
Table 2.
Effects of PPIA SNP4 and SNP5 on HIV-1 Infection Risk in EA

PPIA SNPs and AIDS Progression
We analyzed AA and EA separately since the SNP frequencies differed between the two groups. The Cox proportional hazards model was employed to test the potential differential impact of SNPs on the rates of progression to CD4 <200 or to AIDS clinical diseases (Table 3). To minimize the number of SNPs to be tested, we only tested the unique SNPs represented in each population, i.e., only one SNP was tested for those in perfect LD (r 2 = 1). Six and four SNPs were analyzed in AA and EA, respectively. Two SNPs in AA (SNPs 4 and 5) and three SNPs in EA (SNPs 4, 5, and 7) showed significant or near-significant effects (Table 3).
Table 3.
Effects of PPIA SNPs on AIDS Progression in AA and EA

Effect of SNP4 on AIDS Progression
Among AA SCs, the minor allele of SNP4 (the G allele) was associated with accelerated loss of CD4+ T cells (relative hazard [RH] = 3.7, 95% confidence interval [CI] = 1.59–8.63) in a Cox proportional hazards model (Table 3). After stratifying by cohort in the Cox regression analysis, this association became slightly stronger (RH = 4.08, 95% CI = 1.71–9.70). Kaplan-Meier survival analysis presented a clear separation of curves stratified for the SNP4 C/C and C/G genotypes (G/G absent) on progression to CD4 <200 in AA (p = 0.002, log-rank test, Figure 3). Notably, all SNP4 carriers progressed to CD4 <200 within 6 y. The effect on AIDS-1987 was in the same direction but short of significance (Table 3). Identical results were seen for SNP3 (unpublished data). Among EA SCs, a trend of accelerated progression to AIDS-1987 was also observed, though short of significance (RH = 1.34, p = 0.07, Table 3).
Figure 3. Kaplan-Meier Survival Curve Analysis of SNP4 on Progression to CD4+ Cells <200/mm3 in AA.

To affirm the observed genetic influence of SNP4, we performed a categorical analysis of HIV-1-infected people that included seroprevalents (SPs) in the long-term survivors (Figure 4). SPs who had remained AIDS-free for greater than 7.5 y for AA or 10 y for EA after study enrollment (the median time to AIDS for each) were included in this analysis. The frequency distributions of SNP4 in six discrete time intervals progressing to disease outcome after HIV-1 infection were tested for statistical trend using a Mantel-Haenszel test. As shown in Figure 4, the SNP4 G allele occurred more frequently among fast progressors in both AA and EA. With an increased sample size of 389 patients in AA, a significant trend toward rapid CD4 loss is still preserved (p = 0.04, Figure 4A). Among 970 EA patients, the trend toward rapid progression to AIDS was more pronounced (p = 0.004) (Figure 4B). Thus, the results from SC plus SP groups corroborate the findings from the SC-alone survival analyses, indicating that the accelerating effect of SNP4 is consistent in both AA and EA populations.
Figure 4. Disease Categorical Analysis Using both SCs and SPs for the Effect of SNP4 on Progression to CD4 <200 in AA and to AIDS-87 in EA.

Only SPs with greater than 7.5 y (for AA [A]) or 10 y (for EA [B]) of survival time, the median survival time of the SCs, were included in the analysis. The frequencies of the SNP4 C/G genotype in five intervals after seroconversion are plotted and tested for statistical trends using Mantel-Haenszel χ2 test. Numbers of patients are listed above the bar.
PPIA SNP5 and AIDS Progression
In a Swiss Caucasian HIV-1 cohort, SNP5G, referred to as 1650A/G [19], was reported to be associated with a rapid CD4 cell depletion and with a trend toward higher in vitro HIV-1 replication [19]. In our analysis of EA SCs, SNP5G showed a nonsignificant trend toward rapid progression to AIDS-1987 (RH = 1.26, p = 0.08), but had no effect on CD4 cell depletion, while an opposite trend was observed in AA (Table 3). In a categorical analysis of combined samples from SCs and SPs, SNP5G also had no impact on both outcomes in both EA and AA (p > 0.23, unpublished data). Therefore, this study offers no convincing evidence for SNP5 association with disease progression in either EA or AA.
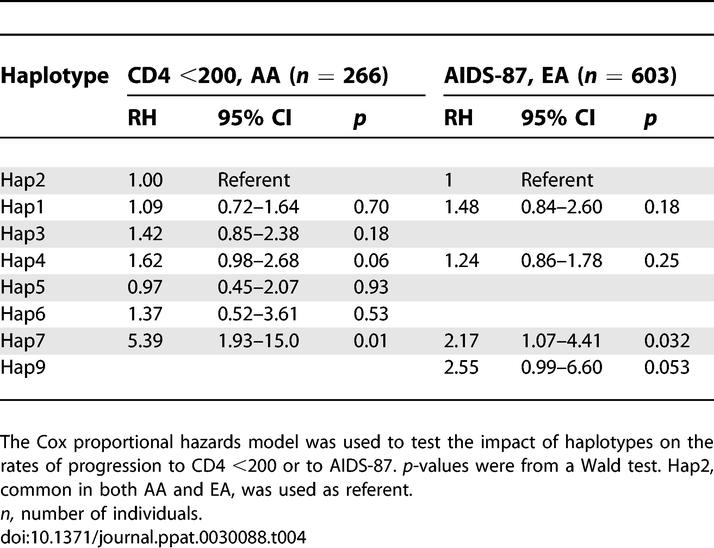
Effects of PPIA Haplotypes on AIDS Progression
In the haplotype analysis, we first used the Cox regression model to test the global null hypothesis of no association between haplotype frequency and AIDS progression, by comparing a model with all haplotypes to the covariants-only model. This revealed that the global distributions of haplotype frequencies were significantly or near-significantly different for the outcome of CD4 <200 in AA (p = 0.01) and AIDS-87 in EA (p = 0.08). The distortion of frequency distribution was mainly attributable to one haplotype (Hap7) (Table 4). Hap7, the only haplotype carrying SNP4G (Figure 1), was associated with accelerated progression to AIDS in both AA and EA (Table 4), consistent with the results from SNP analysis.
Table 4.
Effects of PPIA Haplotypes on AIDS Progression
Interactions between TRIM5 and PPIA Variants
Because TRIM5α interferes with and CypA facilitates post-entry uncoating of the HIV-1 capsid, it is possible that there may be genetic interactions between two genes. Potential interactions were tested only between variants in two genes with functional plausibility or high strength of association. Specifically, PPIA SNP4 was tested for its interaction with TRIM5-rs16934386 and TRIM5-R136Q, which was previously reported using the same patient population to be associated with HIV-1 infection but not progression [22]. In the Cox regression model analysis, we observed no obvious interaction for infection or progression (p > 0.15, unpublished data). This suggests that CypA and TRIM5α likely act independently, consistent with recent in vitro observations [11,13–15,23].
Electrophoretic Mobility-Shift Assay
As SNP3, 4, and 5 reside in the regulatory region of PPIA, we performed gel shift assays to assess whether these SNPs differentially bind to transcriptional factors (Figure 5). In this experiment, ~25-bp DNA probes containing either of the SNP alleles were incubated with the nuclear extracts from Th1 cytokine-stimulated human T lymphocytes. Both SNPs showed differential binding affinity to nuclear protein(s) with the same mobility (Figure 5A, top band). Averaged from two independent experiments, a 4-fold decrease or 2.8-fold increase in the band density was observed for the minor allele of SNP3 (G) and SNP4 (G), respectively. The cold unlabeled oligonucleotides with minor alleles were unable to compete with wild-type oligonucleotides, suggesting the bindings are specific. These results indicate that these two SNPs within the promoter alter the binding affinity with certain transcriptional protein(s). On the contrary, no obvious differential binding was observed for SNP5 (Figure 5A).
Figure 5. Binding Affinity of Nuclear Factors to the SNP-Containing Fragments in the 5′ Regulatory Regions of PPIA and the Sequence Context of the Region.

(A) Gel shift analysis of SNP3, SNP4, and SNP5 in the 5′ regulatory region of PPIA. Nuclear extracts from human T lymphocytes induced by IL4 were bound to the DNA fragment containing the C or G allele of SNP3, the C or G allele of SNP4, and the A or G allele of SNP5, respectively. The arrowhead indicates the band showing differential binding of nuclear factor(s) to the oligonucleotides. The bands below the arrow may represent nonspecific complexes and the bands at the bottom are free probes.
(B) Sequence context of SNP3 and SNP4 and comparison to the consensus-binding motifs of transcription factor SP1. SNPs 3 and 4 (located at positions 1575 and 1604 in the sequence X52851, and −85 and −59, to the ATG start codon, respectively) are in perfect LD. SNP3C>G change predicts a loss of binding to a SP1 factor, while SNP4C>G change predicts a stronger binding to a SP1 factor.
(C) The interspecies alignments of a segment of the PPIA promoter containing SNP3 and SNP4. Conserved regions are underlined and SNP sites are colored.
In silico analysis of the sequence at these three SNP sites by using TESS software also predicted differential binding for SNP3 and 4, but not for SNP5. SNP3 and 4 were each located in one of the consensus-binding motifs of transcription factor SP1, as shown in Figure 5B. The local sequence with SNP3C is identical to the consensus sequence of SP1 site, GGGGCC, whereas SNP3C>G change perturbs this motif. In contrast, the sequence with SNP4C has two mismatch sites compared to an alternative consensus sequence of SP1 site, GAGGCGGGGC, whereas SNP4C>G reduced the mismatch to one, predicting a stronger binding. There is, therefore, a plausible biochemical basis for the differential binding affinity observed in the gel shift experiment. These results also suggest that SNP3 and SNP4 affect transcription, likely through their interactions with SP1. The sequence of the region of human PPIA promoter resided in by SNP3 and SNP4 was compared to the corresponding sequence from other species (Figure 5C). SNP3 and SNP4 are both located in the highly conserved regions. The C allele of SNP3 is present in both primates and rodents. The C allele of SNP4 occurs only in primates and the minor allele G occurs in rodents, suggesting a possible association with speciation. These interspecies data support the hypothesis that SNP3 and SNP4 changes may have functional consequences.
Discussion
The role of CypA in promoting HIV-1 replication has been well established through extensive in vitro experiments [1,2,6,7]. In this study, we have undertaken a systematic investigation of the association between genetic variations in the PPIA gene and susceptibility to HIV-1 infection and disease progression in HIV-1 natural history cohorts. We found that two promoter variants in perfect LD, SNP3 and SNP4, in PPIA, were associated with rapid HIV-1 disease progression. This effect was revealed for CD4 cell depletion or for AIDS progression, reflecting early or late stage of disease progression, in AA and EA, respectively. The racial difference in the strength or timing of the effects may be due to interactions with other sequence variations that are distributed differently in two populations or to immunologic and viral variables. We further found that both SNPs had differential binding efficiency to nuclear proteins in the gel shift experiment. These findings suggest that the functional promoter SNP3/SNP4 influences HIV-1 disease progression.
PPIA in human encodes a 165-amino acid protein that is highly conserved across species, with 100% and 96% sequence identity to rhesus monkey and mouse, respectively. The nucleotide sequence of PPIA is 98% identical between human and chimpanzee. No variation in the coding sequence of human PPIA was found in this study or in the dbSNP database. This suggests that differential genetic impact of PPIA SNPs and haplotypes on infection and progression are likely due to regulatory region variation affecting protein levels. The regulation and promoter function of human PPIA is still undefined. PPIA is highly expressed in almost all cell types and is considered a housekeeping gene. Sequence analysis revealed that PPIA promoter contains a TATA box and two SP1 binding sites and is highly GC-rich (~70%) with overrepresented CpG dinucleotides [24]. In this study, we identified two SNPs, each located in two additional SP1 binding elements. SP1 is generally believed to function as a transactivating factor for many housekeeping genes [25]. These two SNP changes, SNP3G and SNP4G, always occurring together through LD, had opposite effects on the nuclear protein binding. Assuming the predicted stronger SP1 binding effect of SNP4 is dominant over the weaker SP1 binding of SNP3, a higher PPIA gene expression would be predicted. This would be consistent with more rapid disease course as observed in this study.
Based on our analyses of eight SNPs covering the entire gene region of PPIA and their haplotypes, we found that the PPIA disease-modifying effects were most likely afforded by promoter SNP3 or SNP4 and the associations with the downstream SNPs 7–11 were largely due to tracking of these two SNPs through LD. In a previous report, Bleiber et al. studied the ex vivo HIV-1 infectivity in CD4+ T cells from healthy individuals carrying the SNP4 and SNP5 alleles (named as PPIA-1604 and PPIA-1650, respectively, in the Bleiber's report), as well as their impact on the CD4 gradient (from CD4+ T-cell counts 500/mm3 to 200/mm3) among SPs enrolled in the Swiss HIV cohort, largely comprised of Caucasians [19]. In the ex vivo experiment, both SNPs showed nonsignificant tendencies toward greater HIV-1 replication, with the effects of SNP5 being more pronounced. In the population study, both SNPs were associated with faster CD4+ T-cell depletion in a model also containing two other candidate genes (model 2); with the SNP5 of PPIA effect again being more pronounced. Thus, the detrimental effect of SNP4 observed from these two studies is largely consistent. In contrast, no evidence supporting a role of SNP5 in AIDS progression was found, although the SNP5 G allele was carried significantly less often in HREU than in SC but was similarly distributed in SC and SN. Thus, the role of CypA polymorphism in HIV-1 infection remains inconclusive and warrants further investigation. Taken together, the association and functional results from these two studies point to a role of PPIA genetic variation in HIV-1/AIDS. In future studies, it may be informative to determine the mechanism of association between PPIA variants and host susceptibility to HIV-1 infection or disease progression in view of the interaction between CypA and the capsid domain of the Gag polyprotein.
Population-based genetic association studies provide a powerful approach to uncovering host genes that confer disease susceptibility or resistance. This approach has led to identification of various genetic factors that affect HIV-1/AIDS, and has provided unique insights into the host HIV-1 interaction [26,27]. The successful identification of true genetic associations requires a large sample size (to minimize the type II error), replication in independent studies (to ward off type I error), and plausible functional evidence (to infer causal relationship). In this study, the plausible genetic-modifying role of PPIA is supported by replication in two independent ethnic groups and the demonstration that SNPs 3 and 4 are each associated with altered binding affinities to transcription factors. Moreover, the previous independent study also provides supportive association and functional evidence [19].
Our comprehensive analysis of nearly all variant alleles and their haplotypes in the PPIA gene is, in essence, equivalent to a gene-based approach [28]. A major problem facing genetic association studies is the difficulty in replication, particularly for single SNP associations. One reason for failure to replicate previous studies is due to potential differences in allele frequencies and LD structure across populations. Gene-based replication has recently been advocated as a gold standard for replication studies [28]. The entire gene with prior SNP association is considered the functional unit and is examined for association with effectively all genetic variation in the gene. Nonreplication due to population differences may be minimized as local allele frequencies and LD structure from study populations are considered with this approach [28]. Thus, our comprehensive survey of PPIA genetic variation and LD structure may facilitate future comparisons of replication studies using a gene-based approach.
In summary, through genetic epidemiological and functional approaches, we have identified two promoter SNPs in PPIA as potential genetic modifiers of HIV-1 disease progression. Our findings corroborate the notion that genetic variation of PPIA influences AIDS pathogenesis and provide in vivo evidence that CypA is a critical host protein in interaction with HIV-1. Manipulation of PPIA may be considered as a plausible option for anti-HIV-1 therapeutic development as previously explored [29].
Materials and Methods
Study participants.
Study participants were enrolled in five United States–based natural history HIV/AIDS cohorts. AIDS Link to the Intravenous Experience (ALIVE) is a community-based cohort of intravenous injection drug users in Baltimore enrolled in 1988–1989 [30], consisting of 92% AA; Multicenter AIDS Cohort Study (MACS) is a longitudinal prospective cohort of men who have sex with men (MSM) from four United States cities: Chicago, Baltimore, Pittsburgh, and Los Angeles, enrolled in 1984–1985 [31], consisting of 83% EA and 10% AA; the San Francisco City Clinic Study (SFCC) is a cohort of MSM originally enrolled in a hepatitis B study in 1978–1980 [32], consisting of 96% EA; Hemophilia Growth and Development Study (HGDS) is a multicenter prospective study that enrolled children with hemophilia who were exposed to HIV-1 through blood products between 1982 and 1983 [33], consisting of 72% EA and 11% AA; the Multicenter Hemophilia Cohort Study (MHCS) is a prospective study that enrolled persons with hemophilia [34], consisting of 90% EA and 6% AA. The participant group is comprised of HIV-1 SCs (infected after study enrollment), SPs (infected at study enrollment), SNs, and HREU. The MACS, MHCS, SFCC, and ALIVE cohorts consist of both SCs and SPs among HIV-1-infected individuals. Due to the potential frailty bias (missing the most rapid progressors to AIDS and death) among SPs, only SCs from these four cohorts were used in the survival analysis. SPs were also included for allele frequency estimation, haplotype inference, and disease categorical analysis. The number of participants studied in each risk or disease category was as follows: SC = 654 EA, 295 AA; SN = 604 EA, 350 AA; HREU = 153 EA, 81 AA; and SP = 1199 EA, 773 AA. Of 290 AA SCs, 237, 42, 5, and 5 were from ALIVE, MACS, MHCS, and HGDS, respectively.
The date of seroconversion after study enrollment was estimated as the midpoint between the last seronegative and first seropositive HIV-1 antibody test; only individuals with less than 2 y elapsed time between the two tests were included in the seroconverter progression analysis. The censoring date was the earliest of the date of the last recorded visit, or December 31, 1995 for the MACS, MHCS, HGDS, and SFCC or July 31, 1997 for the ALIVE cohort to avoid potential confounding by highly effective anti-retroviral therapy (HAART). The censoring date was extended in the ALIVE cohort because of delayed uptake of HAART in this group [30,35].
HIV-1-uninfected individuals were classified into two categories based on individual's documented exposure levels to HIV-1. HREU individuals were those 80 AA and 145 EA with documented high-risk exposure through sharing of injection equipment [36], who had anal receptive sex with multiple partners [37], or transfusions with Factor VIII clotting factor prior to 1984, when heat treatment was initiated [38]. SN individuals (n = 420 and 571, respectively, for AA and EA) are those enrolled in the cohorts who remained HIV-seronegative despite ongoing or prior risk activity.
The study protocols were approved by the Institutional Review Boards of participating institutions and informed consent was obtained from all study participants.
Identification of SNPs.
Nucleotide polymorphisms were discovered in a panel of 92 EA and 92 AA, representing the extremes of the distribution for rapid and slow progression to AIDS and HREU. A nonisotopic RNA cleavage assay following PCR was employed to screen for polymorphisms [39]. PPIA has a high degree of homology to multiple processed pseudogenes that varies from 75% to 95% in the exon regions. PPIA also contains six copies of Alu repeats, each with a length of approximately 300 bp, located in the immediate upstream of the putative promoter region and introns [24]. Sequence comparison and BLAST search were performed to select PPIA-specific PCR primers. Overlapping primers covered nearly the entire PPIA gene region including the putative promoter region, 5′ and 3′ UTRs, all five exons, as well as the Alu repeat regions. A part of intron 1 was not covered due to the high GC content. Primer sequences are presented in Table S1 and are numbered according to the GenBank DNA sequence X52851. Additional intronic SNPs were selected from NCBI dbSNP (http://www.ncbi.nlm.nih.gov/SNP) and HapMap databases (http://www.hapmap.org), by considering location, spacing, and allele frequency at least 10%. Haplotype tagging (ht)SNPs were given preference in the SNP selection. The ancestral allele state of the SNPs was based on a reference chimpanzee sequence.
Genotyping of SNPs.
Genotyping was performed using PCR-restriction fragment length polymorphism (PCR-RFLP) assay or TaqMan assays. PCR-RFLP was carried out with 35 cycles of denaturing at 94 °C for 30 s, annealing at 60 °C for 30 s, and extension at 72 °C for 45 s. The PCR product was digested with respective restriction enzymes (New England Biolabs, http://www.neb.com) overnight and then separated on 3% agarose gels. TaqMan assays were obtained from the Assay-by-Demand service of Applied Biosystems (http://www.appliedbiosystems.com). Genotyping primers and conditions were presented in Table S2. Eight water controls were included on each plate to monitor the potential PCR contamination, and 10% of SC and HREU samples were genotyped twice. The genotypes obtained were free of water contamination or of inconsistencies between duplicates.
Statistical analysis.
To assess the difference in allele frequency distribution in two populations, we performed a contingency χ2 test for each marker to test the null hypothesis that the allele frequencies are the same in the two populations. Fst values were estimated by Wier and Cockerham's method [40].
Pairwise LD was quantified using the absolute value of D′. Absolute values of D′ range from 0 for independence to 1 for complete LD between the pairs of loci. LD plots were generated utilizing Haploview (http://www.broad.mit.edu/mpg/haploview) [20]. A triangular matrix of D′ value was used to demonstrate LD patterns within AA and EA. Haplotype blocks were estimated using the solid spine of LD method [20]. Haplotype blocks were defined with a default algorithm based on confidence intervals of D′ [41], or the solid spine of LD method, which creates blocks of SNPs that have contiguous pairwise D′ values of greater than 0.8. With the latter method, the first and last SNPs in a block are in strong LD with all intermediate SNPs, but the intermediate SNPs are not necessarily in LD with each other [20]. Eight SNP haplotype frequencies were inferred separately for each population by means of an expectation-maximization algorithm [42].
Association analyses were conducted using the statistical packages SAS (version 9.0, SAS Institute, http://www.sas.com). EA and AA groups were analyzed separately because allele and haplotype frequencies were quite different between the two groups. Conformity to the genotype frequencies expected under Hardy-Weinberg equilibrium was examined for each SNP. The genetic effects of SNPs on HIV-1 infection susceptibility were assessed by comparing allelic and genotypic frequencies between HIV-1 HREU and HIV-1 SC participants using the chi square or Fisher's exact test. Regardless of the exposure route, persons in the HREU or SN groups were at risk to HIV-1 infection based on their inclusion in a HIV-1 risk group; therefore, we combined participants across cohorts to achieve a reasonable statistical power.
Kaplan-Meier survival statistics and the Cox proportional hazards model (Cox model) were used to assess the effects of SNPs and haplotypes on the rate of progression to AIDS. Two separate endpoints reflecting advancing AIDS pathogenesis were considered for SCs: (1) HIV-1 infection plus a decline of CD4+ T-cell counts <200 cells/mm3 (CD4 <200); (2) the 1987 Center for Disease Control definition of AIDS (AIDS-87): HIV-1 infection plus AIDS-defining illness [43]. The significance of genotypic associations and RH was determined by unadjusted and adjusted Cox model regression analyses. For each SNP, we compared the minor allele genotypes to the most common genotype as a reference group. All p-values were two-tailed. Genetic factors previously shown to affect progression to AIDS were pre-determined to be included as confounding covariates in the Cox model analysis: CCR5 Δ32, CCR2-64I, CCR5-P1, HLA-B*27, HLA-B*57, HLA-B*35Px group (including HLA-B*3502, B*3503, B*3504, and B*5301), and HLA Class I homozygosity for EA (reviewed in [26,27]); HLA-B*57 and HLA Class I homozygosity for AA. CCR2-64I, HLA-B*27, and HLA-B*35Px were not considered as covariates in AA due to no or weak effects in the AA participants, and CCR5 Δ32 was not considered due to its rarity in AA. Analyses were stratified by sex and by age at seroconversion: 0–20, >20–40, and >40 y [27]. Further stratification by cohort was also performed for the exploratory analyses. In the stratified Cox regression model, the overall log-likelihood of hazards obtained is the sum over strata of the stratum-specific hazards, as estimated by the method of partial likelihood. As the same criteria for determining startpoints (seroconversion date) and endpoints and the similar sampling strategy and follow-up settings were used across cohorts, we combined SCs from all cohorts for the survival analysis to increase the power. Although these cohorts differ in routes of HIV-1 transmission, no appreciable effect of mode of infection on AIDS progression has been found through re-analysis of more than ten thousands of SCs from 38 studies around the world (including three used in this study) [44].
To test the association of PPIA haplotypes and HIV-1 disease progression, we first performed a global test in the Cox regression model for each of two disease outcomes separately for AA and EA. The global null hypothesis is that the odds ratios of all haplotypes are equal between cases and controls. Likelihood ratio tests were used to compare a full model with all haplotypes and a base model with only covariates. When the significance of the global test exceeded a relaxed nominal level, p < 0.10, the associations of individual haplotypes were further tested.
To assess the level of correction factor for the number of SNPs, assuming this was a discovery study, we applied spectral decomposition analysis [45]. This multiple testing correction method assesses the equivalent level of independent SNPs taking account of the extensive LD across PPIA. Based on spectral decomposition analysis of SNPs in this study, a corrected p-value of 0.01 would be equivalent to p = 0.05. As this study was a confirmation and extension study of markers with previous positive association, uncorrected p-values were reported.
Electrophoretic mobility-shift assay.
Cell culture and an electrophoretic mobility-shift assay were performed as described [46]. Freshly explanted human T lymphocytes were obtained from normal donors, purified by isocentrifugation, and activated for 72 h with 1 mg/ml PHA in RPMI 1640 medium containing 10% FCS (Sigma, http://www.sigmaaldrich.com), 2 mM L-glutamine, and penicillin-streptomycin (50 IU/ml and 50 mg/ml, respectively). T lymphocytes were made quiescent by washing and incubating for 24 h in RPMI 1640 medium containing 1% FCS before exposure to cytokines. Cells were then stimulated with 100 nmol/L IL-4 (PeproTech, http://www.peprotechec.com) or 100 nmol/L human rIL-2 (Hoffmann-La Roche, http://www.roche.com) at 37 °C for 10 min. Cell pellets were frozen at −70 °C. The probe sequences were 5′-ttgcgggcggggCcgaacgtggtat-3′ for SNP3C and ttgcgggcggggGcgaacgtggtat-3′ for SNP3G; 5′- ggcgggaggcCaggctcgtgccgtt for SNP4C, and 5′- ggcgggaggcGaggctcgtgccgtt-3′ for SNP4G allele; 5′-aggaaaaccgtgtActattagccatggt-3′ for SNP5A and 5′-aggaaaaccgtgtGctattagccatggt-3′ for SNP5G (SNP site is capped). In cold oligonucleotide competition assay, 100-fold excess of cold unlabeled probe was added as a competitor. The band density was measured by using the software ImageJ (http://rsb.info.nih.gov/ij/index.html). The sequence in and around the SNP sites in the promoter region were searched for the presence of transcription factor binding sites using the program TESS: Transcription Element Search System (http://www.cbil.upenn.edu/tess). Sequence alignment was performed using program ClustalW (http://www.ebi.ac.uk/clustalw).
Supporting Information
(17 KB XLS)
(18 KB XLS)
Accession Numbers
The Entrez Gene databank (http://www.ncbi.nlm.nih.gov/entrez/query.fcgi?db=gene) accession numbers for the genes mentioned in this paper are PPIA (5478) and TRIM5 (85363). The GenBank (http://www.ncbi.nlm.nih.gov) accession numbers for the human and chimpanzee PPIA genomic sequence are X52851 and NW_001237949, respectively. The Transfac binding site (http://www.cbil.upenn.edu/cgi-bin/tess/tess) accession number is R04195 and R03868 for the SP1 factor.
Acknowledgments
We thank Yuchun Zhou and Beth Binns-Roemer for excellent technical assistance.
Abbreviations
- AA
African American
- CI
confidence interval
- CypA
cyclophilin A
- EA
European American
- HIV-1
HIV type 1
- HREU
high-risk exposed uninfected
- LD
linkage disequilibrium
- PPIA
peptidylprolyl isomerase A
- RH
relative hazard
- SC
seroconverter
- SN
seronegative
- SNP
single nucleotide polymorphism
- SP
seroprevalent
Footnotes
Author contributions. PA, SJO, and CAW conceived and designed the experiments and wrote the paper. PA, LHW, and HHD performed the experiments. PA and CAW analyzed the data. GN, SD, JJG, CRR, SB, GDK, and SJO contributed reagents/materials/analysis tools.
Funding. This project has been funded in whole or in part with federal funds from the National Cancer Institute, National Institutes of Health, under contract N01-CO-12400. This research was supported in part by the Intramural Research Program of the National Institutes of Health, National Cancer Institute, Center for Cancer Research, and National Human Genome Research Institute. The National Institute on Drug Abuse, National Institutes of Health, under grant DA-04334 provided funding for the ALIVE cohort. The content of this publication does not necessarily reflect the views or policies of the Department of Health and Human Services, nor does mention of trade names, commercial products, or organizations imply endorsement by the US Government.
Competing interests. The authors have declared that no competing interests exist.
References
- Luban J, Bossolt KL, Franke EK, Kalpana GV, Goff SP. Human immunodeficiency virus type 1 Gag protein binds to cyclophilins A and B. Cell. 1993;73:1067–1078. doi: 10.1016/0092-8674(93)90637-6. [DOI] [PubMed] [Google Scholar]
- Franke EK, Yuan HE, Luban J. Specific incorporation of cyclophilin A into HIV-1 virions. Nature. 1994;372:359–362. doi: 10.1038/372359a0. [DOI] [PubMed] [Google Scholar]
- Schmid FX. Protein folding. Prolyl isomerases join the fold. Curr Biol. 1995;5:993–994. doi: 10.1016/s0960-9822(95)00197-7. [DOI] [PubMed] [Google Scholar]
- Gamble TR, Vajdos FF, Yoo S, Worthylake DK, Houseweart M, et al. Crystal structure of human cyclophilin A bound to the amino-terminal domain of HIV-1 capsid. Cell. 1996;87:1285–1294. doi: 10.1016/s0092-8674(00)81823-1. [DOI] [PubMed] [Google Scholar]
- Braaten D, Ansari H, Luban J. The hydrophobic pocket of cyclophilin is the binding site for the human immunodeficiency virus type 1 Gag polyprotein. J Virol. 1997;71:2107–2113. doi: 10.1128/jvi.71.3.2107-2113.1997. [DOI] [PMC free article] [PubMed] [Google Scholar]
- Thali M, Bukovsky A, Kondo E, Rosenwirth B, Walsh CT, et al. Functional association of cyclophilin A with HIV-1 virions. Nature. 1994;372:363–365. doi: 10.1038/372363a0. [DOI] [PubMed] [Google Scholar]
- Braaten D, Luban J. Cyclophilin A regulates HIV-1 infectivity, as demonstrated by gene targeting in human T cells. EMBO J. 2001;20:1300–1309. doi: 10.1093/emboj/20.6.1300. [DOI] [PMC free article] [PubMed] [Google Scholar]
- Stremlau M, Owens CM, Perron MJ, Kiessling M, Autissier P, et al. The cytoplasmic body component TRIM5alpha restricts HIV-1 infection in Old World monkeys. Nature. 2004;427:848–853. doi: 10.1038/nature02343. [DOI] [PubMed] [Google Scholar]
- Sayah DM, Sokolskaja E, Berthoux L, Luban J. Cyclophilin A retrotransposition into TRIM5 explains owl monkey resistance to HIV-1. Nature. 2004;430:569–573. doi: 10.1038/nature02777. [DOI] [PubMed] [Google Scholar]
- Nisole S, Lynch C, Stoye JP, Yap MW. A Trim5-cyclophilin A fusion protein found in owl monkey kidney cells can restrict HIV-1. Proc Natl Acad Sci U S A. 2004;101:13324–13328. doi: 10.1073/pnas.0404640101. [DOI] [PMC free article] [PubMed] [Google Scholar]
- Berthoux L, Sebastian S, Sokolskaja E, Luban J. Cyclophilin A is required for TRIM5(alpha}-mediated resistance to HIV-1 in Old World monkey cells. Proc Natl Acad Sci U S A. 2005;102:14849–14853. doi: 10.1073/pnas.0505659102. [DOI] [PMC free article] [PubMed] [Google Scholar]
- Stremlau M, Perron M, Lee M, Li Y, Song B, et al. Specific recognition and accelerated uncoating of retroviral capsids by the TRIM5alpha restriction factor. Proc Natl Acad Sci U S A. 2006;103:5514–5519. doi: 10.1073/pnas.0509996103. [DOI] [PMC free article] [PubMed] [Google Scholar]
- Sokolskaja E, Berthoux L, Luban J. Cyclophilin A and TRIM5a independently regulate human immunodeficiency virus type 1 infectivity in human cells. J Virol. 2006;80:2855–2862. doi: 10.1128/JVI.80.6.2855-2862.2006. [DOI] [PMC free article] [PubMed] [Google Scholar]
- Stremlau M, Song B, Javanbakht H, Perron M, Sodroski J. Cyclophilin A: An auxiliary but not necessary cofactor for TRIM5alpha restriction of HIV-1. Virology. 2006;351:112–120. doi: 10.1016/j.virol.2006.03.015. [DOI] [PubMed] [Google Scholar]
- Sokolskaja E, Luban J. Cyclophilin, TRIM5, and innate immunity to HIV-1. Curr Opin Microbiol. 2006;9:404–408. doi: 10.1016/j.mib.2006.06.011. [DOI] [PubMed] [Google Scholar]
- Javanbakht H, An P, Gold B, Petersen DC, O'Huigin C, et al. Effects of human TRIM5alpha polymorphisms on antiretroviral function and susceptibility to human immunodeficiency virus infection. Virology. 2006;354:15–27. doi: 10.1016/j.virol.2006.06.031. [DOI] [PubMed] [Google Scholar]
- An P, Bleiber G, Duggal P, Nelson G, May M, et al. APOBEC3G genetic variants and their influence on the progression to AIDS. J Virol. 2004;78:11070–11076. doi: 10.1128/JVI.78.20.11070-11076.2004. [DOI] [PMC free article] [PubMed] [Google Scholar]
- An P, Duggal P, Wang LH, O'Brien SJ, Donfield S, et al. Polymorphisms of CUL5 are associated with CD4+ T cell loss in HIV-1 infected individuals. PLoS Genetics. 2007;3:e19. doi: 10.1371/journal.pgen.0030019. doi. 10.1371/journal.pgen.0030019. [DOI] [PMC free article] [PubMed] [Google Scholar]
- Bleiber G, May M, Martinez R, Meylan P, Ott J, et al. Use of a combined ex vivo/in vivo population approach for screening of human genes involved in the human immunodeficiency virus type 1 life cycle for variants influencing disease progression. J Virol. 2005;79:12674–12680. doi: 10.1128/JVI.79.20.12674-12680.2005. [DOI] [PMC free article] [PubMed] [Google Scholar]
- Barrett JC, Fry B, Maller J, Daly MJ. Haploview: Analysis and visualization of LD and haplotype maps. Bioinformatics. 2005;21:263–265. doi: 10.1093/bioinformatics/bth457. [DOI] [PubMed] [Google Scholar]
- Batzer MA, Deininger PL. Alu repeats and human genomic diversity. Nat Rev Genet. 2002;3:370–379. doi: 10.1038/nrg798. [DOI] [PubMed] [Google Scholar]
- Javanbakht H, An P, Gold B, Petersen DC, O'Huigin C, et al. Effects of human TRIM5alpha polymorphisms on antiretroviral function and susceptibility to human immunodeficiency virus infection. Virology. 2006;354:15–27. doi: 10.1016/j.virol.2006.06.031. [DOI] [PubMed] [Google Scholar]
- Hatziioannou T, Perez-Caballero D, Cowan S, Bieniasz PD. Cyclophilin interactions with incoming human immunodeficiency virus type 1 capsids with opposing effects on infectivity in human cells. J Virol. 2005;79:176–183. doi: 10.1128/JVI.79.1.176-183.2005. [DOI] [PMC free article] [PubMed] [Google Scholar]
- Haendler B, Hofer E. Characterization of the human cyclophilin gene and of related processed pseudogenes. Eur J Biochem. 1990;190:477–482. doi: 10.1111/j.1432-1033.1990.tb15598.x. [DOI] [PubMed] [Google Scholar]
- Suske G. The Sp-family of transcription factors. Gene. 1999;238:291–300. doi: 10.1016/s0378-1119(99)00357-1. [DOI] [PubMed] [Google Scholar]
- O'Brien SJ, Nelson GW. Human genes that limit AIDS. Nat Genet. 2004;36:565–574. doi: 10.1038/ng1369. [DOI] [PubMed] [Google Scholar]
- O'Brien SJ, Nelson GW, Winkler CA, Smith MW. Polygenic and multifactorial disease gene association in man: Lessons from AIDS. Annu Rev Genet. 2000;34:563–591. doi: 10.1146/annurev.genet.34.1.563. [DOI] [PubMed] [Google Scholar]
- Neale BM, Sham PC. The future of association studies: Gene-based analysis and replication. Am J Hum Genet. 2004;75:353–362. doi: 10.1086/423901. [DOI] [PMC free article] [PubMed] [Google Scholar]
- Liu S, Asparuhova M, Brondani V, Ziekau I, Klimkait T, et al. Inhibition of HIV-1 multiplication by antisense U7 snRNAs and siRNAs targeting cyclophilin A. Nucleic Acids Res. 2004;32:3752–3759. doi: 10.1093/nar/gkh715. [DOI] [PMC free article] [PubMed] [Google Scholar]
- Vlahov D, Graham N, Hoover D, Flynn C, Bartlett JG, et al. Prognostic indicators for AIDS and infectious disease death in HIV-infected injection drug users: Plasma viral load and CD4+ cell count. JAMA. 1998;279:35–40. doi: 10.1001/jama.279.1.35. [DOI] [PubMed] [Google Scholar]
- Kaslow RA, Carrington M, Apple R, Park L, Munoz A, et al. Influence of combinations of human major histocompatibility complex genes on the course of HIV-1 infection. Nat Med. 1996;2:405–411. doi: 10.1038/nm0496-405. [DOI] [PubMed] [Google Scholar]
- Buchbinder SP, Katz MH, Hessol NA, O'Malley PM, Holmberg SD. Long-term HIV-1 infection without immunologic progression. AIDS. 1994;8:1123–1128. doi: 10.1097/00002030-199408000-00014. [DOI] [PubMed] [Google Scholar]
- Hilgartner MW, Donfield SM, Willoughby A, Contant CF, Jr, Evatt BL, et al. Hemophilia growth and development study. Design, methods, and entry data. Am J Pediatr Hematol Oncol. 1993;15:208–218. doi: 10.1097/00043426-199305000-00009. [DOI] [PubMed] [Google Scholar]
- Goedert JJ, Kessler CM, Aledort LM, Biggar RJ, Andes WA, et al. A prospective study of human immunodeficiency virus type 1 infection and the development of AIDS in subjects with hemophilia. N Engl J Med. 1989;321:1141–1148. doi: 10.1056/NEJM198910263211701. [DOI] [PubMed] [Google Scholar]
- Celentano DD, Galai N, Sethi AK, Shah NG, Strathdee SA, et al. Time to initiating highly active antiretroviral therapy among HIV-infected injection drug users. AIDS. 2001;15:1707–1715. doi: 10.1097/00002030-200109070-00015. [DOI] [PubMed] [Google Scholar]
- Vlahov D, Polk BF. Perspectives on infection with HIV-1 among intravenous drug users. Psychopharmacol Bull. 1988;24:325–329. [PubMed] [Google Scholar]
- Detels R, Liu Z, Hennessey K, Kan J, Visscher BR, et al. Resistance to HIV-1 infection. Multicenter AIDS Cohort Study. J Acquir Immune Defic Syndr. 1994;7:1263–1269. [PubMed] [Google Scholar]
- Salkowitz JR, Purvis SF, Meyerson H, Zimmerman P, O'Brien TR, et al. Characterization of high-risk HIV-1 seronegative hemophiliacs. Clin Immunol. 2001;98:200–211. doi: 10.1006/clim.2000.4969. [DOI] [PubMed] [Google Scholar]
- Goldrick MM, Kimball GR, Liu Q, Martin LA, Sommer SS, et al. NIRCA: A rapid robust method for screening for unknown point mutations. Biotechniques. 1996;21:106–112. [PubMed] [Google Scholar]
- Weir BS, Cockerham CC. Estimating F-statistics for the analysis of population structure. Evolution. 1984;38:1358–1370. doi: 10.1111/j.1558-5646.1984.tb05657.x. [DOI] [PubMed] [Google Scholar]
- Gabriel SB, Schaffner SF, Nguyen H, Moore JM, Roy J, et al. The structure of haplotype blocks in the human genome. Science. 2002;296:2225–2229. doi: 10.1126/science.1069424. [DOI] [PubMed] [Google Scholar]
- Long JC, Williams RC, Urbanek M. An E-M algorithm and testing strategy for multiple-locus haplotypes. Am J Hum Genet. 1995;56:799–810. [PMC free article] [PubMed] [Google Scholar]
- Centers for Disease Control. MMWR Morb Mortal Wkly Rep. Suppl 1. Vol. 36. Council of State and Territorial Epidemiologists; AIDS Program, Center for Infectious Diseases; 1987. Revision of the CDC surveillance case definition for acquired immunodeficiency syndrome; pp. 1S–15S. [PubMed] [Google Scholar]
- Cascade Collaboration. Time from HIV-1 seroconversion to AIDS and death before widespread use of highly active antiretroviral therapy: A collaborative re-analysis. Collaborative Group on AIDS Incubation and HIV Survival including the CASCADE EU Concerted Action. Concerted Action on SeroConversion to AIDS and Death in Europe. Lancet. 2000;355:1131–1137. [PubMed] [Google Scholar]
- Nyholt DR. A simple correction for multiple testing for single nucleotide polymorphisms in linkage disequilibrium with each other. Am J Hum Genet. 2004;74:765–769. doi: 10.1086/383251. [DOI] [PMC free article] [PubMed] [Google Scholar]
- Wang LH, Kirken RA, Erwin RA, Yu CR, Farrar WL. JAK3, STAT, and MAPK signaling pathways as novel molecular targets for the tyrphostin AG-490 regulation of IL-2-mediated T-cell response. J Immunol. 1999;162:3897–3904. [PubMed] [Google Scholar]
Associated Data
This section collects any data citations, data availability statements, or supplementary materials included in this article.
Supplementary Materials
(17 KB XLS)
(18 KB XLS)