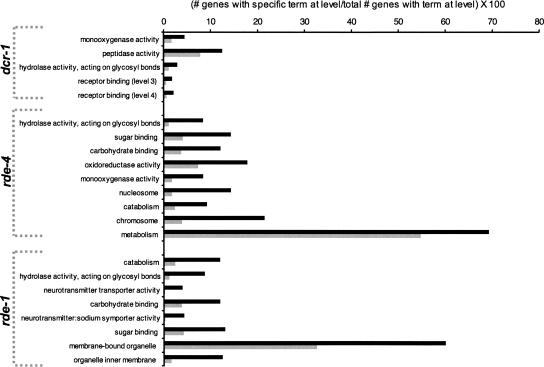
FIGURE 3.
Significant GO terms at levels 3 and 4 of the MF, BP, and CC ontologies. Overrepresented terms are shown for dcr-1(−/−) (P ≤ 0.01, unadjusted), rde-4(−/−) (P ≤ 0.01, unadjusted), and rde-1(−/−) (P ≤ 0.1, unadjusted); underrepresented terms using the same significance cutoff (Supplemental Fig. S3) and the complete analysis for all levels (Supplemental Table S5) are in Supplemental Data. For each mutant, GO terms are listed top to bottom from most to least significant according to the P-value, as determined from a Fishers exact test (unadjusted). Bar height represents the percentage of all genes with annotations at the level associated with the specified GO term; genes misregulated ≥ 1.5-fold (black bars) were compared with the remainder of the genes on the array (gray bars).

