

Abstract
New insights into the biological properties of cyclooxygenase-2 (COX-2) and its response pathway challenge the hypothesis that COX-2 is simply pro-inflammatory and inhibition of COX-2 solely prevents the development of inflammation and ameliorates inflammatory pain. The present study performed a comprehensive analysis of gene/protein expression induced by a selective inhibitor of COX-2, rofecoxib, compared with a non-selective COX inhibitor, ibuprofen, and placebo in a clinical model of acute inflammatory pain (the surgical extraction of impacted third molars) using microarray analysis followed by quantitative RT-PCR verification and Western blotting. Inhibition of COX-2 modulated gene expression related to inflammation and pain, the arachidonic acid pathway, apoptosis/angiogenesis, cell adhesion and signal transduction. Compared to placebo, rofecoxib treatment increased the gene expression of ANXA3 (annexin 3), SOD2 (superoxide dismutase 2), SOCS3 (suppressor of cytokine signaling 3) and IL1RN (IL1 receptor antagonist) which are associated with inhibition of phospholipase A2 and suppression of cytokine signaling cascades, respectively. Both rofecoxib and ibuprofen treatment increased the gene expression of the pro-inflammatory mediators, IL6 and CCL2 (chemokine C-C motif ligand 2), following tissue injury compared to the placebo treatment. These results indicate a complex role for COX-2 in the inflammatory cascade in addition to the well-characterized COX-dependent pathway, as multiple pathways are also involved in rofecoxib-induced anti-inflammatory and analgesic effects at the gene expression level. These findings may also suggest an alternative hypothesis for the adverse effects attributed to selective inhibition of COX-2.
Keywords: acute inflammation, pain, COX-2 inhibition, gene, protein expression
1. INTRODUCTION
It is generally accepted that nonsteroidal anti-inflammatory drugs (NSAIDs), including nonselective traditional NSAIDs (tNSAIDs) and selective inhibitors of cyclooxygenase-2 (COX-2), regulate inflammation via inhibition of the enzymatic activity of COX-2 in the arachidonic acid (AA) pathway. Coxibs, selective inhibitors of COX-2, were developed to overcome the gastrointestinal (GI) adverse effects of tNSAIDs which are attributed to inhibition of the constitutively expressed cyclooxygenase-1 (COX-1) (FitzGerald, 2003). However, new insights into the biological properties of COX-2 and its response pathway challenge the hypothesis that COX-2 is simply pro-inflammatory and inhibition of COX-2 solely prevents the development of inflammation and ameliorates inflammatory pain (Gilroy et al, 1999; Kapoor et al., 2005). Accumulating data has revealed that COX-2 expression is not limited to sites of inflammation (Ek et al., 2001). COX-2 and COX-2 derived prostanoids have been implicated in the biological processes of angiogenesis (Ben-Av et al., 1995), proliferation (Gately and Li, 2004), apoptosis (Gilroy et al., 2003), cell adhesion (Pillinger et al., 2005) and inflammatory resolution (Gilroy et al., 1999; Wallace and Devchand, 2005) through COX-2-dependent and independent mechanisms (Tegeder et al., 2001). Cancer prevention by tNSAIDs and coxibs is partially due to their modulation of alternative eicosanoid pathways, which are non-COX-2 effects (Rigas and Kashfi, 2005) not requiring the presence of COX-2 enzyme. Recent clinical trials provide further evidence that the cardiovascular adverse effects attributed to COX-2 inhibition may not be attributed solely to COX-2 inhibition (Grösch et al., 2006). COX-2-independent molecular mechanisms may also contribute to the increased risk of cardiovascular events (Bombardier et al., 2000; Wong et al., 2005) and delay the wound healing process (Fukunaga et al., 2005; Futagami et al., 2002; Gilroy et al., 1999).
In a well-characterized clinical model of acute inflammatory pain (the surgical extraction of impacted third molars), we previously observed overexpression of COX-2 in the first 4 hours following tissue injury (Lee et al., 2006) with a resultant increase in PGE2 concentration at the surgical site (Gordon et al., 2002; Khan et al., 2002). At 48 hours post-surgery, however, the induced COX-2 expression returned to the pre-surgical baseline level in placebo group while COX-2 gene expression was increased by the treatment with either rofecoxib or ibuprofen (Lee et al., 2006). These findings together with other reports (Maloney et al., 1998) provide evidence in humans that COX-2 is an early expression gene with a transient temporal pattern at gene and protein expression levels. Using this model, we have also demonstrated a non-COX-2 molecular mechanism of rofecoxib-induced changes in matrix metalloproteinase pathway during acute inflammation in humans (Wang et al., 2006). In the current study, we performed a comprehensive investigation of gene expression changes induced by a highly selective COX-2 inhibitor, rofecoxib, compared with that of a non-selective COX inhibitor, ibuprofen, and placebo. Genes regulated by acute inflammation in the placebo group and the drug treatments were categorized into different pathways based on their biological process and molecular function, with a focus on changes in gene expression related to inflammation and pain.
2. METHODS
2.1 Subjects and biopsies
A total of 158 oral mucosal biopsies were taken from 79 healthy volunteers (68% Caucasian, 15% African American, 10% Asian, 3% Hispanic and 4% other race) between 18 to 35 years old who required extraction of impacted third molars. The protocol was approved by the Institutional Review Board of the National Institute of Dental and Craniofacial Research, National Institutes of Health (NIH). Written informed consent was obtained from all participants before treatment. Pregnant or lactating females, or patients with the presence of clinical signs of infection or inflammation at the extraction sites were not included in the study. Subjects randomly received either ibuprofen (400 mg, QID), rofecoxib (50 mg, QD), or a placebo 90 minutes before surgery and up to 48 hrs post-surgery. A 3 mm punch biopsy was taken from the oral mucosa overlying the impacted third molar prior to the first surgical incision and a second biopsy was taken from a different surgical site 48 hours post-surgery. All biopsies were immediately frozen in liquid nitrogen and stored at −70 ºC until ready for RNA extraction.
2.2 Gene analysis using Affymetrix microarray
A total of 36 (n = 6 per treatment) GeneChip Human Genome U133 Plus 2.0 (HG-U133 Plus 2.0, Affymetrix) were used in the study. As described previously (Wang et al., 2006), all microarrays were processed by one person in the same laboratory following standard operating protocols to minimize non-biological technical bias. Briefly, total RNA was extracted from each oral mucosal biopsy using Trizol (Invitrogen, Carlsbad, CA) according to the manufacturer’s protocol. All extracted RNAs were purified using an RNeasy mini kit (Qiagen, Valencia, CA). The purity and integrity of RNA were assessed by spectrophotometer (Beckman DU-600) and gel electrophoresis (Invitrogen), respectively. A total of 5 μg of purified RNA was reverse-transcribed into cDNA using T7-oligo (dT) primer (Affymetrix, Santa Clara, CA) and SuperScript II RT (Invitrogen). Synthesized and purified cDNA was used as a template for synthesis of the biotin-labeled cRNA using BioArray RNA transcript labeling kit (Enzo, Farmingdale, NY) and quantification of the labeled cRNA was calculated based on the adjusted cRNA formula. Subsequently, a total of 15 μg of fragmented cRNA from each biopsy was hybridized on each chip at 45ºC for 16 hours in a GeneChip hybridization oven at 60 rpm. GeneChip operating software (GCOS 1.1, v1.1, Affymetrix) was used to scan the images and for data acquisition. A global scaling factor (target signal to 500) was used across all arrays to minimize the variables due to sample preparation, hybridization/staining or from different lots of arrays. Microarray quality control (QC) was evaluated for each Affymetrix array as described previously (Wang et al., 2006).
2.3. Microarray data extraction and statistical analysis
The HG-U133 Plus 2.0 chip is comprised of 47,000 transcripts, including 38,000 well-characterized human genes and the expressed sequence tags (ESTs). Affymetrix raw data were acquired using comparison expression analysis of GCOS Software to yield CHP files according to the user instructions. A paired t-test was used to compare the relative changes in gene expression following acute inflammation for each treatment group. Gene expression in pre-surgery normal tissue was used as the baseline control. The placebo group therefore represents the effects of acute inflammation compared to the interaction of the drug treatments on acute inflammation. CHP files include signal intensity, signal log ratio (post- to pre-surgery, one-step Tukey’s Biweight test), and detection p-value (Wilcoxon’s Signed Rank test) for each probe set. Candidate genes of interest were selected based on both statistical significance and fold changes using SAS software (version 9.1, SAS Institute, Cary, NC) and ArrayAssist software (v2.6, Iobion, La Jolla, CA). First, the transcripts with no change (NC) in expression in all treatment groups were filtered out to include only the transcripts with changes in expression following tissue injury for analysis. A total of 28,207 (60%) transcripts was included. Second, only the transcripts whose expression changed over 3-fold at least in three of six samples (n = 6 per treatment) following tissue injury in any treatment group (either in placebo, ibuprofen or in rofecoxib) were selected, leaving 3947 transcripts (8.4%) for further analysis. Third, ANOVA analysis was applied to examine the differences in expression following inflammation among the three treatment groups, with p (F-test) ≤ 0.05, df = 2. The changes in gene expression induced by acute inflammation in the placebo group were compared to that in the drug treatment groups. Only the transcripts showing significant differences following the drug treatments, p (F-test) ≤ 0.05, were considered for further analysis. However, some transcripts showing large differences (fold range ≥ 4) in expression among the treatment groups even without statistical significance were kept for further analysis. There was a total of 988 transcripts (2%) left, and in the current analysis, we focused on the well-characterized human genes using the batch query in the NetAffx from http://www.affymetrix.com/index.affy. A total of 235 genes were identified and classified into individual functional pathway based on their biological process, molecular function and cellular component.
2.4. Verification by quantitative real-time PCR
The changes in gene expression selected from microarray analysis were validated using the same RNA samples (n = 3) which were used in microarray analysis, with additional RNA samples obtained from different subjects (n = 22 for placebo, n = 18 for ibuprofen and n = 19 for rofecoxib). As described previously (Wang et al., 2006), all reagents used in qRT-PCR were purchased from Applied Biosystems (Foster City, CA), and 1 μg of DNase-treated RNA (Qiagen, Valencia, CA) was used to synthesize cDNA using random primers from the High-Capacity cDNA Archive Kit (Catalog no. 4322171) according to the manufacturer’s instruction. PCR was performed with cDNA template using the PCR Master Mix with AmpErase UNG (Catalog no. 4304437). Sequence–specific primers and TaqMan MGB probes were purchased from Assays-on-Demand Gene expression product. Quantification of gene expression was performed in a 20 μl reaction (384-well plate) on ABI Prism 7900 HT Sequence Detection System. Each sample was run in triplicate and 18S rRNA was used as an endogenous control in all RT-PCR experiments because expression level of the gene was consistent in all oral mucosal samples in the present study. Negative controls were processed under the same conditions without a cDNA template. Data acquisition was conducted based on User Bulletin #2 software (v1.6, Applied Biosystems). The threshold cycle (Ct) of 18S rRNA was used to normalize target gene expression (ΔCt) to correct for experimental variations. The relative change in gene expression (ΔΔCt) was used for comparison of the gene expression in post-surgery tissue versus that in pre-surgery tissue using paired t-test. The differences in the mean values among the treatment groups were performed using one-way ANOVA, followed by Tukey test for pairwise comparisons. All statistical analyses were conducted using SAS software (version 9.1, SAS Institute, Cary, NC). Significance was defined as p ≤ 0.05.
2.5. Western blotting analysis
Protein was extracted from the same samples which were used for microarray analysis after RNA extraction. Briefly, DNA was precipitated by ethanol and the supernatant protein was precipitated by isopropanol, washed with guanidine/ethanol solution, and solubilized in 1% SDS. Proteins were electrophoretically separated on a 14% Tris-Glycine gel (Invitrogen, Carlsbad, CA) and then transferred to 0.2μ nitrocellulose membrane (Invitrogen, Carlsbad, CA). Non-specific binding was blocked by incubation of the membrane overnight at 4°C in 5% non-fat milk solution made in Tris-buffered saline containing 0.05% Tween-20 (TTBS) with 0.02% Sodium azide added.. Subsequently, the membrane was incubated with the relevant primary antibody (IL6, sc-7920; SOCS-3, sc-7009, 1:200; Santa Cruz Biotechnology) for 2 hours at room temperature. Membranes were incubated with secondary antibody (goat anti-rabbit IgG or bovine anti-goat IgG) conjugated with HRP (1:1000) for 30 min. After extensive washing, the membranes were developed using an enhanced chemiluminescent reagent (SuperSignal West Dura; Pierce) and exposed to X-ray film (KodaK BioMax XAR, Rochester, NY). ImageQuant (Molecular Dynamics, v5.2) software was used to semi-quantitatively analyze the intensity of the expression. Positive controls used were Hela cell lysate (sc-2222, Santa Cruz Biotechnology) and BJAB whole cell lysate (sc-2207) for IL6 and SOCS3, respectively.
3. RESULTS
3.1. Gene expression profile following acute inflammation and rofecoxib/ibuprofen treatment
As shown in Figure 1, a greater number of transcripts was modulated in the rofecoxib-treated group as compared to the treatments of placebo or ibuprofen. Rofecoxib treatment induced an increase of 6.6 ± 1.2% in expression of transcripts from the total number of transcripts (over 47,000 transcripts, including well-characterized genes and ESTs) in the chip (Human genome U133 Plus 2.0) in comparison with an increase of 4.8 ± 1.1% in the ibuprofen and 5.5 ± 1.2% in acute inflammation (placebo group) alone. In parallel, rofecoxib treatment induced a decrease of 8.8 ± 1.3% in expression of total transcripts in comparison with 5.7 ± 1.2% decrease in the ibuprofen treatment and 7.3 ± 1.9% decrease in the placebo group (Figure 1A).
Figure 1.
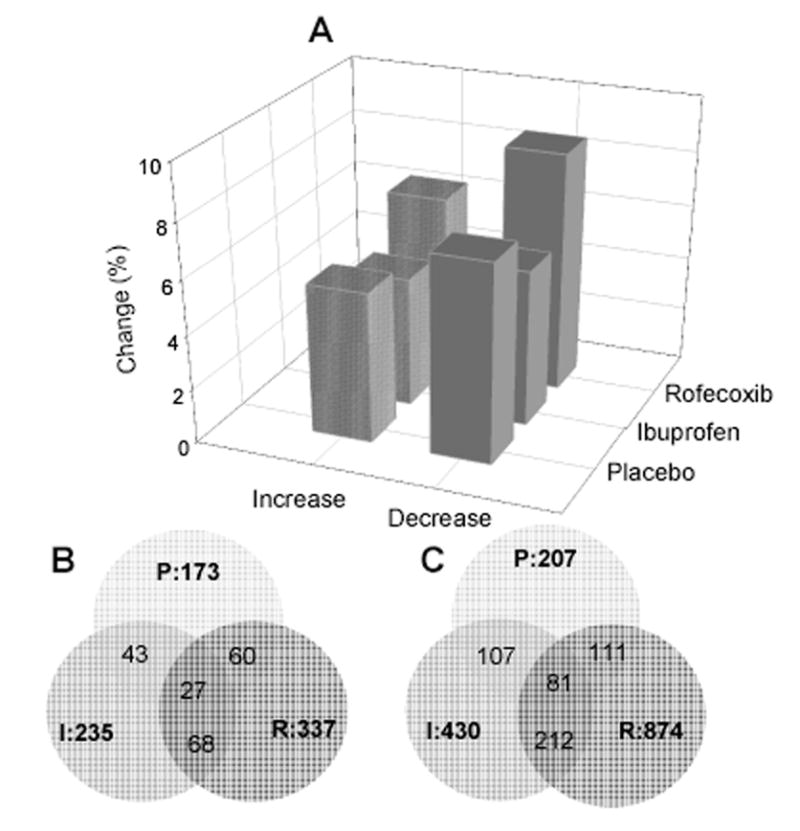
Gene expression profile induced by acute inflammation and inhibition of cyclooxygenase in a clinical model of tissue injury. A, change in percentage of transcripts with significant up- or down-regulation following acute inflammation (placebo) and treatments by ibuprofen or rofecoxib (paired t-test, GCOS software). B, distribution and intersection of up-regulated transcripts (over 3-fold, p < 0.05, n = 6 per treatment) following tissue injury in each treatment group; C, distribution and intersection of down-regulated transcripts (over 3-fold, p < 0.05, n = 6 per treatment) following tissue injury in each treatment groups.
There were 173, 235 and 337 transcripts with significant up-regulation (over 3-fold, p < 0.05, n = 6 per treatment) in the placebo, ibuprofen and rofecoxib treatment groups, respectively (Figure 1B), including 68 transcripts overlapping in both the ibuprofen and rofecoxib treatment groups. A greater number of transcripts was significantly down-regulated (over 3-fold, p < 0.05, n = 6 per treatment) by acute inflammation (n = 207), ibuprofen (n = 430) or rofecoxib (n = 874), including 212 transcripts overlapping in both the ibuprofen and rofecoxib treatment groups (Figure 1C).
Based on their biological process and molecular function, the identified well-characterized genes with significant up- or down-regulation were categorized into (1) the arachidonic acid (AA) pathway; (2) biological pathways related to inflammation and pain; (3) angiogenesis and apoptosis pathways; (4) pathways associated with cell adhesion and proteolysis, and (5) signal transduction pathways (Table 1).
Table 1.
Changes in gene expression following acute inflammation and drug treatments in a clinical model of tissue injury identified by Affymetrix microarray analysis
| Gene symbol | Gene Title | Placebo | Ibuprofen | Rofecoxib |
|---|---|---|---|---|
| AA pathway | ||||
| ALOX12B | arachidonate 12-lipoxygenase, 12R type | −11 * | −4 * | −3 |
| ALOX15B | arachidonate 15-lipoxygenase, second type | −1 | −2 | 3 ‡ |
| ALOXE3 | arachidonate lipoxygenase 3 | −6 * | −8 * | −2 |
| PLA2G2A | phospholipase A2, group IIA | 31 * | 22 * | 11 * |
| ANXA1 | Annexin A1 | 3 * | 3 * | 4 * |
| ANXA3 | annexin A3 | 2 | 4 * | 6 *† |
| SOD2 | superoxide dismutase 2, mitochondrial | 2 | 4 * | 8 * |
| HPGD | Hydroxyprostaglandin dehydrogenase 15-(NAD) | −2 | −9 * | −16 *† |
|
| ||||
| Inflammation/Pain | ||||
| DEFB4 | defensin, beta 4 | 1 | 3 * | 11 *† |
| NLF1 | Nuclear localized factor 1 | 2 | 8 | 9 * |
| IL6 | interleukin 6 (interferon, beta 2) | 4 | 6 * | 7 * |
| IL1A | interleukin 1, alpha | 3 * | 1 † | 3 * |
| IL1RN | interleukin 1 receptor antagonist | 2 | 1 | 4 *‡ |
| SERPINA3 | serpin peptidase inhibitor, clade A, member 3 | −1 | 3 | 5 † |
| SCD | stearoyl-CoA desaturase (delta-9-desaturase) | −2 | −3 | 5 *† ‡ |
| CCL2 | chemokine (C-C motif) ligand 2 | 2 | 3 | 3 * |
| C3 | complement component 3 | 14 * | 7 * | 2 † |
| F3 | coagulation factor III (thromboplastin, tissue factor) | 3 * | 1 † | 2 |
| FABP4 | Fatty acid binding protein 4, adipocyte | 5 | −2 † | −2 † |
| AOX1 | aldehyde oxidase 1 | 3 * | 2 | −1 † |
| PIK4CA | phosphatidylinositol 4-kinase, catalytic, alpha polypeptide | 1 | −1 | −4 *† |
| COLEC12 | Collectin sub-family member 12 | 2 | 2 | −4 *† |
| CLU | clusterin (complement lysis inhibitor) | 3 * | 5 * | 1 † ‡ |
| NQO1 | NAD(P)H dehydrogenase, quinone 1 | −2 | −6 * | −1 ‡ |
| NOS1 | Nitric oxide synthase 1 (neuronal) | −32 * | −24 * | −39 * |
| CACNA2D3 | calcium channel, voltage-dependent alpha 2/delta 3 subunit | −3 * | −4 * | −11 *† |
| CX3CL1 | chemokine (C-X3-C motif) ligand 1 | −2 | −3 * | −9 * |
| CXCL1 | chemokine (C-X-C motif) ligand 1 | 2 | 2 | 13 * |
| IGKV | immunoglobulin kappa variable 1-5 | −4 | −24 * | −13 |
| IGKC | immunoglobulin kappa constant | −7 | −28 * | −11 |
| IGLC1 | immunoglobulin lambda constant 1 | −8 | −33 * | −21 |
| IGHG3 | immunoglobulin heavy constant gamma 3 | −13 | −25 * | −10 |
| IGLJ3 | immunoglobulin lambda joining 3 | −12 | −56 * | −23 |
| IGL@ | immunoglobulin lambda locus | −22 | −43 * | −21 |
|
| ||||
| Cell adhesion/Proteolysis | ||||
| CDH3 | cadherin 3, type 1, P-cadherin (placental) | 1 | 3 * | 5 *† |
| MLLT4 | myeloid/lymphoid or mixed-lineage leukemia; 4 | 1 | −1 | 4 *‡ |
| IBRDC2 | IBR domain containing 2 | 1 | 1 | 3 *† ‡ |
| TRIM17 | tripartite motif-containing 17 | 1 | −1 | 4 *‡ |
| TFRC | transferrin receptor (p90, CD71) | 1 | −2 | 3 ‡ |
| TNC | tenascin C (hexabrachion) | −1 | 3 *† | 3 *† |
| CRISP3 | cysteine-rich secretory protein 3 | 30 * | 7 | 2 † |
| ITGBL1 | integrin, beta-like 1 (with EGF-like repeat domains) | −5 | −8 * | −24 * |
| COL11A1 | collagen, type XI, alpha 1 (undulin) | −18 | −26 * | −15 |
| DSC1 | desmocollin 1 | −23 | −29 * | −37 * |
| CDSN | corneodesmosin | −32 | −58 * | −33 * |
| TMPRSS4 | transmembrane protease, serine 4 | 6 * | 6 * | 25 * |
| OSF-2 | Periostin, osteoblast specific factor | −3 | −2 | −15 * |
| NAALADL2 | Ubiquitin-conjugating enzyme E2 variant 1 | −2 | −2 | −9 *† ‡ |
| COL14A1 | collagen, type XIV, alpha 1 (undulin) | −2 | −3 | −7 *† |
| CDH2 | cadherin 2, type 1, N-cadherin (neuronal) | −2 | −1 | −6 *‡ |
| ANXA9 | annexin A9 | 1 | −3 *† | −6 *† |
| TSPAN-2 | tetraspanin 2 | 1 | 2 | −4 *† ‡ |
| CSPG2 | chondroitin sulfate proteoglycan 2 (versican) | 1 | −1 | −4 † |
| NFASC | neurofascin | −1 | −2 | −4 *† ‡ |
| HGF | hepatocyte growth factor | 2 | 2 | −4 *† ‡ |
| LY9 | lymphocyte antigen 9 | 2 | −3 *† | −2 |
| ADAMTS8 | ADAM metallopeptidase, thrombospondin type 1 | 1 | 3 * | −1 ‡ |
|
| ||||
| Apoptosis/Angiogenesis | ||||
| CEACAM1 | carcinoembryonic antigen-related cell adhesion molecule 1 | 6 * | 3 * | 14 * |
| FAF1 | Fas (TNFRSF6) associated factor 1 | −1 | −2 | 3 ‡ |
| MAL | mal, T−cell differentiation protein | 4 * | 1 † | 1 † |
| ANGPTL1 | angiopoietin-like 1 | 1 | −1 | −21 *† |
| ANGPT1 | angiopoietin 1 | −2 | −2 | −5 *† |
| LTBR | lymphotoxin beta receptor (TNFR superfamily) | 1 | −3 *† | −1 |
| FAIM2 | Fas apoptotic inhibitory molecule 2 | −2 | −3 | −13 *† |
|
| ||||
| Signal Transduction | ||||
| GPR110 | G protein-coupled receptor 110 | 4 * | 3 | 13 * |
| SOCS3 | suppressor of cytokine signaling 3 | 3 * | 6 * | 11 *† |
| STAT3 | signal transducer and activator of transcription 3 | 2 | 2 | 4 * |
| LMX1A | LIM homeobox transcription factor 1, alpha | 1 | 2 | 4 *† ‡ |
| PML | promyelocytic leukemia | 1 | 4 * | 5 *† |
| TEAD4 | TEA domain family member 4 | 1 | 2 | 4 *† |
| GPR126 | G protein-coupled receptor 126 | −2 | −3 | 4 ‡ |
| FLNB | filamin B, beta (actin binding protein 278) | 1 | 2 | 3 *† |
| NPAS3 | neuronal PAS domain protein 3 | −4 * | 2 | 3 † |
| PYY | peptide YY | 4 * | −2 † | 2 |
| MAD | MAX dimerization protein 1 | 4 * | 2 † | 2 |
| FOSB | FBJ murine osteosarcoma viral oncogene homolog B | −2 | 3 *† | 1 |
| SH2D1A | SH2 domain protein 1A, Duncan's disease | 7 * | 2 | −1 † |
| MTA2 | metastasis associated 1 family, member 2 | 4 * | 2 † | −1 † |
| INSM1 | insulinoma-associated 1 | −6 * | −2 † | −2 † |
| LIFR | leukemia inhibitory factor receptor | 1 | −1 | −3 *† |
| ETV5 | Ets variant gene 5 (ets-related molecule) | 2 | 1 | −4 † ‡ |
| RORC | RAR-related orphan receptor C | 1 | 1 | −4 *† ‡ |
| PARG1 | Rho GTPase activating protein 29 | 2 | 1 | −4 *† ‡ |
| RASA1 | RAS p21 protein activator 1 | −1 | −1 | −4 * |
| PTGER3 | Prostaglandin E receptor 3 (subtype EP3) | −2 | −3 * | −4 *† |
| GATA3 | GATA binding protein 3 | 2 | −2 | −5 *† |
| MEF2C | MADS box transcription enhancer factor 2 polypeptide C | −1 | 1 | −5 *‡ |
| EPHB6 | EPH receptor B6 | −2 | −3 * | −5 *† |
| MGC13105 | zinc finger protein | −1 | −2 | −6 *† ‡ |
| KLF12 | Kruppel-like factor 12 | −1 | 1 | −6 *‡ |
| MBTD1 | mbt domain containing 1 | −1 | −1 | −7 *† ‡ |
| NPR2 | natriuretic peptide receptor B/guanylate cyclase B | 1 | −2 | −7 *† |
| FOXD1 | forkhead box D1 | 1 | −1 | −10 *† ‡ |
| MEOX2 | mesenchyme homeo box 2 | −2 | −4 | −12 *† |
| EPHA3 | EPH receptor A3 | −2 | −2 | −13 *† ‡ |
| PRRX1 | Paired related homeobox 1 | −2 | −2 | −13 * |
| MAPRE2 | Microtubule-associated protein, RP/EB family | −3 | −7 * | −16 *† |
| FRZB | frizzled-related protein | −8 * | −5 * | −26 *‡ |
The values are expressed as mean fold changes (n = 6 per treatment).
p< 0.05, compared between post- vs pre-surgery in each treatment group;
p < 0.05, vs placebo group;
p < 0.05, vs ibuprofen group.
3.2. Gene expression changes in the arachidonic acid pathway following acute inflammation and rofecoxib/ibuprofen treatment
Eight genes related to the AA pathway were up- or down- regulated from the baseline biopsy following acute inflammation and COX inhibition. Acute inflammation induced an increase in gene expression encoding annexins, such as ANXA1 and ANXA3 in all treatment groups, with the rofecoxib-induced increase in ANXA3 (6-fold) significantly different from that in the placebo group (p = 0.02). The change in ANXA3 gene expression verified by qRT-PCR was consistent with the microarray data in both the direction and magnitude of change (Figure 2). Moreover, the more sensitive qRT-PCR revealed that the increased expression of ANXA3 induced by ibuprofen treatment after tissue injury was also significantly different from that in the placebo group (p = 0.006, Figure 3).
Figure 2.
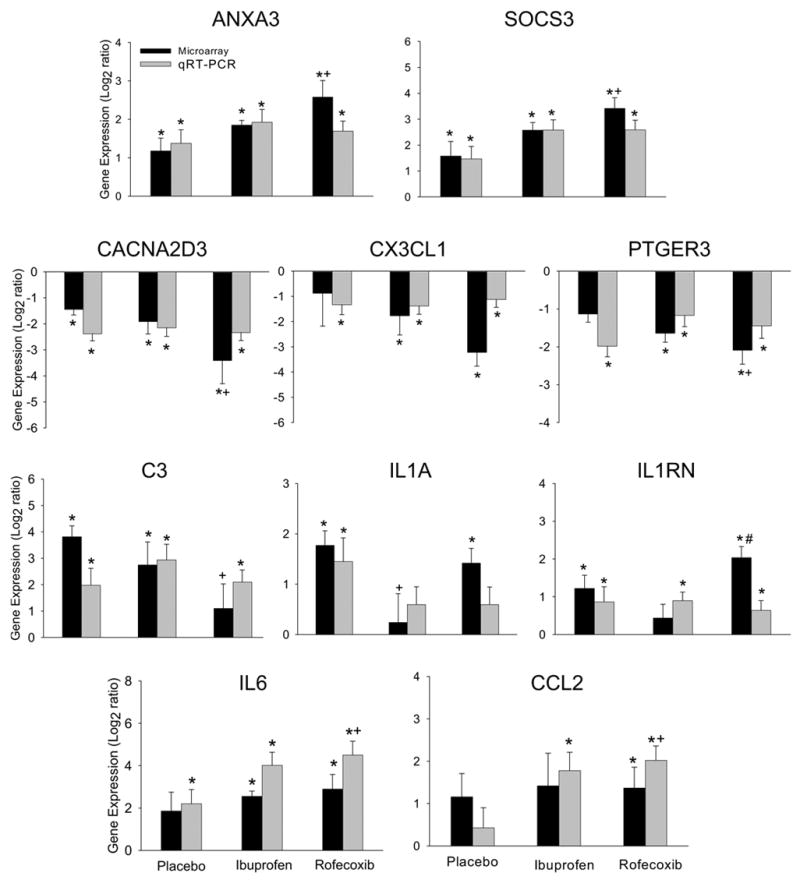
Comparison of changes in gene expression analyzed by microarray and qRT-PCR. The data are expressed as mean ± SEM. *, p < 0.05, compared between pre- and post-surgery tissue (paired t-test); +, p < 0.05, compared between place and rofecoxib treatments (F-test, df = 2); #, p < 0.05 compared between rofecoxib and ibuprofen treatments (F-test, df = 2).
Figure 3.
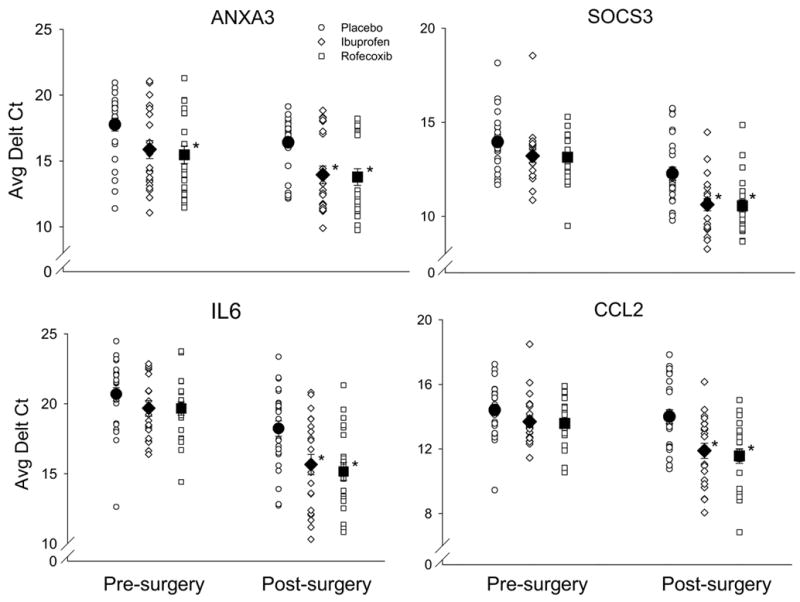
The changes in gene expression following acute inflammation and drug treatments as assessed by qRT-PCR. The gene expression level is expressed as the average threshold cycle after normalization using 18 rRNA expression (Average Delt Ct). The open symbols represent the gene expression level from each subject in normal pre-surgery tissue and after tissue injury. The solid symbols represent mean ± SEM. *, p < 0.05 significant difference from the placebo group (one-way ANOVA followed by Tukey test).
Expression of SOD2 (encoding superoxide dismutase 2) was significantly increased by rofecoxib (8-fold, p = 0.013) and ibuprofen (4-fold, p = 0.021) compared to that in the placebo group (Table 1). HPGD, a gene encoding hydroxyprostaglandin dehydrogenase 15-(NAD) which is a key enzyme responsible for the biological inactivation of prostaglandins, was markedly decreased in the rofecoxib (16-fold, p = 0.003) and ibuprofen (9-fold, p = 0.004) treated tissues following tissue injury. However, only the difference between the rofecoxib and placebo groups reached significance (p = 0.05, Table 1).
Expression of ALOX12B, a gene encoding arachidonate 12-lipoxygenase that results in production of leukotrienes from AA, was decreased by acute inflammation (11-fold, p = 0.01), but to a less extent by the ibuprofen treatment (4-fold, p = 0.002), whereas the decrease was not significant in the rofecoxib group (3-fold, p = 0.88, Table 1). ALOX15B expression, which encodes arachidonate 15-lipoxygenase, was increased in the rofecoxib group compared to that in the placebo and ibuprofen treatment groups, and this increase was significantly different from that in the ibuprofen group (p = 0.04, Table 1).
3.3. Changes in gene expression related to inflammation and pain following acute inflammation and rofecoxib/ibuprofen treatment
Following tissue injury, gene expression of IL1A was increased in the placebo group identified by microarray (3-fold, Table 1) and verified by qRT-PCR (Figure 2). Ibuprofen and rofecoxib treatments diminished the increase in IL1A induced by acute inflammation (Figure 2) verified by qRT-PCR, although only the difference in the expression between ibuprofen and placebo reached significance (p = 0.04) in microarray analysis.
Interestingly, the gene expression of C3 (complement component 3) was markedly increased in the placebo (14-fold, p = 0.02) and ibuprofen (7-fold, p = 0.05) treated groups following tissue injury. In contrast, the increase was diminished in the rofecoxib treated tissue after tissue injury (p = 0.38), and the difference in the expression intensity between the placebo and rofecoxib groups was significant (p = 0.02, Table 1). As shown in Figure 2, qRT-PCR confirmed the microarray results for the direction and approximate magnitude of change. Compared to ibuprofen treatment, rofecoxib treatment suppressed, to a large extent, the gene expression of CACNA2D3 (encoding voltage-dependent calcium channel, alpha 2/delta 3 subunit) by 11-fold (CACNA2D3, p = 0.0001), CX3CL1 (chemokine C-X3-C motif ligand 1) by 9-fold (p = 0.001), PTGER3 (prostaglandin E receptor 3) by 4-fold (p = 0.003) and NOS1 (nitric oxidase synthase) by 39-fold (p = 0.03), with a significant difference in the gene expression of CACNA2D3 and PTGER3 from that in the placebo group (Table 1). The changes in the gene expression of CACNA2D3, CX3CL1 and PTGER3 verified by qRT-PCR were concordant in change direction with that from microarray analysis.
The expression of pro-inflammatory mediators IL6 and CCL2 (chemokine C-C motif ligand 2, also known as monocyte chemoattractant protein, MCP-1) was unexpectedly enhanced by rofecoxib (7-fold, p = 0.031 for IL6 and 3-fold, p = 0.03 for CCL2) and ibuprofen (6-fold, p = 0.002 for IL6 and 3-fold, p = 0.13 for CCL2) following acute inflammation. The changes in the gene expression were confirmed by qRT-PCR and the results were congruent with the data from microarray examination in change direction and magnitude (Figure 2). Further, the increases in gene expression of IL6 and CCL2 induced by ibuprofen and rofecoxib treatments following tissue injury were significantly different as compared to that in the placebo group verified by qRT-PCR confirmation (one-way ANOVA followed by Tukey test, Figure 3).
Additionally, the expression of genes encoding immunoglobulin family members was significantly down–regulated by ibuprofen treatment following acute inflammation in the post-surgery tissue (Table 1).
3.4. Changes in gene expression associated with suppression of cytokines following acute inflammation and rofecoxib/ibuprofen treatment
SOCS3 (encoding suppressor of cytokine signaling 3) and IL1RN (encoding IL1 receptor antagonist) both are functionally associated with suppressing cytokine activities. The up-regulation induced by rofecoxib treatment in the gene expression of SOCS3 (11-fold, p = 0.0007), IL1RN (4-fold, p = 0.003) and DEFB4 (encoding defensin beta 4, 11-fold, p = 0.01) was significantly different from that in the placebo or ibuprofen group (Table 1). The expression changes in SOCS3 and IL1RN shown by qRT-PCR verification were in concordance with the results from microarray in direction and magnitude (Figure 2). Moreover, the increases in SOCS3 gene expression induced by the ibuprofen and rofecoxib treatments following tissue injury were significant in comparison to the placebo treatment as shown by qRT-PCR verification (one-way ANOVA followed by Tukey test, Figure 3).
3.5. Rofecoxib/ibuprofen treatment increases the protein expression of IL6 and SOCS3 following acute inflammation
Transcriptional data may not accurately reflect protein level since translational and post-translational processing may occur. We thus further examined if protein levels corresponded to the changes in gene expression as shown by Western blot. Given that extensive studies indicate the reciprocal regulation between IL6 and SOCS3 due to SOCS3 binding the IL6 receptor subunit gp130, we next examined if their protein levels were secondary to the increased gene expression, again in the context of acute inflammation and drug treatments. Blotting and immunodetection were performed using protein from the same samples which were used in microarray analysis after RNA extraction. Protein expression of IL6 was significantly increased in the rofecoxib (one-way ANOVA, p < 0.001) and ibuprofen (one-way ANOVA, p < 0.05) treated post-surgery tissues as comparison with that in the placebo samples (Figure 4A). Protein expression of SOCS3 was also increased following the treatments of rofecoxib and ibuprofen in the post-surgery samples compared to the change in placebo samples. However, only the increase induced by rofecoxib reached significance (one-way ANOVA, p < 0.05, Figure 4B).
Figure 4.
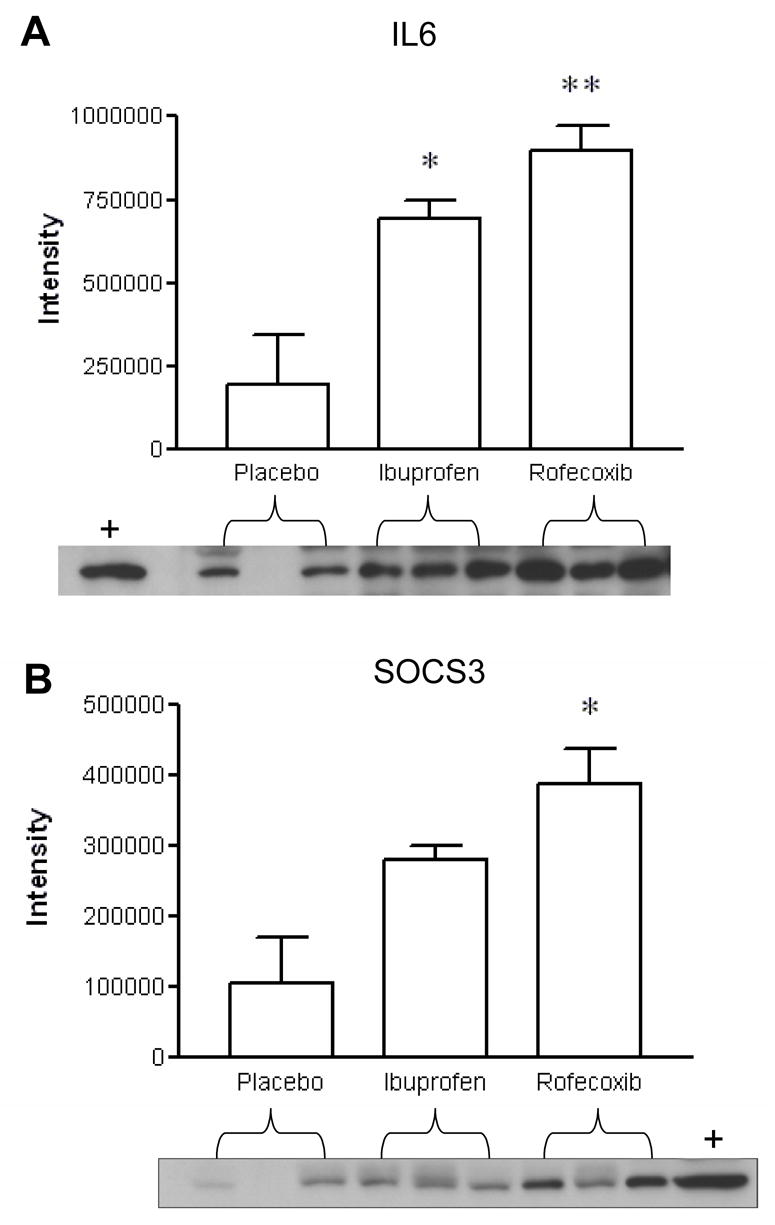
COX-2 inhibition increased the protein expression of IL6 and SOCS3 determined by immunoblot analysis. Representative western blots for specific IL6 and SOCS3 expression were from independent samples (n = 3 per treatment). Positive controls as marked (+) were determined using Hela and BJAB cell lysates for IL6 and SOCS3, respectively. Data are represented as mean ± SEM. *, p < 0.05 ANOVA followed by post hoc pairwise t-test.
4. DISCUSSION
This study investigated changes in gene expression induced by a selective inhibitor of COX-2 as compared with a non-selective COX-1/COX-2 inhibitor following acute clinical inflammation. Although tNSAIDs and coxibs are considered simply as inhibitors of COX-2 activity for the treatment of inflammation and pain, emerging evidence indicates that multiple COX-2-independent targets exist in the treatments by both tNSAIDs and coxibs. Our present findings provide supportive evidence from a clinical model of acute inflammation and pain that selective inhibition of COX-2 modulates multiple biological pathways, at least at the gene expression level, in addition to the direct inhibition of COX-2 activity.
4.1. Rofecoxib modulates the arachidonic acid pathway during inflammation
A novel finding in this study is that rofecoxib treatment enhanced the gene expression of ANXA1 and ANXA3 following acute inflammation. Annexins, a family of intracellular protein with calcium-dependent phospholipid binding properties, can affect many components of the inflammatory reaction by inhibition of phospholipase A2 and suppression of neutrophil and monocyte migration (Gerke and Moss, 2002; Tait et al., 1988; Wallner et al., 1986). Annexin-1 knockout animals exhibit an exaggerated inflammatory response, over-expression of PLA2 in some tissues, and resistance to dexamethasone treatment (Hannon et al., 2003). Arachidonic acid (AA) release, which is linked with the downstream COX and lipoxygenase pathways for eicosanoid biosynthesis, is tightly regulated by phospholipase A2 (PLA2) at the transcriptional and posttranslational level. PLA2 is a rate-limiting enzyme for the release of AA from membrane phospholipids in response to inflammation (Samad et al., 2002). Raised levels of PLA2 at inflamed sites play a crucial role in the propagation of inflammatory responses by amplification of the AA pathway (Touqui and Alaoui-El-Azher, 2001). Therefore, inhibiting or blocking PLA2 synthesis at transcriptional induction or post-translational modification is a potential target to control the development of inflammation. Our findings suggest that the rofecoxib-induced up-regulation of annexin expression may contribute to the molecular mechanisms underlying the anti-inflammatory and analgesic effects of coxibs by directly suppressing PLA2 activity at the gene expression level (Figure 5). Indeed, the over-expression of PLA2G2A (encoding secretory PLA2) induced by acute inflammation in the placebo group (31-fold) was partially diminished by rofecoxib treatment (11-fold) even though the difference between the placebo- and rofecoxib-treated group did not reached statistical significance in the present study.
Figure 5.
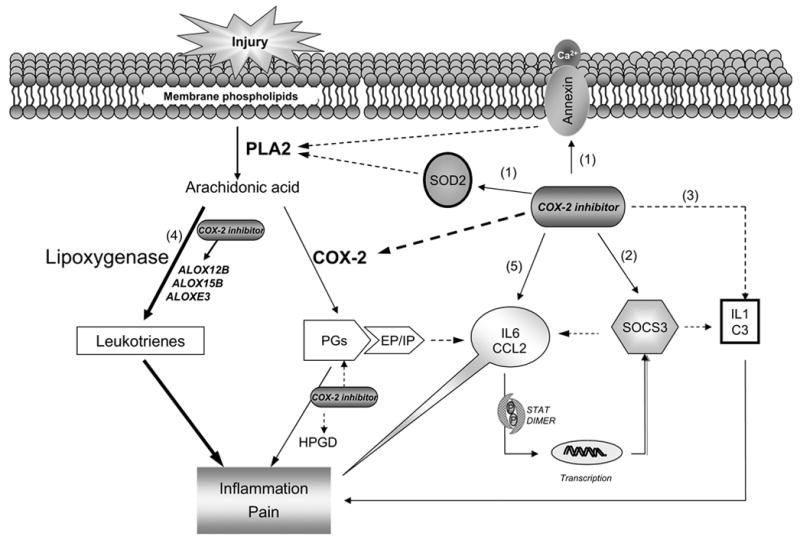
Inhibition of COX-2 modulates multiple functional pathways during acute inflammation and pain. Theoretical schematic diagram depicts the genes and their pathway modulated by rofecoxib treatment during acute inflammation. Besides inhibiting COX-2 activity, rofecoxib may also produce its anti-inflammatory effect through (1) up-regulating annexins and SOD2 expression, which directly suppress the activity of phospholipase A2; (2) up-regulating SOCS3, which inhibit cytokine signaling by negative feedback regulation of JAK/STAT cascade; (3) down-regulation of the gene expression IL1 and C3. However, by shunting down the cyclooxygenase pathway and reducing COX-2-derived PGs production, rofecoxib may induce the over-expression of the pro-inflammatory mediators (4) leukotrienes (indicated by the thicker solid lines), and (5) IL6 and CCL2 (MCP-1). The latter may play a critical role in the development of the adverse effects attributed to COX-2 inhibitors. The solid lines indicate facilitation and the dashed lines indicate inhibition.
Expression of SOD2 (encoding superoxide dismutase 2) was significantly up-regulated by the treatment of rofecoxib and ibuprofen following tissue injury in this clinical model. SOD2 is the most prominent and widely distributed form of the SOD family and plays a critical role in modulating the production of inflammatory mediators via its antioxidant defensive properties (White et al., 1991). High level of SOD2 inhibits the over-expression of PLA2 and downstream PGE2 production via the NF-κB-dependent pathway (Fakhrzadeh et al., 2004), and thereby abrogates the development of inflammation. The up-regulation of SOD2 following inhibition of COX-2 by the rofecoxib or ibuprofen treatment during acute inflammation in this study may also contribute to the anti-inflammatory and analgesic effects via affecting the activation of PLA2 in the AA pathway (Figure 5).
Previous studies have suggested that inhibition of cyclooxygenase can result in a shift of the AA metabolism to produce leukotrienes (LTs) via the lipoxygenase pathway (Brune, 2004). As a consequence of shunting down the cyclooxygenase pathway, the accumulation of AA and the products from lipoxygenase can induce up-regulation of pro-inflammatory cytokines at transcriptional and post-transcriptional levels through the NF-kB pathway (Bonizzi et al., 1999). The changes in gene expression related to lipoxygenase family members (ALOXE3, ALOX12B and ALOX15B) in this study may reflect compensatory reactions from the interruption of the cyclooxygenase pathway by inhibition of COX-2, which may be possibly affecting other inflammatory mediators as discussed below.
4.2. Rofecoxib modulates cytokine signaling pathway during inflammation
Production of SOCS3 (suppressor of cytokine signaling 3) is induced by IL6 and other proinflammatory cytokines and, subsequently, SOCS3 suppresses the transduction of cytokines through negative feedback regulation of the JAK/STAT pathway (Alexander and Hilton, 2004). Emerging evidence suggests that SOCS expression and activity is associated with inflammatory diseases (Alexander, 2002). For example, overexpression of SOCS3 has been observed in the joint tissue from patients with rheumatoid arthritis (Shouda et al., 2001). Given that increasing SOCS3 protein induced by gene therapy has been shown effectively to treat rheumatoid arthritis, manipulation of SOCS3 production has been predicted as a new approach for treatment of inflammatory diseases (Krause et al., 2002; Shouda et al., 2001). In this study, the over-expression of SOCS3, concomitant with IL6 expression at gene and protein levels in response to tissue injury is consistent with a recent report that SOCS mRNA and protein expression are generally present at low levels but are rapidly induced in response to most inflammatory cytokines (Ohishi et al., 2005).
IL6, a pleiotropic cytokine, possesses pro- and anti-inflammatory properties, such as inhibition of NF-κB and TNF-α release, and facilitation of SOCS3 and IL1 receptor antagonist expression. SOCS3 induced by IL6 negatively regulates IL6 signaling by binding the IL6 receptor subunit, gp 130 (Lang et al., 2003). The present finding of IL6 over-expression at gene and protein levels induced by COX-2 inhibition in the rofecoxib and ibuprofen groups provides in vivo support for a previous finding that selective inhibition of COX-2 stimulates IL6 expression in human whole blood cells and dental ligament cells in both in vitro and in vivo animal models (Hartel et al., 2004; Noguchi, et al., 2005; Sironi et al., 1992). The stimulatory effects of COX-2 inhibition on IL6 expression are attributed to the inhibitory action of COX-2-derived-PGE2 on IL6 synthesis (Hartel et al, 2004). Thus, the interesting possibilities for the over-expression of IL6 in the present study might result from (1) removal of the inhibition from COX-2-derived-PGE2 by rofecoxib-induced reduction of PGE2; (2) deviation of AA production after COX-2 blockage because both accumulation of AA and its oxidation by lipoxygenases can result in up-regulation of pro-inflammatory gene production through the NF-κB dependent pathway (Bonizzi et al., 1999). Additionally, IL6 also induces the expression of anti-inflammatory factor, IL1 receptor antagonist (Tilg, et al., 1994). Therefore, the novel finding in this study that SOCS3 expression at gene and protein levels was significantly up-regulated by inhibition of COX-2 following acute inflammation may result from the loss of the inhibitory effects of PGE2 on IL6, the latter stimulates the over-expression of SOCS3 to feedback negatively on regulation of inflammatory development (Figure 5). These findings suggest that the up-regulation of SOCS3 may define an important mechanism that contributes to the anti-inflammatory and analgesic potencies of rofecoxib by suppression of pro-inflammatory cytokine signaling during acute inflammation.
4.3. Rofecoxib modulates both pro- and anti-inflammatory mediators
The IL1 family is the most widely distributed pro-inflammatory cytokine and is implicated in a number of inflammatory diseases. IL1A and IL1B are identified as inducers of inflammation, while IL1RN, a specific endogenous receptor antagonist of IL1, serves as a natural compensating mechanism for the IL1-induced inflammation by competitively inhibiting the binding of IL1 to its receptor (Arend and Guthridge, 2000). Peripheral or central administration of IL1RN reduces brain damage induced by ischemia, and reverses the hyperalgesia and allodynia induced by IL1 and CX3CL1 (Johnston et al., 2004). We found that rofecoxib induced an up-regulation of IL1RN expression and ibuprofen induced a down-regulation of IL1A expression following tissue injury. It is known that metabolites of AA, prostaglandins and leukotrienes, are endogenous regulators of IL1 through the lipoxygenase and cyclooxygenase pathways. By reducing PGE2 product in the AA pathway, tNSAIDs or coxibs have been shown to increase the IL1 expression. Further, IL1RN expression is regulated by IL1 gene expression in normal healthy individuals (Hurme and Santtila, 1998). Therefore, our findings provide supportive evidence at the gene expression level that the increase in expression of IL1RN by rofecoxib or decrease in IL1A expression by ibuprofen may also be a molecular mechanism that contributes to the therapeutic efficacy of COX-2 inhibitors in clinical observations (Figure 5). Previous studies have reported that both CCL2 and IL6 are associated with the development of hyperalgesia (White et al., 2005; Xie et al., 2006). Our earlier studies have shown that neither rofecoxib nor ibuprofen have any effects on hyperalgesia at 24 and 48 hours post-surgery in the oral surgery model of tissue injury (unpublished data). The current finding of the up-regulation of IL6 and CCL2 following COX-2 inhibition may contribute to the failures of the treatments to attenuate hyperalgesia at 24–48 hours.
In summary, our findings demonstrate that selective inhibition of COX-2 during acute inflammation modulates gene expression of both pro-inflammatory and anti-inflammatory mediators, which supports a more complex role of COX-2 in the inflammatory cascade than previously suspected. Rofecoxib induced anti-inflammatory and analgesic effects act not merely through inhibition of COX-2 activity but also involve annexin and cytokine signaling pathways (Figure 5). Moreover, given the wide inter-individual variability in response to the treatment with tNSAIDs and coxibs in clinical observations (Lee et al., 2006; Fries et al., 2006), our findings suggest that besides the influence of genetic variability in cytokine gene polymorphisms, the counter-balance between pro-inflammatory and anti-inflammatory mediators induced by COX-2 inhibition may also play a critical role in their anti-inflammatory and analgesic effects as well as their adverse effects.
Acknowledgments
The authors gratefully acknowledge Albert Kingman from Biostatistics Core, NIDCR/NIH, for his expert and generous help with statistical data analysis. This work was supported by Division of Intramural Research, NINR and NIDCR/NIH.
Footnotes
Conflict of interest: The authors have no financial or other interest to disclose.
Publisher's Disclaimer: This is a PDF file of an unedited manuscript that has been accepted for publication. As a service to our customers we are providing this early version of the manuscript. The manuscript will undergo copyediting, typesetting, and review of the resulting proof before it is published in its final citable form. Please note that during the production process errors may be discovered which could affect the content, and all legal disclaimers that apply to the journal pertain.
References
- Alexander WS. Suppressors of cytokine signaling (SOCS) in the immune system. Nat Rev Immunol. 2002;2:410–16. doi: 10.1038/nri818. [DOI] [PubMed] [Google Scholar]
- Alexander WS, Hilton DJ. The role of suppressors of cytokine signaling (SOCS) proteins in regulation of the immune response. Annu Rev Immunol. 2004;22:503–29. doi: 10.1146/annurev.immunol.22.091003.090312. [DOI] [PubMed] [Google Scholar]
- Arend WP, Guthridge CJ. Biological role of interleukin 1 receptor antagonist isoforms. Ann Rheum Dis. 2000;59(Suppl 1):i60–64. doi: 10.1136/ard.59.suppl_1.i60. [DOI] [PMC free article] [PubMed] [Google Scholar]
- Ben-Av P, Crofford LJ, Wilder RL, Hla T. Induction of vascular endothelial growth factor expression in synovial fibroblasts by prostaglandin E and interleukin-1: a potential mechanism for inflammatory angiogenesis. FEBS Lett. 1995;372:83–7. doi: 10.1016/0014-5793(95)00956-a. [DOI] [PubMed] [Google Scholar]
- Bingham S, Beswick PJ, Bountra C, Brown T, Campbell IB, Chessell IP, Clayton N, Collins SD, Davey PT, Goodland H, Gray N, Haslam C, Hatcher JP, Hunter AJ, Lucas F, Murkitt G, Naylor A, Pickup E, Sargent B, Summerfield SG, Stevens A, Stratton SC, Wiseman J. The cyclooxygenase-2 inhibitor GW406381X [2-(4-ethoxyphenyl)-3-[4-(methylsulfonyl)phenyl]-pyrazolo[1,5-b]pyridazine] is effective in animal models of neuropathic pain and central sensitization. J Pharmacol Exp Ther. 2005;312:1161–9. doi: 10.1124/jpet.104.075267. [DOI] [PubMed] [Google Scholar]
- Bombardier C, Laine L, Reicin A, Shapiro D, Burgos-Vargas R, Davis B, Day R, Ferraz MB, Hawkey CJ, Hochberg MC, Kvien TK, Schnitzer TJ. Comparison of upper gastrointestinal toxicity of rofecoxib and naproxen in patients with rheumatoid arthritis. N Engl J Med. 2000;343:1520–28. doi: 10.1056/NEJM200011233432103. [DOI] [PubMed] [Google Scholar]
- Bonizzi G, Piette J, Schoonbroodt S, Greimers R, Havard L, Merville MP, Bours V. Reactive oxygen intermediate-dependent NF-kappaB activation by interleukin-1beta requires 5-lipoxygenase or NADPH oxidase activity. Mol Cell Biol. 1999;19:1950–60. doi: 10.1128/mcb.19.3.1950. [DOI] [PMC free article] [PubMed] [Google Scholar]
- Brune K. Safety of anti-inflammatory treatment--new ways of thinking. Rheumatology (Oxford) 2004;43 (Suppl ):i16–20. doi: 10.1093/rheumatology/keh104. [DOI] [PubMed] [Google Scholar]
- De Vry J, Kuhl E, Franken-Kunkel P, Eckel G. Pharmacological characterization of the chronic constriction injury model of neuropathic pain. Eur J Pharmacol. 2004;491:137–48. doi: 10.1016/j.ejphar.2004.03.051. [DOI] [PubMed] [Google Scholar]
- Ek M, Arias C, Sawchenko P, Ericsson-Dahlstrand A. Inflammatory response: pathway across the blood-brain barrier. Nature. 2001;410:430–31. doi: 10.1038/35068632. [DOI] [PubMed] [Google Scholar]
- Fakhrzadeh L, Laskin JD, Gardner CR, Laskin DL. Superoxide dismutase-overexpressing mice are resistant to ozone-induced tissue injury and increases in nitric oxide and tumor necrosis factor-alpha. Am J Respir Cell Mol Biol. 2004;30:280–7. doi: 10.1165/rcmb.2003-0044OC. [DOI] [PubMed] [Google Scholar]
- FitzGerald GA. COX-2 and beyond: approaches to prostaglandin inhibition in human disease. Nature Rev Drug Discov. 2003;2:879–90. doi: 10.1038/nrd1225. [DOI] [PubMed] [Google Scholar]
- Fries S, Grosser T, Price TS, Lawson JA, Kapoor S, DeMarco S, Pletcher MT, Wiltshire T, FitzGerald GA. Marked interindividual variability in the response to selective inhibitors of cyclooxygenase-2. Gastroenterology. 2006;130:55–64. doi: 10.1053/j.gastro.2005.10.002. [DOI] [PubMed] [Google Scholar]
- Fukunaga K, Kohli P, Bonnans C, Fredenburgh LE, Levy BD. Cyclooxygenase 2 plays a pivotal role in the resolution of acute lung injury. J Immunol. 2005;174:5033–39. doi: 10.4049/jimmunol.174.8.5033. [DOI] [PubMed] [Google Scholar]
- Futagami A, Ishizaki M, Fukuda Y, Kawana S, Yamanaka N. Wound healing involves induction of cyclooxygenase-2 expression in rat skin. Lab Invest. 2002;82:1503–13. doi: 10.1097/01.lab.0000035024.75914.39. [DOI] [PubMed] [Google Scholar]
- Gately S, Li WW. Multiple roles of COX-2 in tumor angiogenesis: A target for antiangiogenic therapy. Semin Oncol. 2004;31:2–11. doi: 10.1053/j.seminoncol.2004.03.040. [DOI] [PubMed] [Google Scholar]
- Gerke V, Moss SE. Annexins: from structure to function. Physiol Rev. 2002;82:331–71. doi: 10.1152/physrev.00030.2001. [DOI] [PubMed] [Google Scholar]
- Gilroy DW, Colville-Nash PR, Willis D, Chivers J, Paul-Clark MJ, Willoughby DA. Inducible cyclooxygenase may have anti-inflammatory properties. Nat Med. 1999;5:698–701. doi: 10.1038/9550. [DOI] [PubMed] [Google Scholar]
- Gilroy DW, Colville-Nash PR, McMaster S, Sawatzky DA, Willoughby DA, Lawrence T. Inducible cyclooxygenase-derived 15-deoxy(Delta)12-14PGJ2 brings about acute inflammatory resolution in rat pleurisy by inducing neutrophil and macrophage apoptosis. FASEB J. 2003;17:2269–71. doi: 10.1096/fj.02-1162fje. [DOI] [PubMed] [Google Scholar]
- Gordon SM, Brahim JS, Rowan J, Kent A, Dionne RA. Peripheral prostanoid levels and nonsteroidal anti-inflammatory drug analgesia: replicate clinical trials in a tissue injury model. Clin Pharmacol Ther. 2002;72:175–83. doi: 10.1067/mcp.2002.126501. [DOI] [PubMed] [Google Scholar]
- Grösch S, Maier TJ, Schiffmann S, Geisslinger G. Cyclooxygenase-2 (COX-2)-independent anticarcinogenic effects of selective COX-2 inhibitors. J Natl Cancer Inst. 2006;98:736–47. doi: 10.1093/jnci/djj206. [DOI] [PubMed] [Google Scholar]
- Hannon R, Croxtall JD, Getting SJ, Roviezzo F, Yona S, Paul-Clark MJ, Gavins FN, Perretti M, Morris JF, Buckingham JC, Flower RJ. Aberrant inflammation and resistance to glucocorticoids in annexin 1-/- mouse. FASEB J. 2003;17:253–55. doi: 10.1096/fj.02-0239fje. [DOI] [PubMed] [Google Scholar]
- Hartel C, von Puttkamer J, Gallner F, Strunk T, Schultz C. Dose-dependent immunomodulatory effects of acetylsalicylic acid and indomethacin in human whole blood: potential role of cyclooxygenase-2 inhibition. Scand J Immunol. 2004;60:412–20. doi: 10.1111/j.0300-9475.2004.01481.x. [DOI] [PubMed] [Google Scholar]
- Hurme M, Santtila S. IL-1 receptor antagonist (IL-1Ra) plasma levels are co-ordinately regulated by both IL-1Ra and IL-1beta genes. Eur J Immunol. 1998;28:2598–602. doi: 10.1002/(SICI)1521-4141(199808)28:08<2598::AID-IMMU2598>3.0.CO;2-K. [DOI] [PubMed] [Google Scholar]
- Johnston IN, Milligan ED, Wieseler-Fran J, Frank MG, Zapata V, Campisi J, Langer S, Martin D, Green P, Fleshner M, Leinwand L, Maier SF, Watkins LR. A role for proinflammatory cytokines and fractalkine in analgesia, tolerance, and subsequent pain facilitation induced by chronic intrathecal morphine. J Neurosci. 2004;24:7353–65. doi: 10.1523/JNEUROSCI.1850-04.2004. [DOI] [PMC free article] [PubMed] [Google Scholar]
- Kapoor M, Shaw O, Appleton I. Possible anti-inflammatory role of COX-2-derived prostaglandins: Implications for inflammation research. Curr Opin Investig Drugs. 2005;6:461–66. [PubMed] [Google Scholar]
- Khan AA, Brahim JS, Rowan JS, Dionne RA. In vivo selectivity of a selective cyclooxygenase 2 inhibitor in the oral surgery model. Clin Pharmacol Ther. 2002;72:44–9. doi: 10.1067/mcp.2002.125560. [DOI] [PubMed] [Google Scholar]
- Krause A, Scaletta N, Ji JD, Ivashkiv LB. Rheumatoid arthritis synoviocyte survival is dependent on Stat3. J Immunol. 2002;169:6610–16. doi: 10.4049/jimmunol.169.11.6610. [DOI] [PubMed] [Google Scholar]
- Lang R, Pauleau AL, Parganas E, Takahashi Y, Mages J, Ihle JN, Rutschman R, Murray PJ. SOCS3 regulates the plasticity of gp130 signaling. Nat Immunol. 2003;4:546–50. doi: 10.1038/ni932. [DOI] [PubMed] [Google Scholar]
- Lee YS, Kim H, Wu TX, Wang XM, Dionne RA. Genetically Mediated Inter-individual Variation in Analgesic Responses to COX Inhibitory Drugs. Clin Pharmacol Ther. 2006;79:407–18. doi: 10.1016/j.clpt.2006.01.013. [DOI] [PubMed] [Google Scholar]
- Maloney CG, Kutchera WA, Albertine KH, McIntyre TM, Prescott SM, Zimmerman GA. Inflammatory agonists induce cyclooxygenase type 2 expression by human neutrophils. J Immunol. 1998;160:1402–10. [PubMed] [Google Scholar]
- Morrison BW, Christensen S, Yuan W, Brown J, Amlani S, Seidenberg B. Analgesic efficacy of the cyclooxygenase-2-specific inhibitor rofecoxib in post-dental surgery pain: a randomized, controlled trial. Clin Ther. 1999;21:943–53. doi: 10.1016/S0149-2918(99)80016-2. [DOI] [PubMed] [Google Scholar]
- Noguchi K, Maeda M, Ruwanpura SM, Ishikawa I. Prostaglandin E2 (PGE2) downregulates interleukin (IL)-1alpha-induced IL-6 production via EP2/EP4 subtypes of PGE2 receptors in human periodontal ligament cells. Oral Dis. 2005;11:157–62. doi: 10.1111/j.1601-0825.2005.01059.x. [DOI] [PubMed] [Google Scholar]
- Ohishi M, Matsumura Y, Aki D, Mashima R, Taniguchi K, Kobayashi T, Kukita T, Iwamoto Y, Yoshimura A. Suppressors of cytokine signaling-1 and -3 regulate osteoclastogenesis in the presence of inflammatory cytokines. J Immunol. 2005;174:3024–31. doi: 10.4049/jimmunol.174.5.3024. [DOI] [PubMed] [Google Scholar]
- Pillinger MH, Marjanovic N, Kim SY, Scher JU, Izmirly P, Tolani S, Dinsell V, Lee YC, Blaser MJ, Abramson SB. Matrix metalloproteinase secretion by gastric epithelial cells is regulated by E prostaglandins and MAPKs. J Biol Chem. 2005;280:9973–79. doi: 10.1074/jbc.M413522200. [DOI] [PubMed] [Google Scholar]
- Samad TA, Sapirstein A, Woolf CJ. Prostanoids and pain: unraveling mechanisms and revealing therapeutic targets. Trends Mol Med. 2002;8:390–96. doi: 10.1016/s1471-4914(02)02383-3. [DOI] [PubMed] [Google Scholar]
- Shouda T, Yoshida T, Hanada T, Wakioka T, Oishi M, Miyoshi K, Komiya S, Kosai K, Hanakawa Y, Hashimoto K, Nagata K, Yoshimura A. Induction of the cytokine signal regulator SOCS3/CIS3 as a therapeutic strategy for treating inflammatory arthritis. J Clin Invest. 2001;108:1781–88. doi: 10.1172/JCI13568. [DOI] [PMC free article] [PubMed] [Google Scholar]
- Sironi M, Gadina M, Kankova M, Riganti F, Mantovani A, Zandalasini M, Ghezzi P. Differential sensitivity of in vivo TNF and IL-6 production to modulation by anti-inflammatory drugs in mice. Int J Immunopharmacol. 1992;14:1045–50. doi: 10.1016/0192-0561(92)90149-f. [DOI] [PubMed] [Google Scholar]
- Tait JF, Sakata M, McMullen BA, Miao CH, Funakoshi T, Hendrickson LE, Fujikawa K. Placental anticoagulant proteins: isolation and comparative characterization four members of the lipocortin family. Biochemistry. 1988;27:6268–76. doi: 10.1021/bi00417a011. [DOI] [PubMed] [Google Scholar]
- Tegeder I, Pfeilschifter J, Geisslinger G. Cyclooxygenase-independent actions of cyclooxygenase inhibitors. FASEB J. 2001;15:2057–72. doi: 10.1096/fj.01-0390rev. [DOI] [PubMed] [Google Scholar]
- Tilg H, Trehu E, Atkins MB, Dinarello CA, Mier JW. Interleukin-6 (IL-6) as an anti-inflammatory cytokine: induction of circulating IL-1 receptor antagonist and soluble tumor necrosis factor receptor p55. Blood. 1994;83:113–8. [PubMed] [Google Scholar]
- Touqui L, Alaoui-El-Azher M. Mammalian secreted phospholipases A2 and their pathophysiological significance in inflammatory diseases. Curr Mol Med. 2001;1:739–54. doi: 10.2174/1566524013363258. [DOI] [PubMed] [Google Scholar]
- Wallace JL, Devchand PR. Emerging roles for cyclooxygenase-2 in gastrointestinal mucosal defense. Br J Pharmacol. 2005;145:275–82. doi: 10.1038/sj.bjp.0706201. [DOI] [PMC free article] [PubMed] [Google Scholar]
- Wallner BP, Mattaliano RJ, Hession C, Cate RL, Tizard R, Sinclair LK, Foeller C, Chow EP, Browing JL, Ramachandran KL. Cloning and expression of human lipocortin, a phospholipase A2 inhibitor with potential anti-inflammatory activity. Nature. 1986;320:77–81. doi: 10.1038/320077a0. [DOI] [PubMed] [Google Scholar]
- Wang XM, Wu TX, Lee YS, Dionne RA. Rofecoxib regulates the expression of genes related to matrix metalloproteinase pathway in humans: implication for the adverse effects of COX-2 inhibitors. Clin Pharmacol Ther. 2006;79:303–15. doi: 10.1016/j.clpt.2005.12.306. [DOI] [PubMed] [Google Scholar]
- White CW, Avraham KB, Shanley PF, Groner Y. Transgenic mice with expression of elevated levels of copper-zinc superoxide dismutase in the lungs are resistant to pulmonary oxygen toxicity. J Clin Invest. 1991;87:2162–68. doi: 10.1172/JCI115249. [DOI] [PMC free article] [PubMed] [Google Scholar]
- White FA, Bhangoo SK, Miller RJ. Chemokines: integrators of pain and inflammation. Nat Rev Drug Discov. 2005;4:834–44. doi: 10.1038/nrd1852. [DOI] [PMC free article] [PubMed] [Google Scholar]
- Wong D, Wang M, Cheng Y, FitzGerald GA. Cardiovascular hazard and non-steroidal anti-inflammatory drugs. Curr Opin Pharmacol. 2005;5:204–10. doi: 10.1016/j.coph.2005.02.001. [DOI] [PubMed] [Google Scholar]
- Xie WR, Deng H, Li H, Bowen TL, Strong JA, Zhang JM. Robust increase of cutaneous sensitivity, cytokine production and sympathetic sprouting in rats with localized inflammatory irritation of the spinal ganglia. Neuroscience. 2006 Aug 1; doi: 10.1016/j.neuroscience.2006.06.045. [Epub ahead of print] [DOI] [PMC free article] [PubMed] [Google Scholar]