

Abstract
Background
Few studies document longitudinal changes in physical activity from pre-pregnancy to the postpartum period.
Methods
This study estimated change in self-reported leisure-time physical activity in 1442 women before pregnancy, during the second trimester, and at 6 months postpartum. In addition, it also examined predictors of becoming insufficiently active during or after pregnancy.
Results
The mean (SD) age was 32.5 (4.5) years, 34% of the women were overweight or obese pre-pregnancy (body mass index [BMI] ≥25 kg/m2), and 76% were white. Before pregnancy, the mean total leisure physical activity was 9.6 hours per week. The reported decrease in total activity between pre-pregnancy and 6 months postpartum was –1.4 (95% confidence interval [CI] = –1.0 to –1.9) hours/week, accounted for by decreases in moderate and vigorous physical activity but not walking. Prevalence of insufficiently active lifestyle (<150 min/week of total activity) increased from 12.6% before pregnancy to 21.7% during the postpartum period. The odds ratio (OR) for becoming insufficiently active during pregnancy was 1.58 (95% CI = 1.07–2.32) in women with at least one child compared with no children. Predictors of becoming insufficiently active postpartum included postpartum weight retention (OR =1.31; 95% CI =1.05–1.58 for each 5-kg increment); working longer hours in the first trimester (e.g., OR= 5.12; 95% CI =1.96–13.4 for 45+ vs 0 hours); and reporting that lack of child care was a barrier to physical activity (OR =1.73; 95% CI=0.99–3.02).
Conclusions
Women reported decreases in moderate and vigorous physical activity during pregnancy that persisted at 6 months postpartum. Levels of walking did not decline. Children in the home, longer work hours, and lack of child care were predictors of becoming insufficiently active during or after pregnancy.
INTRODUCTION
Physical activity during and following pregnancy may have beneficial effects on postpartum weight retention and related health outcomes.1–4 Few studies have been conducted on the longitudinal changes in physical activity from pre-pregnancy to the postpartum period. Although physical activity levels appear to decline during pregnancy, the magnitude and persistence of this decline during the postpartum period are unclear.5–8 Furthermore, the determinants of these changes in physical activity during and following pregnancy have not been identified.
Growing interest in the social ecologic framework as the basis for investigating determinants of physical activity centers on understanding individual, interpersonal, and environmental influences.9–13 During and after pregnancy, individual factors could include perceived lack of time and energy, physical health, and competing priorities; interpersonal factors could include availability of child care; and environmental factors could include availability of places to exercise.14 Several authors have underscored the paucity of evidence on influences on activity from well-designed, prospective studies11,15 and there is a particular lack of such data in the postpartum period, a potentially critical period for the development of obesity.16
The purpose of this analysis was to assess the magnitude of changes in physical activity during and after pregnancy, and to identify potential individual, social, and environmental factors that may predict changes in physical activity during and after pregnancy.
METHODS
Project Viva is a cohort study of pregnant women and their offspring enrolled in a multi-site group medical practice in the area surrounding Boston, Massachusetts, with the goal of examining the roles of prenatal factors in outcomes of pregnancy and infancy.17 This study included all eligible pregnant women in eight selected health centers, unrestricted by age or race. It excluded patients who did not obtain their initial prenatal visit within the first 22 weeks of gestation, those with multiple gestation (e.g., twins, triplets), and those who could not adequately complete interviews and questionnaires in English.
Among 2128 participants who delivered infants in Project Viva, 1680 completed the pre-pregnancy physical activity questions, 1623 completed the mid-pregnancy physical activity questions, and 1392 completed the 6 month postpartum physical activity questions. For this analysis, participants included 1442 women who completed both pre-pregnancy and mid-pregnancy physical activity assessments and 1242 women who completed both pre-pregnancy and 6 month postpartum physical activity assessments.
Baseline Data Collection, First Trimester
At the time of enrollment into Project Viva, a brief in-person interview was conducted and participants were received a series of questionnaires to be completed and mailed back to the study office. The baseline instruments queried height and pre-pregnancy weight, demographic information, socioeconomic position, medical and reproductive history, and social support. Details are available elsewhere.17 The physical activity/inactivity questionnaire was a modification of the leisure time activity section of the Physical Activity Scale for the Elderly (PASE).18 Modifications included the following: instead of using the previous 7 days as a referent time period, women were asked to average their weekly activity. At the enrollment visit in the first trimester, the time period covered was the 12 months prior to pregnancy, thus estimating pre-pregnancy physical activity. Women reported their average hours per week for walking (leisure time, not including walking at work), light to moderate, and vigorous physical activity. A single question was used to assess light and moderate activities, which did not ask about weight lifting or strength training, modifications that were thought appropriate for pregnancy and the postpartum period. Choices of examples of activities for light to moderate and vigorous physical activities were influenced by the PASE,18,19 the Paffenbarger physical activity questionnaire,19,20 and knowledge of activities common to women in the northeastern United States. A copy of the questionnaire is available on request. Total physical activity was defined as the sum of hours per week of walking, light to moderate, and vigorous physical activity. Insufficiently active lifestyle was defined as fewer than 150 minutes per week of total leisure-time physical activity.21 Women with an insufficiently active lifestyle before pregnancy were excluded from analyses examining the likelihood of insufficiently active lifestyle.
Mid-Pregnancy Data Collection
At 26–28 weeks’ gestation, each participant was asked to complete a second physical activity frequency questionnaire covering the previous 3 months (second trimester). The questionnaire also updated health habits and included a validated self-reported depression instrument.22
Six-Month Follow-Up Data
Data were collected in person for 1012 subjects and by telephone for an additional 230 subjects. The physical activity questionnaire at this point was similar to the intra-partum questionnaires; the time referent was “in the past month.” For the 91 (7%) of women who reported wishing to get more exercise, this study also investigated perceived barriers to physical activity in the postpartum period by asking the women to endorse the extent that each of a variety of individual, social, and environmental factors was a barrier. The response options included “not a barrier,” “a little,” and “a lot.” Weight at 6 months postpartum was also measured.
Gestational weight gain was computed as the difference between the final clinical prenatal weight and the self-reported pre-pregnancy weight. Gestational weight gain was then categorized into inadequate, adequate, and excessive based on the Institute of Medicine Guidelines: for pre-pregnancy BMI <19.8 kg/m2, 28–40 pounds; for 19.8 to 26.0 kg/m2, 25–35 pounds; for >26.0 kg/m2, 15–25 pounds. Six month postpartum weight retention was calculated as the difference between each woman’s measured weight at 6 months postpartum and her self-reported pre-pregnancy weight.
Statistical Analysis
Logistic regression was used to compute OR for becoming insufficiently active during and following pregnancy. Separate models were developed to predict the likelihood of an insufficiently active lifestyle over two time periods: (1) pre-pregnancy to the second trimester of pregnancy; and (2) pre-pregnancy to 6 months postpartum. In the first model, independent variables included age, race/ethnicity, pre-pregnancy body mass index (BMI), average self-reported hours of pre-pregnancy physical activity, depression during pregnancy, marital status, education, income, employment early in pregnancy, employment change during pregnancy, number of children in the home, and nausea and vomiting during pregnancy. The second model included these same independent variables, plus gestational weight gain category, postpartum weight retention, and perceived barriers to exercise in the postpartum period. Linear regression predicting change in light/moderate and of vigorous activity revealed similar findings (data not shown). All analyses were performed using SAS version 8.2 (SAS Institute, Cary, NC, 2001), and the final analysis was completed in 2005.
RESULTS
Table 1 includes the characteristics of the sample before, during, and after pregnancy. Most women were in their 30s, 34% were overweight or obese before pregnancy, and 24% were nonwhite. The relatively high educational level and household income are reflective of this health-insured population. Approximately 8%–9% of women were depressed during either time period. The percentage of women working ≥35 hours/wk was 60% during the second trimester and 30% at 6 months postpartum. Nearly two thirds of the sample reported insufficient time was a very important barrier to physical activity at 6 months postpartum.
Table 1.
Sample characteristics at enrollment (n =1442), during the second trimester (n =1442) and 6 months postpartum (n =1242); mean ± SD or percent of participants
| Mean (SD) | % of subjects | |
|---|---|---|
| Enrollment | ||
| Age (years) | 32.5 (4.5) | |
| Pre-pregnancy BMI (kg/m2) | 24.5 (5.2) | |
| <25 | 65.5 | |
| 25–29.9 | 21.3 | |
| ≥30 | 13.2 | |
| Race/ethnicity | ||
| Asian | 5.6 | |
| Black | 10.0 | |
| Hispanic | 4.9 | |
| White | 76.2 | |
| Other | 3.4 | |
| At least one child already living at home | 53.4 | |
| Married | 88.0 | |
| Education (college or graduate degree) | 73.0 | |
| Annual Household Income >$70,000 | 64.7 | |
| Second trimester | ||
| Working ≥35 hours / wk | 60.0 | |
| Nauseated ≥7 consecutive days | 45.9 | |
| Vomited >10 times | 17.4 | |
| Depressed (≥13 on 0–30 Edinburgh scale) | 8.7 | |
| Gestational weight gain based on IOM Guidelines | ||
| Inadequate | 14.6 | |
| Adequate | 32.7 | |
| Excessive | 52.7 | |
| Six months postpartum | ||
| Postpartum weight retention (kg) | 3.5 (5.0) | |
| Working ≥35 hours / wk | 30.2 | |
| Depressed (≥13 on 0–30 Edinburgh scale) | 8.4 | |
| Perceived barriersa to physical activity | ||
| Lack of time | 63.5 | |
| Spending time with children | 29.8 | |
| Lack of child care | 27.0 | |
| Lack of energy | 21.0 | |
| Lack of enjoyment | 7.1 | |
| No place to exercise | 2.2 | |
Percent reporting that the degree of the barrier was “a lot.”
BMI, body mass index; IOM, Institute of Medicine
The mean levels of physical activity by time period are shown in Figure 1, depicting a decrease during pregnancy from 9.6 to 6.9 hours per week and a partial rebound to 8.0 hours per week during the postpartum period. Although walking decreased slightly from pre-pregnancy to the second trimester (–0.4 hr/wk; 95% CI = –0.7 to –0.2), it rebounded at 6 months postpartum to the pre-pregnancy level. The failure of total activity in the postpartum period to return to pre-pregnancy levels was due to the sustained drop in light/moderate and vigorous intensity activities. Prevalence of insufficiently active lifestyle increased from 12.6% pre-pregnancy to 21.6% during pregnancy, and remained at 21.7% during the postpartum period. Participants reported no change in time spent watching television/videos (~ 11 hours per week at all time points).
Figure 1.
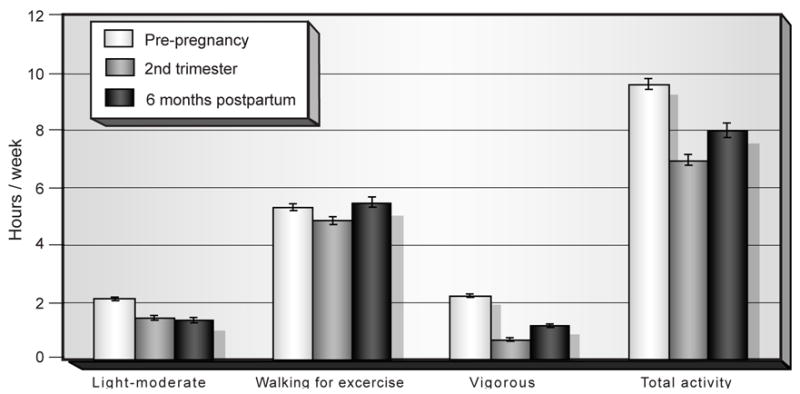
Mean (± SE) self-reported physical activity (hr/wk) before, during, and after pregnancy. Data are from participants in Project Viva*
*n =1442 pre-pregnancy; n =1442 2nd trimester; n =1242; 6-months postpartum
Predictors of becoming insufficiently active during pregnancy are shown in Table 2. Physical activity before pregnancy was inversely associated with the likelihood of insufficient leisure activity during pregnancy; each increment of 1 hour per week in total activity prior to pregnancy was associated with an OR of 0.86 (95% CI 0.83, 0.90) for becoming sedentary during pregnancy. The OR for becoming insufficiently active during pregnancy was 1.58 (95% CI= 1.07–2.32) in women with at least one child already in the home compared to women with no children yet in the home. Perhaps counter-intuitively, increased frequency of vomiting also appeared to be associated with lower risk of insufficiently active lifestyle.
Table 2.
Multivariable predictors of incidence of sedentary lifestyle from pre-pregnancy to second trimester of pregnancy (n =1191)a
| n (%) | OR | 95% CI | Trend p | ||
|---|---|---|---|---|---|
| Total pre-pregnancy physical activity | (1 hour/week) | 0.86 | 0.83–0.90 | ||
| Age | (1 year) | 1.00 | 0.96–1.04 | ||
| BMI before pregnancy | (1 kg/m2) | 1.03 | 0.99–1.06 | ||
| Depression (Edinburgh Scale) | <13 | 1065 (89.4) | Ref. | ||
| ≥13 | 102 (8.6) | 0.77 | 0.41–1.46 | ||
| Missing | 24 (2.0) | 0.72 | 0.20–2.58 | ||
| Race / ethnicity | White | 929 (78.0) | Ref. | ||
| Asian | 56 (4.7) | 1.79 | 0.86–3.74 | ||
| Black | 104 (8.7) | 1.34 | 0.71–2.51 | ||
| Hispanic | 62 (5.2) | 1.64 | 0.80–3.35 | ||
| Other | 40 (3.4) | 1.92 | 0.82–4.50 | ||
| Marital status | Married | 1052 (88.3) | Ref. | ||
| Cohabitate | 82 (6.9) | 1.02 | 0.51–2.07 | ||
| Divorced/separated/widowed | 22 (1.9) | 1.29 | 0.36–4.60 | ||
| Never married | 35 (2.9) | 1.31 | 0.43–4.04 | ||
| Education | ≤high school diploma | 76 (6.4) | 1.56 | 0.73–3.32 | 0.14 |
| Some college | 236 (19.8) | 1.48 | 0.88–2.48 | ||
| BA or BS | 460 (38.6) | 1.36 | 0.91–2.05 | ||
| Postgraduate degree | 419 (35.2) | Ref. | |||
| Annual household income ($U.S.) | ≤40,000 | 113 (9.5) | 1.30 | 0.68–2.50 | 0.52 |
| 40,001–70,000 | 268 (22.5) | 1.01 | 0.66–1.56 | ||
| Don't know | 27 (2.3) | 0.99 | 0.28–3.43 | ||
| >$70,000 | 783 (65.7) | Ref. | |||
| Employment in early pregnancy (hr/wk) | 0 | 163 (13.7) | Ref. | 0.10 | |
| 1–24 | 170 (14.3) | 0.71 | 0.35–1.44 | ||
| 25–34 | 107 (9.0) | 1.18 | 0.58–2.40 | ||
| 35–44 | 550 (46.2) | 1.27 | 0.73–2.21 | ||
| 45+ | 201 (16.9) | 1.31 | 0.66–2.63 | ||
| Employment change from early pregnancy to 2nd trimester | No change | 906 (76.1) | Ref. | ||
| Decrease | 179 (15.0) | 1.17 | 0.72–1.91 | ||
| Increase | 106 (8.9) | 0.94 | 0.49–1.81 | ||
| # Children in home before current pregnancy | 0 | 548 (46.0) | Ref. | 0.004 | |
| 1+ | 588 (49.4) | 1.58 | 1.07–2.32 | ||
| Missing | 55 (4.6) | 0.22 | 0.05–0.94 | ||
| Nauseatedb | Yes | 537 (45.1) | 1.25 | 0.86–1.81 | |
| No | 654 (54.9) | Ref. | |||
| Vomiting frequency | 0 | 621 (52.1) | Ref. | 0.03 | |
| 1–2 | 189 (15.9) | 1.04 | 0.65–1.68 | ||
| 3–10 | 174 (14.6) | 0.82 | 0.50–1.37 | ||
| 11–20 | 83 (7.0) | 0.59 | 0.28–1.27 | ||
| 20+ | 124 (10.4) | 0.55 | 0.28–1.07 |
Of 1442 participants, we excluded 181 who were sedentary pre-pregnancy and 70 with missing covariate data.
Nauseated for seven consecutive days during pregnancy
BMI, body mass index; CI, confidence interval; OR, odds ratio
Predictors of insufficient activity between pre-pregnancy and 6 months postpartum were also examined and results are shown in Table 3. As with insufficient activity during pregnancy, each weekly hour of pre-pregnancy activity was associated with an OR of 0.85 (95% CI =0.81– 0.90) for the likelihood of insufficient activity at 6 months postpartum. A direct association was observed between 6-month postpartum weight retention and the likelihood of insufficiently active lifestyle at 6 months postpartum. Each 5 kg of weight retained from pre-pregnancy to 6 months postpartum was associated with an OR of 1.31 (95% CI= 1.05–1.58) for becoming insufficiently active. Women with excessive versus adequate pregnancy weight gain had an OR of 0.44 (95% CI= 0.27– 0.72) for becoming insufficiently active by 6 months postpartum, meaning those who gained more were less likely to become insufficiently active. Each year of age was associated with an OR of 1.08 (95% CI= 1.02–1.14) for becoming insufficiently active. A strong direct association was observed between employment level in early pregnancy (hours per week) and likelihood of insufficient activity by 6 months postpartum. In comparison to women not working early in pregnancy, women working 35–44 hours per week had an OR of 3.25 (95% CI =1.46–7.21), and women working 45 or more hours per week had an OR of 5.12 (95% CI =1.96–13.37) for becoming insufficiently active by 6 months postpartum. In addition, women who decreased their level of employment between early pregnancy and 6 months postpartum had lower odds of becoming insufficiently active compared with women who did not change their level of employment (OR= 0.46 [95% CI= 0.28–0.76]). Women who reported that child care was a barrier to physical activity had an OR of 1.73 (95% CI= 0.99–3.02) for becoming insufficiently active by 6 months postpartum in comparison to women who reported that child care was not an important barrier.
Table 3.
Multivariable predictors of incidence of sedentary lifestyle from pre-pregnancy to 6months after pregnancy (n =794) a
| n (%) | OR | 95% CI | Trend p | ||
|---|---|---|---|---|---|
| Total pre-pregnancy physical activity | (1 hour/week) | 0.85 | 0.81–0.90 | ||
| Weight retention six months postpartum | (5 kg) | 1.31 | 1.05–1.58 | ||
| Pregnancy weight gain based on IOM Guidelines | Inadequate | 110 (13.9) | 1.14 | 0.59–2.21 | |
| Adequate | 291 (36.7) | Ref. | |||
| Excessive | 393 (49.5) | 0.44 | 0.27–0.72 | ||
| Depression in second trimester | <13 | 672 (84.6) | Ref. | ||
| ≥13 | 57 (7.2) | 1.06 | 0.48–2.33 | ||
| Missing | 65 (8.2) | 0.78 | 0.35–1.74 | ||
| Depression6 months postpartum | <13 | 721 (90.8) | Ref. | ||
| ≥13 | 66 (8.3) | 1.34 | 0.64–2.79 | ||
| Missing | 7 (0.9) | 1.43 | 0.22–9.49 | ||
| Age | (1 year) | 1.08 | 1.02–1.14 | ||
| BMI before pregnancy | (1 kg/m2) | 0.99 | 0.94–1.04 | ||
| Race / ethnicity | White | 618 (77.8) | Ref. | ||
| Asian | 37 (4.7) | 0.97 | 0.34–2.74 | ||
| Black | 67 (8.4) | 1.25 | 0.54–2.89 | ||
| Hispanic | 47 (5.9) | 1.57 | 0.66–3.72 | ||
| Other | 25 (3.2) | 1.35 | 0.39–4.63 | ||
| Marital status | Married | 702 (88.4) | Ref. | ||
| Cohabitate | 60 (7.6) | 0.97 | 0.40–2.36 | ||
| Divorced/separated/widowed | 11 (1.4) | 0.37 | 0.03–4.34 | ||
| Never married | 21 (2.6) | 1.13 | 0.26–4.95 | ||
| Education | ≤high school diploma | 35 (4.4) | 1.58 | 0.49–5.07 | 0.54 |
| Some college | 162 (20.4) | 1.14 | 0.61–2.16 | ||
| BA or BS | 298 (37.5) | 0.89 | 0.53–1.48 | ||
| Postgraduate degree | 299 (37.7) | Ref. | |||
| Annual household income (annual $U.S.) | Don't know | 14 (1.8) | 0.57 | 0.06–5.21 | 0.91 |
| ≤40,000 | 81 (10.2) | 0.77 | 0.31–1.91 | ||
| 40,001–70,000 | 170 (21.4) | 1.24 | 0.72–2.16 | ||
| >$70,000 | 529 (66.6) | Ref. | |||
| Employment in early pregnancy (hr/wk) | 0 | 110 (13.9) | Ref. | 0.002 | |
| 1–24 | 109 (13.7) | 1.74 | 0.72–4.24 | ||
| 25–34 | 73 (9.2) | 2.01 | 0.72–5.64 | ||
| 35–44 | 367 (46.2) | 3.25 | 1.46–7.21 | ||
| 45+ | 135 (17.0) | 5.12 | 1.96–13.37 | ||
| Employment change from early pregnancy to six months postpartum | No change | 334 (42.1) | Ref. | ||
| Decrease | 421 (53.0) | 0.46 | 0.28–0.76 | ||
| Increase | 39 (4.9) | 2.01 | 0.80–5.09 | ||
| # Children in home | 0 | 366 (46.1) | Ref. | ||
| 1+ | 389 (49.0) | 1.30 | 0.79–2.13 | ||
| Missing | 39 (4.9) | 0.68 | 0.21–2.23 | ||
| Nauseatedb | No | 404 (50.9) | Ref. | ||
| Yes | 390 (49.1) | 1.14 | 0.72–1.81 | ||
| Vomiting frequency | 0 | 395 (49.8) | Ref. | 0.11 | |
| 1–2 | 129 (16.3) | 0.71 | 0.38–1.32 | ||
| 3–10 | 124 (15.6) | 0.74 | 0.40–1.36 | ||
| 11–20 | 57 (7.2) | 0.63 | 0.25–1.57 | ||
| 20+ | 89 (11.2) | 0.51 | 0.22–1.20 | ||
| Exercise barriers | |||||
| Lack of time | Not | 39 (4.9) | Ref. | 0.72 | |
| A little | 200 (25.2) | 0.95 | 0.29–3.11 | ||
| A lot | 503 (63.4) | 1.03 | 0.33–3.25 | ||
| Does not want more exercise | 52 (6.6) | ||||
| Spending time with children | Not | 144 (18.1) | Ref. | 0.96 | |
| A little | 380 (47.9) | 1.08 | 0.60–1.95 | ||
| A lot | 218 (27.5) | 0.97 | 0.50–1.89 | ||
| Does not want more exercise | 52 (6.6) | ||||
| Lack of child care | Not | 294 (37.0) | Ref. | 0.10 | |
| A little | 232 (29.2) | 1.15 | 0.68–1.97 | ||
| A lot | 216 (27.2) | 1.73 | 0.99–3.02 | ||
| Does not want more exercise | 52 (6.6) | ||||
Of 1242 participants, we excluded 153 who were sedentary pre-pregnancy and 295 with missing covariate data.
Nauseated for seven consecutive days during pregnancy
BMI, body mass index; CI, confidence interval; IOM, Institute of Medicine; OR, odds ratio
DISCUSSION
Declines were observed in total physical activity during pregnancy that persisted to some degree at 6 months postpartum. Self-reported total physical activity declined, on average, by 2.7 hours per week during pregnancy, and remained 1.4 hours per week below pre-pregnancy levels at 6 months postpartum. An exception to this pattern was time spent walking, as walking at 6 months postpartum was similar to that reported for the pre-pregnancy period. The decline in physical activity during pregnancy was accompanied by a nearly doubling in the prevalence of insufficiently active lifestyle, from 12.6% during pre-pregnancy to 21.6% during the second trimester, which remained nearly unchanged at 21.7% at 6 months postpartum. These reductions in activity are of particular concern since they were associated with increased body weight retention during the first 6 months of the postpartum period. Such adverse physical activity profiles after giving birth may lead to long-term sequelae of weight retention, such as risk for diabetes and cardiovascular disease.
Few studies have measured the magnitude of physical activity change during and following pregnancy. Similar to the above findings, Schauberger et al.5 reported declines in leisure-time physical activities during pregnancy in 745 women, with some resumption of physical activities after pregnancy. However, the authors did not provide details of the activity assessment method or describe the magnitude of the association. In the CARDIA Study, Smith et al.23 reported larger decreases in physical activity over a 5-year period for primiparous women in comparison with nulliparous or multiparous women (among white participants), suggesting that decreasing physical activity in response to the first pregnancy may be of particular concern and that, consistent with the current findings, the decrease may persist during the postpartum period and beyond. No association was observed between race/ethnicity and likelihood of insufficient activity during or after pregnancy, but small cell sizes limited the study’s capability to detect modest differences.
A Swedish study8 that measured physical activity during and after pregnancy appeared to support the hypothesis that activity habits may be most affected by the first pregnancy. The present study, however, observed higher likelihood of insufficient activity among those women who had at least one child in the home, suggesting that the first child did not have the greatest impact on physical activity change.
In the present study, women who reported that child care was a barrier to physical activity were 1.7 times more likely to become insufficiently active than women who reported child care was not an important barrier. Availability of child care can influence the amount of personal time a parent has, including for exercise. Also, although employment level in early pregnancy did not predict the likelihood of insufficient activity during pregnancy, hours of employment in early pregnancy did have a strong, direct, dose–response association with the likelihood of insufficient activity from pre-pregnancy to 6 months postpartum. Women working 45+ hours per week during early pregnancy had 5 times the odds of becoming insufficiently active by 6 months postpartum than women not working in early pregnancy, and decreasing work hours from early pregnancy to 6 months postpartum was associated with about half the odds of becoming insufficiently active compared with women who did not change their level of employment. Taken as a whole, these findings depict a scenario of time restraints on the capacity of pregnant and postpartum women to fit regular exercise into their routine. Women who already have children in the home, who work full-time, and who do not decrease their work hours during or after pregnancy appear to be at highest risk for becoming insufficiently active during and following pregnancy.
Some, but not all, previous studies of determinants of substantial postpartum weight retention were consistent with the current study’s findings. Wolfe et al.6 observed a higher probability of gaining more than 25 pounds over 10 years in NHEFS I women with an increase in parity of two or more and, surprisingly, with a high level of nonrecreational physical activity at baseline. Such unanticipated findings may have been due to unrecognized confounding factors related to nonrecreational physical activity. In addition, that observation was not apparent for recreational physical activity, which is more closely related to Project Viva leisure-time physical activity assessment. Like the Viva study population, Swedish women with substantial postpartum weight retention (> 5 kg at 12 months postpartum) were less likely to engage in leisure time physical activity and reported more sedentary habits in both pregnancy and the postpartum period in comparison with women with less weight retention.25 The authors hypothesized that changes in activity patterns in the postpartum period were a direct consequence of the new family member.8 In another study,7 a summary estimate of physical activity type, duration, and intensity during the prenatal period, recalled at 7–12 months postpartum, showed the expected inverse association with postpartum weight retention in black low-income women, but a positive association among white low-income women. The authors suggested that a recall bias in self-reported activity (i.e., over-reported activity levels by overweight women) may have explained the unexpected findings in whites. The current study did not find such racial/ethnic differences. Finally, Schauberger et al.5 found no association between self-reported leisure-time physical activities, or the resumption of physical activities after pregnancy, and postpartum weight retention in 745 women from Wisconsin. However, the authors did not provide details of the activity assessment method or describe the magnitude of the association.
A unique aspect of the current study is that women were followed over time, through pregnancy and into the postpartum period. This study also ascertained changes in physical activity and many medical (e.g., depression, nausea), social (work habits), and environmental (e.g., perceived barriers to activity) variables that may influence physical activity changes during and after pregnancy. Although most data were collected prospectively, one limitation of the study was retrospective assessment of pre-pregnancy physical activity and weight. In addition, the relatively high socioeconomic status of the sample may limit the generalizability, and the postpartum follow-up was limited to 6 months.
In summary, large declines in physical activity during pregnancy were noted, with only partial return of activity levels during the postpartum period. These declines of activity may predict long-term future risk of obesity, diabetes, cardiovascular disease, and other maladies. Several factors related to time available to exercise predicted the likelihood of insufficient activity, including employment, number of children in the home, and child care barriers. The challenge raised by the findings of this study is to formulate strategies to maintain overall physical activity levels in women who are faced with these and other barriers during pregnancy and the postpartum period. In the current study, the decrease in walking activity from pre-pregnancy to pregnancy was followed by an increase in walking activity from pregnancy to 6 months postpartum such that, on average, the women appeared to be walking as much at 6 months postpartum as they were before pregnancy. Walking is popular, practical – it can be most easily worked into the daily routine (e.g., pushing child in stroller) – and efficacious in reducing disease risks.26, 27 Thus, walking appears to be a relevant targeted activity for interventions during and following pregnancy.
Acknowledgments
This study was supported by grants from the U.S. National Institutes of Health (HD 34568, HL 64925, HL 68041) and by Harvard Medical School and the Harvard Pilgrim Health Care Foundation.
No financial conflict of interest was reported by the authors of this paper.
Footnotes
Publisher's Disclaimer: This is a PDF file of an unedited manuscript that has been accepted for publication. As a service to our customers we are providing this early version of the manuscript. The manuscript will undergo copyediting, typesetting, and review of the resulting proof before it is published in its final citable form. Please note that during the production process errors may be discovered which could affect the content, and all legal disclaimers that apply to the journal pertain.
References
- 1.Clapp JF, III, Little KD. Effect of recreational exercise on pregnancy weight gain and subcutaneous fat deposition. Med Sci Sports Exerc. 1995;27:170–177. [PubMed] [Google Scholar]
- 2.Clapp JFI. Effect of dietary carbohydrate on the glucose and insulin response to mixed caloric intake and exercise in both nonpregnant and pregnant women. Diab Care. 1998;21 (Suppl 2):B107–B112. [PubMed] [Google Scholar]
- 3.Horns PN, Ratcliffe LP, Legget JC, Swanson MS. Pregnancy outcomes among active and sedentary primiparous women. J Obstet Gynecol Neonatal Nurs. 1996;25:49–54. doi: 10.1111/j.1552-6909.1996.tb02512.x. [DOI] [PubMed] [Google Scholar]
- 4.Sampselle CM, Seng J, Yeo S, Killion C, Oakley D. Physical activity and postpartum well-being. J Obstet Gynecol Neonatal Nurs. 1999;28:41–49. doi: 10.1111/j.1552-6909.1999.tb01963.x. [DOI] [PubMed] [Google Scholar]
- 5.Schauberger CW, Rooney BL, Brimer LM. Factors that influence weight loss in the puerperium. Obstet Gynecol. 1992;79:424–429. doi: 10.1097/00006250-199203000-00020. [DOI] [PubMed] [Google Scholar]
- 6.Wolfe WS, Sobal J, Olson CM, Frongillo EA, Williamson DF. Parity-associated weight gain and its modification by sociodemographic and behavioral factors: a prospective analysis in U.S. women. Int J Obes Relat Metab Disord. 1997;21:802–810. doi: 10.1038/sj.ijo.0800478. [DOI] [PubMed] [Google Scholar]
- 7.Boardley DJ, Sargent RG, Coker AL, Hussey JR, Sharpe PA. The relationship between diet, activity and other factors, and postpartum weight change by race. Obstet Gynecol. 1995;86:834–838. doi: 10.1016/0029-7844(95)00283-W. [DOI] [PubMed] [Google Scholar]
- 8.Rossner S, Ohlin A. Pregnancy as a risk factor for obesity: lessons from the Stockholm Pregnancy and Weight Development Study. Obes Res. 1995;3:267s–275s. doi: 10.1002/j.1550-8528.1995.tb00473.x. [DOI] [PubMed] [Google Scholar]
- 9.McLeroy KR, Bibeau D, Steckler A, Glanz K. An ecological perspective on health promotion programs. Health Educ Q. 1998;15:351–377. doi: 10.1177/109019818801500401. [DOI] [PubMed] [Google Scholar]
- 10.Eyler AE, Wilcox S, Matson-Koffman D, Evenson KR, Sanderson B, Thompson J, et al. Correlates of physical activity among women from diverse racial/ethnic groups. J Women’s Health Gend Based Med. 2002;11:239–253. doi: 10.1089/152460902753668448. [DOI] [PubMed] [Google Scholar]
- 11.Humpel N, Owen N, Leslie E. Environmental factors associated with adults' participation in physical activity. Am J Prev Med. 2002;22:188–199. doi: 10.1016/s0749-3797(01)00426-3. [DOI] [PubMed] [Google Scholar]
- 12.Walcott-McQuigg JA, Zerwic JJ, Dan A, Kelley MA. An ecological approach to physical activity in African American women. Medscape Women’s Health. 2001;6:3. [PubMed] [Google Scholar]
- 13.King AC, Castro C, Wilcox S, Eyler AE, Sallis JF, Brownson RC. Personal and environmental factors associated with physical inactivity among different racial–ethnic groups of U.S. middle-aged and older-aged women. Health Psychol. 2000;19:354–364. doi: 10.1037//0278-6133.19.4.354. [DOI] [PubMed] [Google Scholar]
- 14.Stahl T, Rutten A, Nutbeam D, Bauman A, Kannas L, Abel T, Luschen G, Rodriguez DJ, Vinck J, van der Zee J. The importance of the social environment for physically active lifestyle—results from an international study. Soc Sci Med. 2001;52:1–10. doi: 10.1016/s0277-9536(00)00116-7. [DOI] [PubMed] [Google Scholar]
- 15.Sallis JF, Kraft K, Linton LS. How the environment shapes physical activity: Atransdisciplinary research agenda. Am J Prev Med. 2002;22:208. doi: 10.1016/s0749-3797(01)00435-4. [DOI] [PubMed] [Google Scholar]
- 16.Gunderson EP, Abrams B. Epidemiology of gestational weight gain and body weightchanges after pregnancy. Epidemiologic Reviews. 2000;22:261–274. doi: 10.1093/oxfordjournals.epirev.a018038. [DOI] [PubMed] [Google Scholar]
- 17.Gillman MW, Rich-Edwards JW, Rifas-Shiman SL, Lieberman ES, Kleinman KP, Lipshultz SE. Maternal age and other predictors of newborn blood pressure. J Pediatr. 2004;144:240–5. doi: 10.1016/j.jpeds.2003.10.064. [DOI] [PubMed] [Google Scholar]
- 18.Washburn RA, Smith KW, Jette AM, Janney CA. The physical activity scale for the elderly (PASE): development and evaluation. J Clin Epidemiol. 1993;46:153–162. doi: 10.1016/0895-4356(93)90053-4. [DOI] [PubMed] [Google Scholar]
- 19.Pereira MA, FitzGerald SJ, Gregg EW, Joswiak ML, Ryan WJ, Suminski RR, Utter AC, Zmuda JM. A Collection of Physical Activity Questionnaires for Health-Related Research. In: Kriska AM, Caspersen CJ, editors. Medicine and Science in Sports and Exercise. Vol. 29. 1997. pp. S1–S205. [PubMed] [Google Scholar]
- 20.Paffenbarger RS, Wing AL, Hyde RT. Physical activity as an index of heart attack risk in college alumni. Am J Epidemiol. 1978;108:161–175. doi: 10.1093/oxfordjournals.aje.a112608. [DOI] [PubMed] [Google Scholar]
- 21.USDHHS. Physical Activity and Health: A Report of the Surgeon General. Atlanta, GA: U.S. Department of Health and Human Services, Centers for Disease Control and Prevention, National Center for Chronic Disease Prevention and Health Promotion; 1996. [Google Scholar]
- 22.Cox JL, Holden JM, Sagovsky R. Detection of postnatal depression. Br J Psychiatry. 1987 doi: 10.1192/bjp.150.6.782. [DOI] [PubMed] [Google Scholar]
- 23.Smith DE, Lewis CE, Caveny JL, Perkins LL, Burke GL, Bild DE. Longitudinal changes in adiposity associated with pregnancy. The CARDIA Study. JAMA. 1994;271:1747–1751. [PubMed] [Google Scholar]
- 24.Willett WC, Dietx WH, Colditz GA. Guidelines for healthy weight. New Engl J Med. 1999;341:427–34. doi: 10.1056/NEJM199908053410607. [DOI] [PubMed] [Google Scholar]
- 25.Ohlin A, Rossner S. Trends in eating patterns, physical activity, and SES factors in relation to postpartum body weight loss. Br J Nutr. 1994;71:457–470. doi: 10.1079/bjn19940155. [DOI] [PubMed] [Google Scholar]
- 26.Pereira MA, Kriska AM, Day RD, Cauley JA, LaPorte RE, Kuller LH. A randomized walking trial in postmenopausal women: Effects on physical activity and health 10 years later. Arch Intern Med. 1998;158:1695–1701. doi: 10.1001/archinte.158.15.1695. [DOI] [PubMed] [Google Scholar]