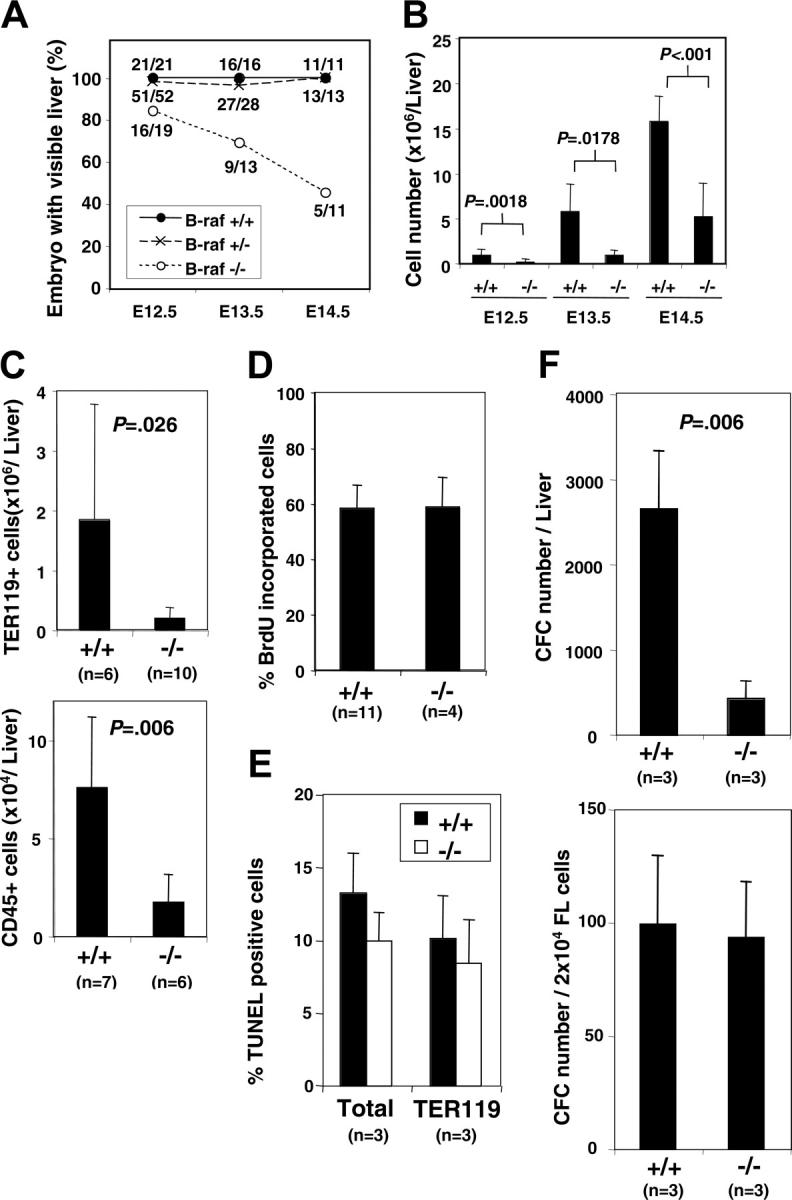
Figure 1.

Fetal liver hematopoiesis in the absence of B-Raf. (A) The percentage of embryos with identifiable livers at gestation days E12.5, E13.5, and E14.5 is graphed for each indicated B-Raf genotype. The total number of embryos (denominator) and the number with identifiable livers (numerator) are indicated for each day. (B) The number of viable (trypan blue exclusion) fetal liver cells is presented for wild-type (+/+) and B-raf–/– (–/–) fetuses with a visible liver on gestation days E12.5, E13.5, and E14.5. (C) The number of TER119-positive (top) and CD45+ (bottom) cells identified by fluorescence-activated cell sorter (FACS) analysis is indicated for wild-type (+/+) and B-raf–/– (–/–) E12.5 fetal liver. (D) The percentage of freshly harvested E12.5 wild-type (+/+) and B-raf–/– (–/–) fetal liver cells incorporating BrdU is presented. Cells were incubated in IMDM media containing 10% FCS, 2 U/mL rhEPO, and 10 μM BrdU for one hour prior to detection of BrdU incorporation. (E) The percentage of TUNEL-positive cells determined by FACS analysis is reported for freshly harvested E12.5 total fetal liver cells (left), and for the predominant hematopoietic cell population, TER 119–positive cells (right). Differences are not statistically significantly different. (F) Methylcellulose colony-forming assays performed on freshly harvested E12.5 wild-type (+/+) and B-raf–/– (–/–) fetal liver cells. The total number of myeloid progenitors per fetal liver (FL) (top) and per 2 × 10⁴ cells (bottom) is presented for wild-type (+/+) and B-raf–/– (–/–) cells. The data in panels B to F represent the average ± SD for the indicated number (n) of samples. B-raf–/– embryos without detectable livers are not included in the analyses in panels B to F. CFC indicates colony-forming cells.
