

Abstract
Children with Down syndrome (DS) with acute megakaryocytic leukemia (AMkL) have very high survival rates compared with non-DS AMkL patients. Somatic mutations identified in the X-linked transcription factor gene, GATA1, in essentially all DS AMkL cases result in the synthesis of a shorter (40 kDa) protein (GATA1s) with altered transactivation activity and may lead to altered expression of GATA1 target genes. Using the Affymetrix U133A microarray chip, we identified 551 differentially expressed genes between DS and non-DS AMkL samples. Transcripts for the bone marrow stromal-cell antigen 2 (BST2) gene, encoding a transmembrane glycoprotein potentially involved in interactions between leukemia cells and bone marrow stromal cells, were 7.3-fold higher (validated by real-time polymerase chain reaction) in the non-DS compared with the DS group. Additional studies confirmed GATA1 protein binding and transactivation of the BST2 promoter; however, stimulation of BST2 promoter activity by GATA1s was substantially reduced compared with the full-length GATA1. CMK sublines, transfected with the BST2 cDNA and incubated with HS-5 bone marrow stromal cells, exhibited up to 1.7-fold reduced cytosine arabinoside (ara-C)-induced apoptosis, compared with mock-transfected cells. Our results demonstrate that genes that account for differences in survival between DS and non-DS AMkL cases may be identified by microarray analysis and that differential gene expression may reflect relative transactivation capacities of the GATA1s and full-length GATA1 proteins.
Introduction
Children with Down syndrome (DS) and children without DS (non-DS) with acute megakaryocytic leukemia (AMkL) treated with cytosine arabinoside (ara-C)/anthracycline-based protocols have extremely different treatment outcomes. DS children routinely experience event-free survival (EFS) rates of 80% to 100%,1 whereas non-DS children have extremely low EFS rates. In contrast, in a series of pediatric patients treated at St Jude Children's Research Hospital, the EFS rate of de novo non-DS AMkL patients treated with chemotherapy alone was 0%, whereas the EFS rate for non-DS AMkL patients on the Children's Cancer Group (CCG) CCG-2861/2891 protocols was 21%, significantly lower than for the DS acute myeloid leukemia (AML) group overall.2,3 These results highlight distinct biologic differences between DS and non-DS AMkL cases.
AMkL in DS children has several unique characteristics. For instance, (1) AMkL has been estimated to occur at a 500-fold increased incidence in DS compared with non-DS children.4 (2) AMkL is the most common French-American-British (FAB) subtype of DS AML cases, as reported in past studies from the Pediatric Oncology Group (POG), CCG, the Berlin-Frankfurt-Münster (BFM), Nordic Society of Pediatric Hematology and Oncology (NOPHO), Toronto, and Japan groups.3-10 (3) Somatic mutations in exon 2 of the X-linked gene, GATA1, which encodes a zinc-finger transcription factor that is essential for normal erythroid and megakaryocytic differentiation, have been detected exclusively and almost uniformly in DS AMkL cases, but not in non-DS AML or non-AMkL DS leukemia cases except for a single case.11-15 This is the most specific abnormality other than trisomy 21 linked exclusively to DS AMkL.
Our recent studies have begun to identify factors that contribute to the significantly higher EFS rates of DS AML patients. DS blast cells generated significantly higher levels of the active intracellular ara-C metabolite, ara-CTP, following in vitro incubations with 3H-ara-C and were 4.5-fold more sensitive to ara-C, compared with a large sample of non-DS leukemia cells.16 This is reflected in altered expression of genes encoding the ara-C-metabolizing enzymes, cytidine deaminase (CDA; catalyzes the deamination of ara-C to the inactive metabolite ara-U) and deoxycytidine kinase (dCK; catalyzes the rate-limiting phosphorylation of ara-C to its active metabolite, ara-CTP) in DS AML cells.17,18 Interestingly, DS blast cells were also more sensitive (∼12-fold) to daunorubicin than were non-DS leukemia cells.16 In all these studies, the DS AML samples were of the AMkL phenotype, suggesting a possible relationship between the AMkL phenotype and increased drug sensitivity. Importantly, the uniform detection of GATA1 mutations in DS AMkL cases raises the possibility that GATA1 mutations in DS AMkL blasts in themselves may result in differential regulation of target genes (eg, CDA) that contribute to their extremely high EFS rates.18
In this report, we examined patterns of differential gene expression between DS and non-DS AMkL cases using microarray technology to identify biologic differences that may account for the extremely high EFS rates of DS AMkL patients and low EFS rates of non-DS patients. Additional results are presented that examine the function of the differentially expressed bone marrow stromal-cell antigen 2 (BST2) gene, including its regulation by GATA1, and its relationship to chemotherapy sensitivity.
Materials and methods
Clinical samples
Megakaryoblasts from DS and non-DS children diagnosed with AMkL were obtained from the Children's Hospital of Michigan leukemia cell bank and from the POG 9421 study, as previously described.19 The diagnosis of AMkL was confirmed by flow cytometry detection of the megakaryocytic antigens CD41 and CD61. Mononuclear cells were isolated on Ficoll-Hypaque gradients to obtain highly purified mononuclear-cell fractions consisting mostly of leukemic blasts. Total RNAs were extracted from the samples using TRIzol reagent (Life Technologies, Bethesda, MD). Informed consent was provided according to the Declaration of Helsinki. The research protocol was approved by the Human Investigation Committee of Wayne State University School of Medicine.
Cell culture
The DS AMkL cell line, CMK, was obtained from the German Collection of Microorganisms and Cell Cultures (Braunschweig, Germany), and the DS AMkL cell line, CMY (established from a 21-month-old DS boy with AMkL), and the non-DS AMkL cell line, CMS, were gifts from Dr A. Fuse (National Institute of Infectious Diseases, Tokyo, Japan). The non-DS AMkL cell line, Meg-01, and the HS-5 bone marrow stromal cell line were obtained from the American Type Culture Collection (Manassas, VA). The DS and non-DS AMkL cell lines and the HS-5 bone marrow stromal cell line were cultured in RPMI 1640 with 10% fetal bovine serum and antibiotics, as previously described.20 The megakaryocytic phenotypes of the CMK, CMY, CMS, and Meg-01 cell lines were confirmed by flow cytometric analysis. Drosophila Mel-2 (D Mel-2) cells were purchased from Invitrogen (Carlsbad, CA) and maintained in Schneider insect medium supplemented with 10% fetal bovine serum and 2 mM l-glutamine plus 100 U/mL penicillin and 100 μg/mL streptomycin at 28°C.
MTT drug sensitivity assay
In vitro ara-C and daunorubicin sensitivities of the clinical samples were measured by the 3-[4,5-dimethyl-thiazol-2-yl]-2,5-diphenyltetrazolium-bromide (MTT) assay, as previously described.19
Microarray analysis
cRNA synthesis and labeling. First- and second-strand cDNAs were synthesized from 5 to 15 μg total RNA using the SuperScript Double-Stranded cDNA Synthesis Kit (Life Technologies) and an oligo-dT24-T7 (5′-ggccagtgaattgtaatacgactcactatagggaggcgg-3′) primer according to the manufacturer's instructions. cRNAs were labeled with biotinylated UTP and CTP by in vitro transcription using double-stranded cDNA including a T7 promoter as template and the T7 RNA Transcript Labeling Kit (ENZO Diagnostics, Farmingdale, NY). For labeling, double-stranded cDNAs were washed twice with 70% ethanol and resuspended in 22 μL RNase-free H2O. The cDNAs were incubated with 4 μL of 10 × reaction buffer, biotin-labeled ribonucleotides, dithiothreitol, RNase inhibitor mix, and 2 μL20 × T7 RNA polymerase for 5 hours at 37°C. The labeled cRNAs were separated from unincorporated ribonucleotides by passing through a CHROMA SPIN-100 column (Clontech, Palo Alto, CA) and precipitated at -20°C for 1 hour to overnight.
Oligonucleotide array hybridization and analysis. The cRNA pellets were resuspended in 10 μL RNase-free H2O and 10 μg of each sample was fragmented by heat and ion-mediated hydrolysis at 95°C for 35 minutes in 200 mM Tris-acetate, pH 8.1, 500 mM potassium acetate, and 150 mM magnesium acetate. The fragmented cRNAs were hybridized for 16 hours at 45°C to the Affymetrix GeneChip Human Genome U133A microarray, comprising over 39 000 transcript variants, representing 33 000 of the best characterized genes, together with additional probe sets designed to represent expression sequence tagged (EST) sequences. Arrays were washed at 25°C with 6 × SSPE (0.9 M NaCl, 60 mM NaH2PO4, 6 mM EDTA, and 0.01% Tween 20), followed by a stringent wash at 50°C with 100 mM MES, 0.1 M NaCl, and 0.01% Tween 20. The arrays were then stained with phycoerythrin (PE)-conjugated streptavidin (Molecular Probes, Eugene, OR) and the fluorescence intensities were determined using a laser confocal scanner (Hewlett-Packard, Santa Clara, CA). The scanned images were analyzed using Microarray software (Affymetrix, Santa Clara, CA). Sample loading and variations in staining were standardized by scaling the average of the fluorescence intensities of all genes on an array to constant target intensity (ie, 2500) for all arrays used. Data analysis was performed using Microarray Suite 5.0 (Affymetrix), following user guidelines. The signal intensity for each gene was calculated as the average intensity difference, represented by Σ(PM - MM)/(number of probe pairs), where PM and MM denote perfect-match and mismatch probes. Microarray analysis was performed in collaboration with Genome Explorations (Memphis, TN).
Cluster analysis
Microarray data were analyzed using GeneSpring version 7 (Silicon Genetics, Redwood City, CA). All signal values below 0.01 were set to 0.01. Interarray variations were accounted for by dividing the signal of each gene on a given array by the median of all genes on that array. Transcripts detected as present in either the DS AMkL or non-DS AMkL samples were selected using the Affymetrix present, marginal, and absent flags. Only those probes indicated as present or marginal in about 70% of the samples for either sample type were included in subsequent analyses. For DS AMkL, each gene was required to be present or marginal in a minimum of 5 of the 7 samples. For non-DS AMkL, each gene was required to be present or marginal in a minimum of 4 of the 6 samples. Genes that were present in either cell type were further filtered to include genes whose transcripts differed in expression by a minimum of 2-fold between the DS AMkL and non-DS AMkL cases.
Analysis of variance (ANOVA) was applied to the genes selected in the previous filtering to identify differentially expressed genes with a high level of statistical confidence. One-way parametric ANOVA was used with the Benjamini and Hochberg multiple test correction to control the false discovery rate21 (FDR) set at 10%. Clustering was performed using the median normalized expression data with a Euclidean distance metric.
Verification of gene expression by real-time PCR
cDNAs were prepared from 1 μg RNA using random hexamer primers and a reverse transcriptase-PCR (RT-PCR) kit (Perkin Elmer, Shelton, CT), and purified with the QIAquick PCR Purification Kit (Qiagen, Valencia, CA). Bone marrow stromal-cell antigen 2 (BST2), CD36, dual specificity phosphatase 6 (DUSP6), keratin 18 (KRT18), Rhesus blood group associated-glycoprotein (RHAG), multidrug resistance 1 (MDR1), B-cell CLL/lymphoma 2 (Bcl2), and GATA1 transcripts, along with 18S RNA levels, were quantitated using a LightCycler real time PCR machine (Roche, Indianapolis, IN). PCRs contained 2 μL purified cDNA or standard plasmid, 4 mM MgCl2, 0.5 μM each of sense and antisense primers, and 2 μL FastStart DNA Master SYBR Green I enzyme-SYBR reaction mix (Roche). Primers are listed in Table 1. PCR conditions consisted of an initial denaturing step of 95°C for 10 minutes, amplification with 35 to 55 cycles of 95°C, 59 to 69°C for 10 seconds, and 72°C for 5 seconds, followed by melting curve analysis from 40°C to 99°C, and a final cooling step to 40°C. External standard curves for the genes of interest were constructed using serial dilutions of linearized standards, prepared by cloning the amplicons synthesized with each primer set in pGEM-T-Easy plasmid (Promega). An 18S RNA plasmid construct was prepared by cloning the 18S RNA amplicon, synthesized from K562 cDNA with commercial primers (Am-bion, Austin, TX), into the pGEM T-Easy vector (Promega) and linearizing with ApaI. Serial dilutions were amplified in real time and the data used to prepare the 18S RNA external standard curve. Real-time PCR results were expressed as mean values from 2 to 3 independent experiments using the same cDNA preparation and normalized to 18S RNA.
Table 1.
Summary of primers used for real-time RT-PCR in this study
|
Primer sequences
|
||||
|---|---|---|---|---|
| Gene | Forward | Reverse | Size, bp | Annealing temperature, °C |
| 18S | 5′-GATGCGGGGCGTTATT-3′ | 5′-TGAGGTTTCCCGTGTTGTCA-3′ | 167 | 59 |
| GATA1 | 5′-TGGAGACTTTGAAGACAGAGCGGCTGAG-3′ | 5′-GAAGCTTGGGAGAGGAATAGGCTGCTGA-3′ | 174 | 63 |
| BST2 | 5′-CCTGCTCGGCTTTTCGCTTGAACAT-3′ | 5′-CGGAGGGAGGCTCTGGAGGGAGAC-3′ | 199 | 62 |
| KRT18 | 5′-GAGTATGAGGCCCTGCTGAACATCA-3′ | 5′-GCGGGTGGTGGTCTTTTGGAT-3′ | 150 | 62 |
| DUSP6 | 5′-GCTGTGCCAAAGACTCCACCAACTT-3′ | 5′-GGCCTCAGGGAAAAACTGGGACA-3′ | 176 | 62 |
| BCL2 | 5′-CTGCACCTGACGCCCTTCACC-3′ | 5′-CACATGACCCCACCGAACTCAAAGA-3′ | 119 | 61 |
| CD36 | 5′-ATTGGTGCTGTCCTGGCTGTGTTT-3′ | 5′-GTTCATCATCACTTCCTGTGGATTTTGC-3′ | 195 | 59 |
| RHAG | 5′-GGCATGAAAATGAAGAGTCCGCATAC-3′ | 5′-CTGGAGAAGGCAAAGGCTGTGA-3′ | 187 | 61 |
| MDR1 | 5′-CAGGAACCTGTATTGTTTGCCACCAC-3′ | 5′-TGCTTCTGCCCACCACTCAACTG-3′ | 188 | 59 |
Preparation of nuclear extracts and electrophoretic mobility shift assays
Nuclear extracts from CMK and Meg-01 cells were prepared as previously described.20 Complementary single-stranded oligonucleotides (upper strand: 5′-gggtgcccttgattatcttcaccatcaagg-3′; lower strand: 5′-ccttgatggtgaagataatcaagggcaccc-3′) were annealed (designated BST2+113/+142 probe), end labeled with 32P-γ-ATP, and purified using Sephadex G-25 quick spin columns (Boehringer-Mannheim, Mannheim, Germany). Nuclear proteins were preincubated in a reaction solution containing 20 mM Tris-HCl, pH 7.9, 2 mM MgCl2, 1 mM EDTA, 50 mM KCl, 0.5 mM dithiothreitol, 10% glycerol, 0.1% Nonidet P-40, and 2 μg poly(dI-dC). After 10 minutes, the 32P-end-labeled duplex oligonucleotide (2 × 10⁵ cpm) was added, and the reaction was incubated for another 20 minutes on ice. DNA/protein complexes were separated on 5% non-denaturing polyacrylamide gels in 0.5 × Tris-borate-EDTA (TBE, pH 8.4) at 4°C and 35 mA. The gels were dried and the complexes were visualized by autoradiography.
Chromatin immunoprecipitation assay
Chromatin immunoprecipitation (ChIP) assays were performed in CMK and Meg-01 cells as previously described,20 with GATA1 C-terminus (C-20 antibody, Santa Cruz Biotechnology, Santa Cruz, CA) antibody. Standard PCR for the BST2 promoter region was performed with forward (5′-gtagaagattccagcaccctcccctaa-3′) and reverse (5′-gcaggagatgggtgacattgcgacactc-3′) primers spanning positions -58 to +211. An unrelated human gene (GATA1, exon 3) was also amplified with forward (5′tggagactttgaagacagagcggctgag-3′) and reverse (5′-gaagcttgggagaggaataggctgctga-3′) primers to validate the specificity of the ChIP assays.
Construction of plasmids, transient transfection, and luciferase assay
The expression vectors, pPacGATA1-L and pPacGATA1-S, corresponding to the full-length and truncated GATA1 forms, respectively, were prepared as previously described.17 The putative BST2 promoter region, spanning 759 bp upstream of the translation start site and including 211 bp of exon 1, was PCR amplified from CMK gDNA using forward (5′-ttcacgctagccccctttgcagatgaagaaacaggctcaga-3′) and reverse (5′-ttcacctcgaggcaggagatgggtgacattgcgacactc-3′) primers (underlined sequences in the forward and reverse primers are restriction sites for NheI and XhoI, respectively). The amplicons were digested with NheI and XhoI and ligated to the corresponding sites of the reporter gene vector, pGL3Basic, to generate pGL3B-BST2pro. The D Mel-2 cells were cotransfected with 1 μg of the BST2 reporter gene construct and 125 to 500 ng GATA1-L (pPacGATA1) or GATA1-S (pPacGATA1-S), using Fugene 6 reagent (Roche), as described previously.17 Luciferase activities were assayed using the Single Luciferase Assay System (Promega) and normalized to total cell protein, measured by the Bio-Rad (Hercules, CA) protein assay system. CMK and Meg-01 cells (5 × 10⁶ cells/400 μL Opti-MEM) were transfected with 20 μg pGL3B-BST2pro and 1 μg pRLSV40 by electroporation (200 V and 950 μF). Cells were harvested and lysates prepared 48 hours after the transfection. Firefly luciferase activity was assayed with a Dual-Luciferase Reporter Assay System (Promega) in a Turner TD2420 luminometer (Sunnyvale, CA) and normalized to Renilla luciferase activity.
Generation of stable BST2 transfectants and apoptosis assay
Human BST2 coding sequence was PCR amplified from CMS cDNA with forward (5′-ttcacggatccgaattcatggcatctacttcgtatga-3′) and reverse (5′-ttcacctcgagagatcaagggaatgttcaagcgaaaa-3′) primers (underlined sequences in the forward and reverse primers are restriction sites for BamHI and XhoI, respectively). After digestion with BamHI and XhoI, the BST2 amplicon was ligated into pcDNA3 expression vector (Invitrogen, Carlsbad, CA) to generate the pcDNA3-BST2 construct. pcDNA3-BST2 was transfected into CMK cells using Lipofectin (Invitrogen), as previously described.18 Forty-eight hours after transfection, the cells were plated in Noble agar (0.35%) in complete medium plus 10% fetal bovine serum and antibiotics and containing 1 mg/mL G418 (Sigma, St Louis, MO). Single colonies of stably transfected cells were selected after 3 weeks, expanded, and screened for BST2 transcripts by real-time RT-PCR analysis.
Mock- and BST2-transfected CMK cells, seeded at an initial density of 1 × 10⁵ cells/mL, were cocultured in the presence and absence of HS-5 human bone marrow stromal cells (density of 8 × 10⁵ cells/mL). The cells were incubated with 150 nM ara-C for 72 hours at 37°C, after which the cells were trypsinized, washed, and resuspended into a 1-mL volume of incubation media. To differentiate the myeloid leukemia from the stromal-cell populations, CD33-PE antibody (myeloid marker) was added with annexin-fluorescein isothiocyanate (FITC) prior to analysis with an Epics-XL MCL flow cytometer (Fullerton, CA). The individual incubation conditions included (1) culture without the HS-5 cells and no incubation with ara-C, (2) incubation with ara-C without the HS-5 cells, and (3) incubation with ara-C in the presence of HS-5 cells. Absolute viable cell counts (annexin V-) in the CD33+ gate were corrected by the internal standard and used to establish ara-C sensitivities.
Statistical analysis
Differences in transcript levels between the DS and non-DS patient groups were compared using the nonparametric Mann-Whitney 2-sample test. The nonparametric Spearman rank correlation coefficient was used to analyze transcript levels and their relationship to MTT data. Statistical analyses were performed with StatView (Version 4.5 for Windows).
Results
DS and non-DS megakaryoblasts exhibit different sensitivities to ara-C and daunorubicin
MTT assays were used to analyze in vitro drug sensitivities of megakaryoblasts from newly diagnosed DS patients (mean age, 1.7 years) and non-DS AMkL patients (mean age, 2.3 years). Compared with non-DS megakaryoblasts (n = 11), DS megakaryoblasts (n = 16) were significantly more sensitive to both ara-C (9.7-fold; median value of 112.6 nM versus 1091 nM; P = .001) and daunorubicin (17.6-fold; 6.25 nM versus 109.8 nM; P = .001; Figure 1). Thus, our in vitro drug sensitivity results with megakaryoblast samples appear to be representative of the well-established differences in EFS rates between DS and non-DS AMkL patients. The drug sensitivity results of the DS AMkL samples in Figure 1 have previously been reported.19
Figure 1.

Drug sensitivities of megakaryoblasts from pediatric patients with AMkL. In vitro sensitivities to ara-C (A) and daunorubicin (B) of megakaryoblasts, obtained from newly diagnosed Down syndrome (DS) and non-DS children with AMkL, were measured by the MTT assay. Drug sensitivity results of the DS AMkL samples have been reported previously.19
Patterns of differential gene expression between DS and non-DS AMkL
Differences in drug sensitivities between DS and non-DS AMkL cases are likely due to differentially expressed genes that may or may not be localized to chromosome 21. The standard approach for exploring this question is to use microarray technology. Because AMkL represents the predominant DS AML subtype, we restricted our analysis of non-DS samples to the AMkL phenotype so as to control for the clinical and biologic heterogeneity among the different AML FAB subtypes. Accordingly, total RNAs were extracted from megakaryoblasts obtained from DS (n = 5) and non-DS (n = 5) children and from DS AMkL (CMK and CMY) and non-DS AMkL (CMS) cell lines. cRNAs were prepared from the corresponding cDNAs and hybridized to an Affymetrix GeneChip Human Genome U133A microarray (comprising 22 283 transcripts) to identify differentially expressed genes between DS and non-DS samples.
For the DS group, genes present or marginal were filtered in at least 5 of 7 samples, selecting a total of 6826 genes. In the non-DS group, genes present or marginal were filtered in at least 4 of 6 samples, selecting 9679 genes. Overall, 9820 genes were selected, which were present or marginal in either group. This list of genes was further filtered for those transcripts with a minimum 2-fold change in expression between DS AMkL and non-DS AMkL, providing 1273 genes. ANOVA was applied to these 1273 genes to identify those that are differentially expressed with a high level of statistical confidence. One-way parametric ANOVA was used with the Benjamini and Hochberg multiple test correction to control the FDR.21 With the FDR set at 10%, 551 genes were identified as differentially expressed between DS AMkL and non-DS AMkL, all having a minimum 2-fold change in expression. The top 105 probe sets selected for genes underexpressed and overexpressed in DS AMkL are shown in Tables 2 and 3, respectively.
Table 2.
Top 105 probe sets selected for genes underexpressed in DS AMkL compared with non-DS AmkL
| Gene | Fold change | Gene symbol | GenBank no. | Chromosomal location | Description |
|---|---|---|---|---|---|
| 211796_s_at | 28.12 | TCRBV13S1-TCRBJ2S1 | AF043179 | — | Homo sapiens T-cell receptor β chain (TCRBV13S1-TCRBJ2S1) mRNA, complete cds |
| 217022_s_at | 27.97 | MGC27165 | S55735 | 14q32.33 | Hypothetical protein MGC27165 |
| 204959_at | 19.34 | MNDA | NM_002432 | 1q22 | Myeloid cell nuclear differentiation antigen |
| 1405_i_at | 17.93 | CCL5 | M21121 | 17q11.2–q12 | Chemokine (C-C motif) ligand 5 |
| 218847_at | 12.72 | IMP-2 | NM_006548 | 3q28 | IGF-II mRNA-binding protein 2 |
| 219279_at | 12.58 | — | NM_017718 | 2q36.3 | — |
| 201743_at | 12.53 | CD14 | NM_000591 | 5q22-q32 | CD14 antigen |
| 34210_at | 12.48 | CDW52 | N90866 | 1p36 | CDW52 antigen (CAMPATH-1 antigen) |
| 216035_x_at | 12.48 | TCF7L2 | AV721430 | 10q25.3 | Transcription factor 7-like 2 (T-cell specific, HMG-box) |
| 211991_s_at | 12.38 | HLA-DPA1 | M27487 | 6p21.3 | Major histocompatibility complex, class II, DP α 1 |
| 213539_at | 12.18 | CD3D | NM_000732 | 11q23 | CD3D antigen, δ polypeptide (TiT3 complex) |
| 212651_at | 11.96 | RHOBTB1 | AB018283 | 10q21.3 | Rho-related BTB domain containing 1 |
| 218223_s_at | 11.36 | CKIP-1 | NM_016274 | 1q21.3 | CK2 interacting protein 1; HQ0024c protein |
| 200800_s_at | 10.97 | HSPA1A | NM_005345 | 6p21.3 | Heat shock 70-kDa protein 1A |
| 214677_x_at | 10.96 | IGLJ3 | X57812 | 22q11.1–q11.2 | Immunoglobulin λ joining 3 |
| 211675_s_at | 10.62 | — | AF054589 | 7q31.2///7q31.2 | — |
| 210982_s_at | 10.19 | HLA-DRA | M60333 | 6p21.3 | Major histocompatibility complex, class II, DR α |
| 209138_x_at | 10.17 | — | M87790 | 22q11.1–q11.2 | — |
| 215379_x_at | 9.819 | IGLJ3 | AV698647 | 22q11.1–q11.2 | Immunoglobulin λ joining 3 |
| 211368_s_at | 9.609 | CASP1 | U13700 | 11q23 | Caspase-1, apoptosis-related cysteine protease (interleukin 1, β, convertase) |
| 205081_at | 9.594 | CRIP2 | NM_001311 | 7q11.23 | Cysteine-rich protein 2 |
| 218559_s_at | 9.557 | MAFB | NM_005461 | 20q11.2–q13.1 | v-maf musculoaponeurotic fibrosarcoma oncogene homolog B (avian) |
| 211571_s_at | 9.541 | CSPG2 | D32039 | 5q14.3 | Chondroitin sulfate proteoglycan 2 (versican) |
| 208891_at | 9.516 | DUSP6 | BC003143 | 12q22-q23 | Dual specificity phosphatase 6 |
| 219229_at | 9.488 | SLCO3A1 | NM_013272 | 15q26 | Solute carrier organic anion transporter family, member 3A1 |
| 209040_s_at | 9.468 | PSMB8 | U17496 | 6p21.3 | Proteasome (prosome, macropain) subunit, β type, 8 (large multifunctional protease 7) |
| 215646_s_at | 9.385 | CSPG2 | R94644 | 5q14.3 | Chondroitin sulfate proteoglycan 2 (versican) |
| 219505_at | 9.344 | CECR1 | NM_017424 | 22q11.2 | Cat eye syndrome chromosome region, candidate 1 |
| 204891_s_at | 9.093 | LCK | NM_005356 | 1p34.3 | Lymphocyte-specific protein tyrosine kinase |
| 204661_at | 8.961 | CDW52 | NM_001803 | 1p36 | CDW52 antigen (CAMPATH-1 antigen) |
| 204619_s_at | 8.71 | CSPG2 | BF590263 | 5q14.3 | Chondroitin sulfate proteoglycan 2 (versican) |
| 217523_at | 8.62 | — | AV700298 | 11p13 | AV700298 GKC Homo sapiens cDNA clone GKCBVGO5 3′, mRNA sequence |
| 201506_at | 8.592 | TGFBI | NM_000358 | 5q31 | Transforming growth factor, β-induced, 68 kDa |
| 208791_at | 8.552 | CLU | M25915 | 8p21-p12 | Clusterin (complement lysis inhibitor, SP-40,40, sulfated glycoprotein 2, testosterone-repressed prostate message 2, apolipoprotein J) |
| 201641_at | 8.506 | BST2 | NM_004335 | 19p13.2 | Bone marrow stromal cell antigen 2 |
| 203949_at | 8.477 | MPO | NM_000250 | 17q23.1 | Myeloperoxidase |
| 204646_at | 8.461 | DPYD | NM_000110 | 1p22 | Dihydropyrimidine dehydrogenase |
| 218927_s_at | 8.401 | CHST12 | NM_018641 | 7p22 | Carbohydrate (chondroitin 4) sulfotransferase 12 |
| 208450_at | 8.353 | LGALS2 | NM_006498 | 22q12-q13 | Lectin, galactoside-binding, soluble, 2 (galectin 2) |
| 221731_x_at | 8.257 | CSPG2 | BF218922 | 5q14.3 | Chondroitin sulfate proteoglycan 2 (versican) |
| 214500_at | 8.033 | H2AFY | AF044286 | 5q31.3–q32 | H2A histone family, member Y |
| 208892_s_at | 7.959 | DUSP6 | BC003143 | 12q22-q23 | Dual specificity phosphatase 6 |
| 209374_s_at | 7.528 | IGHM; MU | BC001872 | 14q32.33 | Synonym: MU; Homo sapiens immunoglobulin heavy constant μ, mRNA (cDNA clone MGC:1228 IMAGE:3544448), complete cds |
| 211429_s_at | 7.463 | — | AF119873 | — | PRO2275 mRNA, complete cds |
| 204202_at | 7.244 | KIAA1023 | NM_017604 | 7p22.3 | Homo sapiens KIAA1023 protein (KIAA1023), mRNA |
| 212063_at | 7.063 | CD44 | BE903880 | 11p13 | CD44 antigen (homing function and Indian blood group system) |
| 201301_s_at | 7.045 | ANXA4 | BC000182 | 2p13 | Annexin A4 |
| 209304_x_at | 6.957 | GADD45B | AF087853 | 19p13.3 | Growth arrest and DNA-damage-inducible, β |
| 210915_x_at | 6.881 | TCRB | M15564 | — | T-cell receptor precursor; human T-cell receptor rearranged βa-chain V-region (V-D-J) mRNA, complete cds |
| 208894_at | 6.854 | HLA-DRA | M60334 | 6p21.3 | Major histocompatibility complex, class II, DR α |
| 210473_s_at | 6.844 | — | M37712 | — | Homo sapiens p58/GTA protein kinase mRNA, complete cds |
| 212068_s_at | 6.822 | KIAA0515 | AB011087 | 9q34.3 | KIAA0515 |
| 203069_at | 6.8 | SV2A | NM_014849 | 1q21.3 | Synaptic vesicle glycoprotein 2A |
| 202284_s_at | 6.784 | CDKN1A | NM_000389 | 6p21.2 | Cyclin-dependent kinase inhibitor 1A (p21, Cip1) |
| 212592_at | 6.749 | IGJ | AV733266 | 4q21 | Immunoglobulin J polypeptide, linker protein for immunoglobulin α and μ polypeptides |
| 217762_s_at | 6.711 | RAB31 | BE789881 | 18p11.3 | RAB31, member RAS oncogene family |
| 203275_at | 6.701 | IRF2 | NM_002199 | 4q34.1–q35.1 | Interferon regulatory factor 2 |
| 203431_s_at | 6.602 | RICS | NM_014715 | 11q24-q25 | Rho GTPase-activating protein |
| 203148_s_at | 6.58 | TRIM14 | NM_014788 | 9q31.1 | Tripartite motif-containing 14 |
| 203408_s_at | 6.548 | SATB1 | NM_002971 | 3p23 | Special AT-rich sequence-binding protein 1 (binds to nuclear matrix/scaffold-associating DNAs) |
Table 3.
Top 105 probe sets selected for genes overexpressed in DS AMkL compared with non-DS AMkL
| Gene name | Fold change | Gene symbol | GenBank no. | Chromosomal location | Description |
|---|---|---|---|---|---|
| 219870_at | 0.5 | ATF71P2 | NM_024997 | 16p13.2 | Activating transcription factor 7 interacting protein 2 |
| 203377_s_at | 0.498 | CDC40 | NM_015891 | 6q22.1 | Cell division cycle 40 homolog (yeast) |
| 217793_at | 0.494 | RAB11B | AL575337 | 19p13.3 | RAB11B, member RAS oncogene family |
| 206875_s_at | 0.491 | SLK | NM_014720 | 10q25.1 | SNF1 sucrose nonfermenting like kinase (yeast) |
| 203910_at | 0.491 | PARG1 | NM_004815 | 1p22.1 | PTPL1-associated RhoGAP1 |
| 221832_s_at | 0.491 | AOF2 | AV741657 | 1p36.11 | Amine oxidase (flavin containing) domain 2 |
| 210718_s_at | 0.49 | LOC51326 | AF119889 | 17q21.32 | ARF protein |
| 218712_at | 0.489 | FLJ20508 | NM_017850 | 1p34.2 | Hypothetical protein FLJ20508 |
| 214801_at | 0.485 | — | W88821 | — | CDNA FLJ11392 fis, clone HEMBA1000575 |
| 212246_at | 0.482 | MCFD2 | BE880828 | 2p21 | Multiple coagulation factor deficiency 2 |
| 202008_s_at | 0.48 | NID | NM_002508 | 1q43 | Nidogen (enactin) |
| 202421_at | 0.476 | IGSF3 | AB007935 | 1p13 | Immunoglobulin superfamily, member 3 |
| 222329_x_at | 0.463 | — | AW974816 | — | Transcribed sequence with weak similarity to protein sp:P39188 (Homo sapiens) ALU1_HUMAN Alu subfamily J sequence contamination warning entry |
| 202557_at | 0.46 | STCH | AI718418 | 21q11.1 | Stress 70 protein chaperone, microsome-associated, 60 kDa |
| 209045_at | 0.459 | XPNPEP1 | AF195530 | 10q25.3 | X-prolyl aminopeptidase (aminopeptidase P) 1, soluble |
| 218344_s_at | 0.457 | FLJ10876 | NM_018254 | 1q32.3 | Hypothetical protein FLJ10876 |
| 202468_s_at | 0.451 | CTNNAL1 | NM_003798 | 9q31.2 | Catenin (cadherin-associated protein), α-like 1 |
| 203015_s_at | 0.451 | SSX2IP | AW136988 | — | Synovial sarcoma, X breakpoint 2 interacting protein |
| 203224_at | 0.447 | FLJ11149 | BF340123 | 9q21.31 | Riboflavin kinase |
| 203225_s_at | 0.443 | FLJ11149 | NM_018339 | 9q21.31 | Riboflavin kinase |
| 202932_at | 0.442 | YES1 | NM_005433 | 18p11.31–p11.21 | v-yes-1 Yamaguchi sarcoma viral oncogene homolog 1 |
| 214205_x_at | 0.44 | TXNL2 | AK022131 | 6p25.3 | Thioredoxin-like 2 |
| 204417_at | 0.439 | GALC | NM_000153 | 14q31 | Galactosylceramidase (Krabbe disease) |
| 210818_s_at | 0.437 | BACH1 | AF026199 | 21q22.11 | BTB and CNC homology 1, basic leucine zipper transcription factor 1 |
| 207332_s_at | 0.433 | TFRC | NM_003234 | 3q26.2-qter | Transferrin receptor (p90, CD71) |
| 202949_s_at | 0.432 | FHL2 | NM_001450 | 2q12-q14 | Four and a half LIM domains 2 |
| 221580_s_at | 0.425 | MGC5306 | BC001972 | 11q21 | Hypothetical protein MGC5306 |
| 207386_at | 0.42 | CYP7B1 | NM_004820 | 8q21.3 | Cytochrome P450, family 7, subfamily B, polypeptide 1 |
| 207845_s_at | 0.42 | APC10 | NM_014885 | 4q31 | Anaphase-promoting complex subunit 10 |
| 212884_x_at | 0.414 | APOE | AI358867 | 19q13.2 | Apolipoprotein E |
| 212978_at | 0.413 | TA-LRRP | AU146004 | 1p22.2 | T-cell activation leucine repeat-rich protein |
| 211810_s_at | 0.405 | GALC | D25284 | 14q31 | Galactosylceramidase (Krabbe disease) |
| 202506_at | 0.405 | SSFA2 | NM_006751 | 2q32.1 | Sperm-specific antigen 2 |
| 206693_at | 0.403 | IL7 | NM_000880 | 8q12-q13 | Interleukin-7 |
| 203640_at | 0.401 | — | BE328496 | 13q32.2 | hs98f09.x1 NCI_CGAP_Kid13 Homo sapiens cDNA clone IMAGE:3145289 3′, mRNA sequence |
| 208398_s_at | 0.392 | TBPL1 | NM_004865 | 6q22.1–q22.3 | TBP-like 1 |
| 214252_s_at | 0.388 | — | AV700514 | 13q21.1–q32 | AV700514 GKC Homo sapiens cDNA clone GKCDQC04 3′, mRNA sequence |
| 204624_at | 0.387 | ATP7B | NM_000053 | 13q14.2–q21 | ATPase, Cu++ transporting, β polypeptide (Wilson disease) |
| 213757_at | 0.386 | EIF5A | AA393940 | 17p13-p12 | Eukaryotic translation initiation factor 5A |
| 203789_s_at | 0.382 | SEMA3C | NM_006379 | 7q21-q31 | Sema domain, immunoglobulin domain (Ig), short basic domain, secreted, (semaphorin) 3C |
| 209267_s_at | 0.373 | SLC39A8 | AB040120 | 4q22-q24 | Solute carrier family 39 (zinc transporter), member 8 |
| 216063_at | 0.369 | HBBP1 | N55205 | — | Transcribed sequence with moderate similarity to protein sp:P02096 (Homo sapiens) HBG_HUMAN hemoglobin γ-A and γ-G chains |
| 208691_at | 0.367 | TFRC | BC001188 | 3q26.2-qter | Transferrin receptor (p90, CD71) |
| 212990_at | 0.366 | SYNJ1 | AB020717 | 21q22.2 | Synaptojanin 1 |
| 213358_at | 0.365 | KIAA0802 | AB018345 | 18p11.22 | KIAA0802 protein |
| 202558_s_at | 0.361 | STCH | NM_006948 | 21q11.1 | Stress 70 protein chaperone, microsome-associated, 60 kDa |
| 203019_x_at | 0.36 | SSX2IP | NM_014021 | — | Synovial sarcoma, X breakpoint 2 interacting protein |
| 205667_at | 0.358 | WRN | NM_000553 | 8p12-p11.2 | Werner syndrome |
| 219177_at | 0.355 | BRIX | NM_018321 | 5p13.3 | BRIX |
| 209676_at | 0.354 | TFPI | J03225 | 2q31-q32.1 | Tissue factor pathway inhibitor (lipoprotein-associated coagulation inhibitor) |
| 212558_at | 0.351 | GDAP1L1 | BF508662 | 20q12 | Ganglioside-induced differentiation-associated protein 1-like 1 |
| 203017_s_at | 0.346 | SSX21P | R52678 | — | Synovial sarcoma, X breakpoint 2 interacting protein |
| 204976_s_at | 0.338 | AMMECR1 | AK023637 | Xq22.3 | Alport syndrome, mental retardation, midface hypoplasia, and elliptocytosis chromosomal region, gene 1 |
| 216398_at | 0.338 | GYPE | U05255 | 4q31.1 | Glycophorin E |
| 219795_at | 0.334 | SLC6A14 | NM_007231 | Xq23-q24 | Solute carrier family 6 (neurotransmitter transporter), member 14 |
| 203544_s_at | 0.329 | STAM | NM_003473 | 10p14-p13 | Signal transducing adaptor molecule (SH3 domain and ITAM motif) 1 |
| 210664_s_at | 0.318 | TFPI | AF021834 | 2q31-q32.1 | Tissue factor pathway inhibitor (lipoprotein-associated coagulation inhibitor) |
| 202479_s_at | 0.316 | TRB2 | BC002637 | 2p25.1 | Tribbles homolog 2 |
| 202481_at | 0.31 | DHRS3 | NM_004753 | 1p36.1 | Dehydrogenase/reductase (SDR family) member 3 |
| 217388_s_at | 0.31 | KYNU | D55639 | 2q22.3 | Kynureninase (L-kynurenine hydrolase) |
When all 22 283 genes were clustered together, the DS and non-DS samples intermingled and could not be distinguished. However, when the 551 differentially expressed genes were clustered, 2 well-separated and distinct clusters were identified between the DS and non-DS AMkL groups, consisting of 105 genes overexpressed in the DS group and 446 genes overexpressed in the non-DS group (Figure 2A). The 551 genes were widely localized to different chromosomes, predominated by chromosomes 1, 2, 6, and 11, with only 7 genes localized to chromosome 21 (Figure 2B).
Figure 2.

Cluster analysis of differentially expressed genes between DS and non-DS megakaryoblasts; chromosomal localization of genes in cluster analysis. (A) Microarray analysis using the Affymetrix U133A genechip was performed with DS (n = 5) and non-DS (n = 5) AMkL samples and clinically relevant AMkL cell lines (n = 3). Following selection of genes that were present or marginal in either group and filtered for those transcripts with a minimum 2-fold change in expression between DS AMkL and non-DS AMkL, one-way analysis of variance (ANOVA) was used with the Benjamini and Hochberg multiple test correction to control the FDR at 10%, and identified 551 genes as differentially expressed between DS AMkL and non-DS AMkL. Clustering was performed using the median normalized expression data with a Euclidean distance metric and identified 105 genes overexpressed in the DS group and 447 genes overexpressed in the non-DS group. (B) Chromosome localization of the 551 genes analyzed in the cluster analysis.
Validation of microarray results by real-time RT-PCR
To more accurately quantitate transcript levels for differentially expressed genes identified by microarrays, real-time RT-PCR was used with RNAs isolated from a larger cohort of DS (n = 15; 71.5% mean blast percentage) and non-DS AMkL (n = 11; 76% mean blast percentage) samples, including the patient samples from the microarray analysis. Several representative genes were selected from the top 105 genes identified in the cluster analysis, which were either underexpressed or overexpressed in the DS specimens relative to the non-DS group (Table 4). The underexpressed genes included: (1) bone marrow stromal-cell antigen 2 (BST2; NM_004335; localized to 19p13.2); (2) dual specificity phosphatase 6 (DUSP6; BC003143; localized to 12q22-q23); (3) keratin 18 (KRT18; NM_00 224; localized to 12q13); and (4) B-cell CLL/lymphoma 2 (Bcl2; NM_000633; localized to 18q21.33). The overexpressed genes included (1) CD36 antigen (collagen type I receptor, thrombospondin receptor; NM_000072; localized to 7q11.2), (2) multidrug resistance 1 (MDR1; AF016535; localized to 7q21.1); and (3) Rhesus blood group associated-glycoprotein (RHAG; NM_000324; localized to 6p21.1-p11). Our results (Table 4) confirmed that the differences in expression for BST2, DUSP6, KRT18, and CD36 genes were statistically significant between the 2 groups. However, there were no statistically significant changes in the transcript levels for the Bcl-2, MDR1, and RHAG genes despite appreciable differences in their median values. This is presumably due to the small sample numbers in our patient cohort.
Table 4.
Summary of median transcript levels in DS and non-DS megakaryoblast samples
| Gene | DS AMkL | Non-DS AMkL | Fold difference by real-time PCR | P | Fold difference by microarray |
|---|---|---|---|---|---|
| BST2 | 0.220 | 1.600 | 7.3 | .004 | 8.5 |
| KRT18 | 1.430 | 26.020 | 18.2 | .020 | 5.7 |
| DUSP6 | 0.600 | 3.150 | 5.3 | .003 | 7.9 |
| BCL2 | 0.163 | 1.067 | 6.5 | .070 | 5.1 |
| CD36 | 1.473 | 0.476 | 3.1 | .012 | 4.6 |
| RHAG | 0.185 | 0.114 | 1.6 | .384 | 8.6 |
| MDR1 | 0.881 | 0.430 | 2.0 | .195 | 4.5 |
Data are shown for median transcript levels determined by real-time RT-PCR assays, as described in “Materials and methods.” Statistical differences between the groups for the real-time RT-PCR results were determined by the nonparametric Mann-Whitney 2-sample test.
Role of GATA1 in the differential expression of BST2 in DS and non-DS AMkL
The finding that essentially all DS AMkL cases exhibit somatic mutations in exon 2 of the GATA1 gene that result in synthesis of a shorter (40 kDa) GATA1 protein with altered transcriptional activity from the full-length (50 kDa) form11-14 provides a possible explanation for the differences in gene expression between DS and non-DS AMkL samples (Tables 3, 4). Indeed, this was exactly the case for CDA, for which our previous study identified a close association between the presence of GATA1 gene mutations, GATA1 binding sites in the CDA promoter, and differential patterns of CDA gene expression in DS and non-DS AML.18
Based on its potential relevance to leukemia biology, the BST2 gene was selected as a prototype for further studies to identify the mechanism responsible for its differential expression between the non-DS and DS AMkL groups. BST2 is a novel surface membrane protein expressed in bone marrow stromal cell lines that was originally reported to support the stromal cell-dependent growth of a murine pre-B-cell line, DW34.22 Notably, BST2 is also expressed in a variety of normal tissues and malignant cells including the non-DS AMkL cell line, Mo7, and multiple myeloma cells.22,23 It is interesting that coincubation of leukemia cells with bone marrow stromal cells protects the former from chemotherapy-induced apoptosis, whereas megakaryocytic differentiation of progenitor cells is inhibited by direct contact with bone marrow stromal cells.24-26 Collectively, these results suggest a potentially important role of bone marrow stroma in general, and BST2 in particular, in the biology of AMkL in DS and non-DS children. By database analysis (Transfac 3.2, MatInspector V2.2, Gesellschaft für Biotechnologische, Braunschweig, Germany), the BST2 promoter region was found to contain numerous putative cis elements including GATA1 (Figure 3).
Figure 3.

Schematic of the promoter region of the bone marrow stromal-cell antigen 2 gene. Putative promoter region, spanning 759 bp upstream of the translation start site ATG including 211 bp of exon 1 of the BST2 gene. Numbering is relative to the translation start site (+1). Potential cis-regulatory elements on the plus (+) and minus (-) DNA strands (determined by Transfac 3.2, MatInspector V2.2) are underlined and shown in bold.
Experiments were performed to explore the possible role of differences between the truncated and full-length GATA1 in regulating BST2 levels in clinically relevant DS (CMK) and non-DS (Meg-01) cell lines that exhibit similar expression patterns by real-time RT-PCR to those in the primary DS and non-DS AMkL specimens (data not shown). BST2 transcripts were easily detectable in Meg-01 cells by real-time RT-PCR; however, CMK cells lacked detectable BST2 transcripts (Figure 4A upper panel). Likewise, in reporter gene assays with a BST2 promoter-reporter gene construct, there was an 18-fold difference in luciferase activity between the lines (Figure 4A lower panel), consistent with the notion of a regulation at the transcriptional level.
Figure 4.
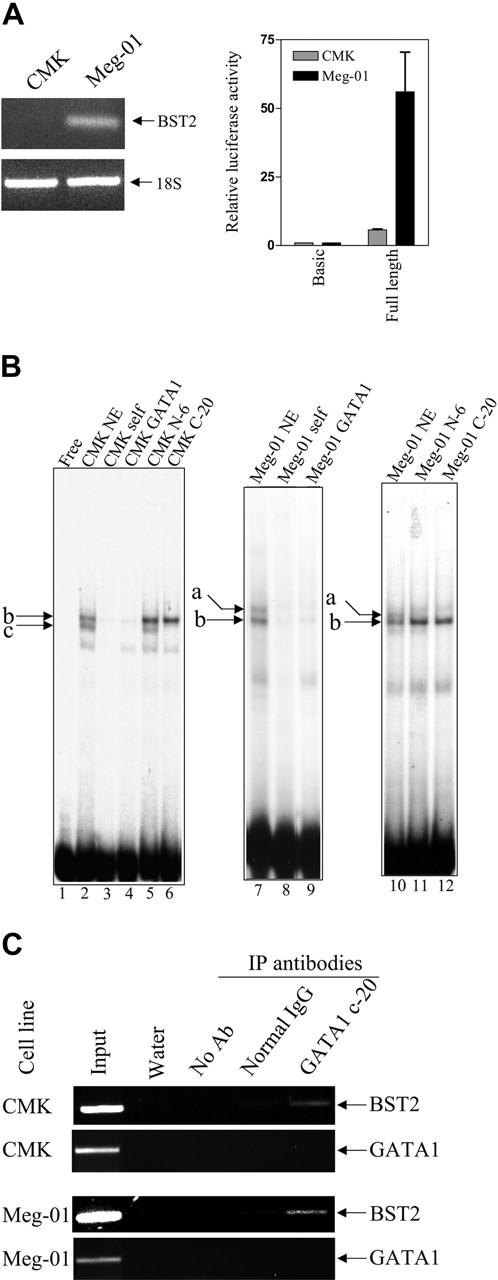
BST2 transcripts and promoter activity in AMkL cell lines; gel shifts with the +39/+65 BST2 probe. (A) Transcript levels of BST2 in the DS AMkL cell line, CMK, and non-DS AMkL cell line, Meg-01 (top panel), measured by real-time PCR, and BST2 promoter activities in CMK and Meg-01 cells (bottom panel), measured by relative luciferase activity following transient transfection of the cell lines with the BST2 reporter gene construct, pGL3B-BST2pro. Error bars indicate standard error of measurement of 3 independent experiments. (B) Gel shift assays were performed with CMK and Meg-01 nuclear extracts and the 32P-labeled +39/+65 BST2 oligonucleotide probe in the absence and presence of 100-fold molar excess commercial consensus GATA1 oligonucleotide. The specific DNA/protein complexes are indicated by lowercase letters. For the supershifts, GATA1 antibodies were added to the reaction mixtures and incubated for 30 minutes prior to separating the DNA/protein complexes. (C) In vivo binding of the long- and short-form GATA1 proteins to the BST2 promoter was confirmed by ChIP assays, as described in “Materials and methods.”
On gel shifts with a double-stranded oligonucleotide probe (BST2+113/+142, including the GATA1-binding site) and nuclear extracts prepared from the CMK and Meg-01 cell lines, 2 major specific DNA-protein complexes were identified in each cell line (lane 2, labeled b and c for the CMK cell line; lanes 7 and 10, labeled a and b for the Meg-01 cell line), one (labeled b) of which was common to both cell lines (Figure 4B). All 3 complexes were competed by a 100-fold molar excess of consensus GATA1 oligonucleotide (lanes 4 and 9). Addition of an antibody (N-6 antibody) that exclusively recognizes the long-form GATA1 protein abolished complex a without an obvious effect on the faster moving complexes b and c (lanes 11 and 5). Moreover, addition of an antibody (C-20 antibody) that recognizes both the long- and short-form GATA1 proteins abolished both complex a in the Meg-01 cells and complex c in the CMK cells without affecting the formation of complex b in both cell lines. These results confirm binding of the long-form GATA1 protein to the BST2 promoter in Meg-01 cells (corresponding to complex a), and of the short GATA1 protein in CMK cells (complex c). Although complex b could be competed by the GATA1 consensus oligonucleotide in both cell lines, the N-6 and C-20 GATA1 antibodies had no effect on its formation, indicating that complex b is non-GATA1 protein. In vivo binding of the long- and short-form GATA1 proteins to the BST2 promoter in both CMK and Meg-01 chromatin extracts was confirmed by ChIP assays (Figure 4C).
To further assess whether GATA1 proteins regulate the transcription of the BST2 gene in a fashion analogous to CDA,17 a luciferase reporter gene construct, pGL3B-BST2pro, was cotransfected with GATA1 (pPacGATA1-L or pPacGATA1-S, encoding the long- and short-form GATA1 proteins, respectively) into D Mel-2 cells. pPacGATA1-L stimulated the BST2 promoter construct in a dose-dependent manner (Figure 5). Although a dose-dependent transactivation was also seen for pPacGATA1-S, its magnitude was substantially reduced (Figure 5). These results directly establish that BST2 is a bona fide GATA1 target gene.
Figure 5.

Differential activation of the BST2 promoter by long- and short-form GATA1. Activation of the BST2 promoter by the long- and short-form GATA1 in Drosophila Mel-2 cells. Drosophila Mel-2 cells were cotransfected with 1 μg of the BST2 reporter gene construct (pGL3B-BST2pro) and 125 to 500 ng pPacGATA1-L or pPacGATA1-S. For all transfections, constant plasmid was maintained (at 500 ng of the pPac series). The results represent data from 3 experiments as the mean (± SD) fold increases in luciferase activity relative to a control for which pGL3B-BST2pro was cotransfected with 500 ng pPacO vector.
Relationship between levels of BST2 and GATA1 transcripts in non-DS AMkL patients
Although the results in Figures 4 and 5 clearly demonstrate a role for GATA1 protein binding and differential transactivation of the BST2 promoter by short versus long GATA1 proteins, it is important to further validate BST2 as a GATA1 target in primary AMkL specimens. Accordingly, we used real-time RT-PCR to quantitate expression of BST2 and GATA1 transcripts. The focus for this series of experiments was exclusively on non-DS AML cells (11 non-DS AMkL and 17 non-DS AML), because DS megakaryoblasts only express the 40 kDa GATA1 short protein with decreased transactivating potential from that for the full-length form (Figure 5). As illustrated by Figure 6, there was a statistically significant correlation between GATA1 transcript levels and BST2 transcript levels (r = 0.67; P = .001) for these 28 non-DS specimens. These results strongly support the notion of an important role for GATA1 in regulating BST2 expression in non-DS AML.
Figure 6.

Correlation between BST2 and GATA1 transcripts in non-DS blast cells. Correlation between BST2 and GATA1 transcripts determined by real-time RT-PCR in 17 non-DS AML and 14 non-DS AMkL patient samples. The nonparametric Spearman rank correlation coefficient was used to analyze the relationship between BST2 and GATA1 transcripts.
Functional role of the BST2 gene in determining AML sensitivity to ara-C
There was no statistically significant correlation between BST2 transcript levels and in vitro ara-C sensitivities for primary DS and non-DS AMkL samples (data not shown). However, the finding that coincubation of AML cells with the human bone marrow stromal cells could improve AML-cell survival in vitro, and attenuate ara-C-induced cell killing and apoptosis,24,25 suggested that bone marrow stromal cells play a critical role in regulating proliferation and apoptosis of leukemia cells.
Based on these results, experiments were performed in vitro to directly assess the effects of BST2 gene expression in clinically relevant AML models on ara-C sensitivities in the presence and absence of HS-5 human bone marrow stromal cells. The DS AMkL cell line, CMK, which does not express BST2, was stably transfected with a full-length BST2 cDNA. Two clones (designated BST2#8 and BST2#11) were isolated that expressed increased (∼25- and ∼100-fold, respectively) BST2 transcripts over the mock-transfected CMK cells (Figure 7A). A flow cytometry-based assay (ie, annexin V binding) was used to measure apoptosis in mock-transfected and BST2-transfected sublines coincubated over 72 hours with and without HS-5 cells in the presence of ara-C (150 nM).
Figure 7.
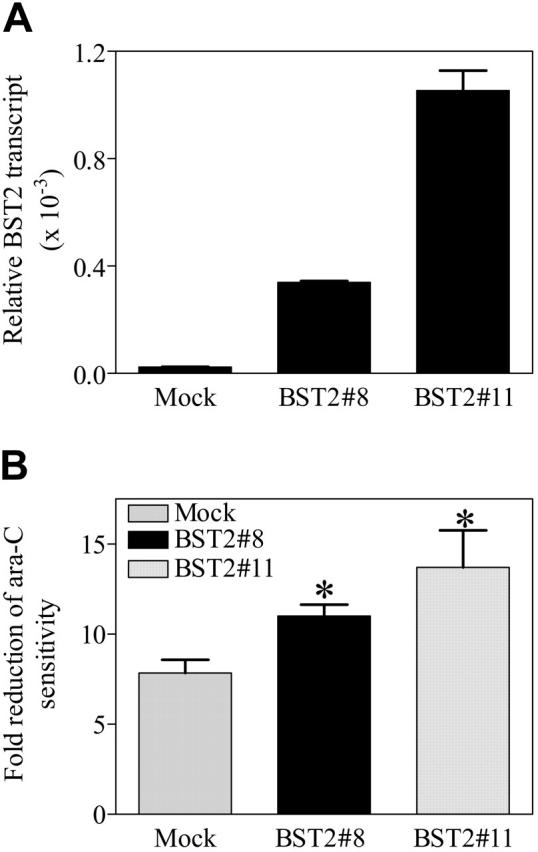
Functional activity of the BST2 gene in transfected CMK sublines. (A) The coding cDNA of BST2 gene was amplified by PCR and subcloned into a mammalian expression vector, pcDNA3. The BST2 construct was stably transfected into the DS AMkL cell line, CMK. Overexpression of BST2 in 2 of the stable clones was confirmed by real-time RT-PCR. (B) Protection of BST2 stable clones from ara-C-induced apoptosis by bone marrow stromal cells, HS-5, determined with annexin-FITC on an Epics-XL MCL flow cytometer, as described in “Materials and methods.” Error bars indicate standard error of 3 independent experiments. *Statistically significant difference (P < .005).
As anticipated, in vitro incubation of the mock-transfected and 2 BST2-transfected CMK clones with ara-C in the absence of HS-5 cells did not result in a significant difference in apoptosis (not shown). Similar results were obtained by MTT assay (not shown). However, the BST2#8 and BST2#11 transfectants showed a significantly greater reduction (1.41- and 1.76-fold, respectively) from ara-C-induced apoptosis in the presence of HS-5 bone marrow stromal cells than the mock-transfected CMK cells (Figure 7B). Due to technical difficulties related to autofluorescence of daunorubicin, daunorubicin-induced apoptosis could not be assessed with the flow cytometry-based apoptosis assay. Although the molecular basis for these results is not entirely clear, they would seem to suggest that BST2 directly mediates the regulatory effects of bone marrow stromal cells on the leukemia cells, leading to leukemia-cell protection from ara-C-induced cytotoxicity.
Discussion
Microarray analysis represents a powerful tool for the simultaneous analysis of expression of thousands of genes that has been used to identify differences between leukemia phenotypes or clinical outcomes.27,28 In the present report, we used microarrays to analyze differentially expressed genes between DS and non-DS AMkL patients to identify genes that may be linked to the significantly higher EFS rates of DS AMkL patients or the exceedingly poor outcome of non-DS AMkL patients. Using the Affymetrix U133A microarray, 551 genes were identified by one-way ANOVA that differed at least 2-fold in their expression levels between the DS and non-DS groups and that formed 2 well-separated and distinct clusters. Although it would be expected that a gene copy/gene dosage effect would result in a 1.5-fold higher expression of chromosome 21-localized genes in DS leukemia cells compared with non-DS leukemia cells, we found that the localization of genes identified in the cluster analysis involved a number of chromosomes, with only 7 of the 551 genes being localized to chromosome 21. Because a 2-fold difference in expression was used to filter the differentially expressed genes between DS and non-DS samples, chromosome 21-localized genes with the theoretical 1.5-fold differential expression would be filtered out of the analysis. Of the 551 genes identified by the cluster analysis, 105 genes were overexpressed in the DS group and 447 genes were overexpressed in the non-DS group.
Real-time PCR was used to validate the expression levels of 7 representative genes in a larger group of DS and non-DS leukemia samples. The BST2, KRT18, and DUSP6 transcripts were 7.3-, 18.2-, and 5.3-fold higher, respectively, in the non-DS than in the DS megakaryoblast samples, whereas CD36 transcripts were increased 3.1-fold in the DS group. Although differences in the median values for MDR1, BCL-2, and RHAG transcripts were also increased in DS AMkLs, these was not statistically significant, possibly due to the modest sample size.
The identification of somatic mutations in exon 2 of the transcription factor gene, GATA1, in essentially all DS AMkL cases including the DS samples used in this study (data not shown) suggests that the mutation is synonymous with the DS AMkL phenotype. The resulting synthesis of a shorter (40 kDa) GATA1 protein, with altered transcriptional activity, may have an impact on transcription of multiple genes, including many of those with differential expression between DS and non-DS AML samples identified herein. BST2 was selected for further analysis to examine factors that contribute to differentially expressed nonchromosome 21-localized genes between the DS and non-DS AMkL group and the possible relationship between BST2 expression and the effects of bone marrow stromal cells on AML chemotherapy drug sensitivity. By database analysis, several potential GATA1-binding motifs were identified in the BST2 promoter region and, on gel shifts with nuclear extracts and ChIP assays with chromatin extracts from the DS (CMK) and non-DS (Meg-01) AMkL cell lines, binding of both long- and short-form GATA1 proteins was demonstrated. Cotransfections of D Mel-2 cells with a luciferase BST2 promoter construct with expression constructs for the long- and short-form GATA1 proteins confirmed the markedly decreased transactivating potential of short-form GATA1 compared with the long-form GATA1 protein. Thus, decreased BST2 transcripts in DS AMkL cells would appear to result from the exclusive synthesis of short-form GATA1 protein with a compromised transcriptional activity toward BST2. The important role for GATA1 in BST2 transcription can be generalized because GATA1 transcripts closely correlated with BST2 expression in non-DS AML samples including AMkL and non-AMkL.
The growth and differentiation of many hematopoietic cells in vivo require direct contact with stromal cells that produce a variety of growth factors and, in some cellular systems, direct contact between stromal cells and hematopoietic cells is required for cell growth and differentiation.29 The importance of stromal cells in regulating the proliferation and apoptosis of leukemia cells was previously suggested by the protection from ara-C-induced cytotoxicity/apoptosis when AML cells were coincubated with HS-5 human bone marrow stromal cells.24,25 In the present study, we extended these findings to include a critical role for BST2 expression by leukemia cells in facilitating this effect of bone marrow stroma on ara-C chemosensitivity because expression of BST2 was essential for the protection of leukemia cells in these experiments. Hence, low levels of BST2 in DS megakaryoblasts may lead to reduced bone marrow stromal interactions, whereas higher BST2 expression in non-DS leukemia cells likely promotes interactions between leukemia cells and bone marrow stroma, resulting in decreased apoptosis upon treatment with ara-C. Although there are likely to be other molecules on the surface of leukemia cells that interact with bone marrow stroma, because HS-5 stromal cells also provided a significant (albeit reduced) protection of mock-transfected CMK cells from ara-C-induced apoptosis, our results, nonetheless, suggest that BST2 may represent a possible new therapeutic target for AML. Interestingly, BST2 has also been reported to be up-regulated in tamoxifen-resistant breast cancer cells,30 suggesting potential multiple functions for this gene in different cancers.
Two prior studies examined differentially expressed genes between DS transient myeloproliferative disorder (TMD) and DS AMkL cases.31,32 We did not observe an overlap between the genes identified in our analysis and from these 2 prior studies. This is not unexpected because the prior studies only examined DS TMD and AMkL blasts, which contain both mutated GATA1 genes and trisomy 21, and, hence, the mechanisms accounting for differentially expressed genes would differ from a comparison group of non-DS AMkL blasts, which lack GATA1 mutations and constitutional trisomy 21.
In conclusion, the results of this study strongly suggest that the factors accounting for the increased chemotherapy sensitivity of DS megakaryoblasts compared with non-DS megakaryoblasts are complex. Our results with BST2 imply that critical genes that contribute to biologic differences related to treatment response may be identified by microarray analysis and that differential transactivation by the long and short forms of the GATA1 protein may account for different patterns of gene expression between the 2 groups. Studies are underway to further explain the patterns of different gene expression between DS and non-DS AMkL groups and to identify additional gene targets linked to the high EFS rates of DS AMkL patients and low EFS rates of non-DS AMkL patients.
Prepublished online as Blood First Edition Paper, October 25, 2005; DOI 10.1182/blood-2005-06-2219.
Supported by grants from the National Cancer Institute (RO1 CA92308), Leukemia and Lymphoma Society, BPCT Golf Charity, Elana Fund, Justin's Gift Charity, Dale Meyer Endowment for Leukemia Research, and the Ring Screw Textron Endowed Chair for Pediatric Cancer Research (J.W.T.). Microarray data analysis was supported by the Microarray and Bioinformatics Facility Core, Wayne State University, National Institute of Environmental Health Sciences Center grant P30 ES06639. J.W.T. is a Scholar in Clinical Research of the Leukemia and Lymphoma Society. Y.G. is a recipient of a Charles J. Epstein Research Award from the National Down Syndrome Society and a Research Award from the Children's Research Center of Michigan.
An Inside Blood analysis of this article appears at the front of this issue.
The publication costs of this article were defrayed in part by page charge payment. Therefore, and solely to indicate this fact, this article is hereby marked “advertisement” in accordance with 18 U.S.C. section 1734.
References
- 1.Taub JW. Relationship of chromosome 21 and acute leukemia in children with Down syndrome. J Pediatr Hematol Oncol. 2001;23: 175-178. [DOI] [PubMed] [Google Scholar]
- 2.Athale UH, Razzouk BI, Raimondi SC, et al. Biology and outcome of childhood acute megakaryoblastic leukemia: a single institution's experience. Blood. 2001;97: 3727-3732. [DOI] [PubMed] [Google Scholar]
- 3.Lange BJ, Kobrinsky N, Barnard DR, et al. Distinctive demography, biology, and outcome of acute myeloid leukemia and myelodysplastic syndrome in children with Down syndrome: Children's Cancer Group Studies 2861 and 2891. Blood. 1998;91: 608-615. [PubMed] [Google Scholar]
- 4.Zipursky A, Thorner P, De Harven E, Christensen H, Doyle J. Myelodysplasia and acute megakaryoblastic leukemia in Down's syndrome. Leuk Res. 1994;18: 163-171. [DOI] [PubMed] [Google Scholar]
- 5.Ravindranath Y, Abella E, Krischer J, et al. Acute myeloid leukemia (AML) in Down's syndrome is highly responsive to chemotherapy: experience on Pediatric Oncology Group AML study 8498. Blood. 1992;80: 2210-2214. [PubMed] [Google Scholar]
- 6.Ravindranath Y, Yeager AM, Chang MN, et al. Acute myeloid leukemia in children: a randomized comparative study of purged autologous bone marrow transplantation versus intensive multiagent consolidation chemotherapy in first remission (Pediatric Oncology Group Study-POG 8821). N Engl J Med. 1996;334: 1428-1434. [DOI] [PubMed] [Google Scholar]
- 7.Gamis AS, Woods WG, Alonzo TA, et al. Children's Cancer Group Study 2891. Increased age at diagnosis has a significantly negative effect on outcome in children with Down syndrome and acute myeloid leukemia: a report from the Children's Cancer Group Study 2891. J Clin Oncol. 2003;21: 3415-3422. [DOI] [PubMed] [Google Scholar]
- 8.Creutzig U, Reinhardt D, Diekamp S, Dworzak M, Stary J, Zimmermann M. AML patients with Down syndrome have a high cure rate with AML-BFM therapy with reduced dose intensity. Leukemia. 2005;19: 1355-1360. [DOI] [PubMed] [Google Scholar]
- 9.Zeller B, Gustafsson G, Forestier E, et al. Acute leukaemia in children with Down syndrome: a population-based Nordic study. Br J Haematol. 2005;128: 797-804. [DOI] [PubMed] [Google Scholar]
- 10.Kojima S, Sako M, Kato K, et al. An effective chemotherapeutic regimen for acute myeloid leukemia and myelodysplastic syndrome in children with Down's syndrome. Leukemia. 2000;14: 786-791. [DOI] [PubMed] [Google Scholar]
- 11.Wechsler J, Greene M, McDevitt MA, et al. Acquired mutations in GATA1 in the megakaryoblastic leukemia of Down syndrome. Nat Genet. 2002;32: 148-152. [DOI] [PubMed] [Google Scholar]
- 12.Mundschau G, Gurbuxani S, Gamis AS, Greene ME, Arceci RJ, Crispino JD. Mutagenesis of GATA1 is an initiating event in Down syndrome leukemogenesis. Blood. 2003;101: 4298-4300. [DOI] [PubMed] [Google Scholar]
- 13.Hitzler JK, Cheung J, Li Y, et al. GATA1 mutations in transient leukemia and acute megakaryoblastic leukemia of Down syndrome. Blood. 2003;101: 4301-4304. [DOI] [PubMed] [Google Scholar]
- 14.Rainis L, Bercovich D, Strehl S, et al. Mutations in exon 2 of GATA1 are early events in megakaryocytic malignancies associated with trisomy 21. Blood. 2003;102: 981-986. [DOI] [PubMed] [Google Scholar]
- 15.Harigae H, Xu G, Sugawara T, Ishikawa I, Toki T, Ito E. The GATA1 mutation in an adult patient with acute megakaryoblastic leukemia not accompanying Down syndrome. Blood. 2004;103: 3242-3243. [DOI] [PubMed] [Google Scholar]
- 16.Taub JW, Ge Y. Down Syndrome, drug metabolism and chromosome 21. Pediatr Blood Cancer. 2005;44: 33-39. [DOI] [PubMed] [Google Scholar]
- 17.Ge Y, Jensen TL, Stout ML, et al. The role of cytidine deaminase and GATA1 mutations in the increased cytosine arabinoside sensitivity of Down syndrome myeloblasts and leukemia cell lines. Cancer Res 2004;64: 728-735. [DOI] [PubMed] [Google Scholar]
- 18.Ge Y, Stout ML, Tatman DA, et al. GATA1, cytidine deaminase and the high cure rate of Down syndrome children with acute megakaryocytic leukemia. J Natl Cancer Inst. 2005;97: 226-231. [DOI] [PubMed] [Google Scholar]
- 19.Taub JW, Huang X, Matherly LH, et al. Expression of chromosome 21-localized genes in acute myeloid leukemia: differences between Down syndrome and non-Down syndrome blast cells and relationship to in vitro sensitivity to cytosine arabinoside and daunorubicin. Blood. 1999;94: 1393-1400. [PubMed] [Google Scholar]
- 20.Ge Y, Jensen TL, Matherly LH, Taub JW. Transcriptional regulation of the cystathionine-β-synthase gene in Down syndrome and non-Down syndrome megakaryocytic leukemia cell lines. Blood. 2003;101: 1551-1557. [DOI] [PubMed] [Google Scholar]
- 21.Benjamini Y, Hochberg Y. Controlling the false discovery rate: a practical and powerful approach to multiple testing. J Roy Stat Soc B Met. 1995; 57: 289-300. [Google Scholar]
- 22.Ishikawa J, Kaisho T, Tomizawa H, et al. Molecular cloning and chromosomal mapping of a bone marrow stromal cell surface gene, BST2, that may be involved in pre-B-cell growth. Genomics. 1995;26: 527-534. [DOI] [PubMed] [Google Scholar]
- 23.Ohtomo T, Sugamata Y, Ozaki Y, et al. Molecular cloning and characterization of a surface antigen preferentially overexpressed on multiple myeloma cells. Biochem Biophys Res Commun. 1999;258: 583-591. [DOI] [PubMed] [Google Scholar]
- 24.Garrido SM, Appelbaum FR, Willman CL, Banker DE. Acute myeloid leukemia cells are protected from spontaneous and drug-induced apoptosis by direct contact with a human bone marrow stromal cell line (HS-5). Exp Hematol. 2001;29: 448-457. [DOI] [PubMed] [Google Scholar]
- 25.Konopleva M, Konoplew S, Hu W, Zaritskey AY, Afanasiev BV, Andreeff M. Stromal cells prevent apoptosis of AML cells by up-regulation of antiapoptotic proteins. Leukemia. 2002;16: 1713-1724. [DOI] [PubMed] [Google Scholar]
- 26.Zweegman S, Veenhof MA, Debili N, Schuurhuis GJ, Huijgens PC, Drager AM. Megakaryocytic differentiation of human progenitor cells is negatively influenced by direct contact with stroma. Leukemia. 1999;13: 935-943. [DOI] [PubMed] [Google Scholar]
- 27.Ross ME, Mahfouz R, Onciu M, et al. Gene expression profiling of pediatric acute myelogenous leukemia. Blood. 2004;104: 3679-3687. [DOI] [PubMed] [Google Scholar]
- 28.Valk PJ, Verhaak RG, Beijen MA, et al. Prognostically useful gene-expression profiles in acute myeloid leukemia. N Engl J Med. 2004;350: 1617-1628. [DOI] [PubMed] [Google Scholar]
- 29.Daniel CP, Ponting IL, Dexter TM. Growth and development of haemopoietic cells: a deterministic process? Haematol Blood Transfus. 1989;32: 172-177. [DOI] [PubMed] [Google Scholar]
- 30.Becker M, Sommer A, Kratzschmar JR, Seidel H, Pohlenz HD, Fichtner I. Distinct gene expression patterns in a tamoxifen-sensitive human mammary carcinoma xenograft and its tamoxifen-resistant subline MaCa 3366/TAM. Mol Cancer Ther. 2005;4: 151-168. [PubMed] [Google Scholar]
- 31.McElwaine S, Mulligan C, Groet J, et al. Microarray transcript profiling distinguishes the transient from the acute type of megakaryoblastic leukaemia (M7) in Down's syndrome, revealing PRAME as a specific discriminating marker. Br J Haematol. 2004;125: 729-742. [DOI] [PubMed] [Google Scholar]
- 32.Lightfoot J, Hitzler JK, Zipursky A, Albert M, Macgregor PF. Distinct gene signatures of transient and acute megakaryoblastic leukemia in Down syndrome. Leukemia. 2004;18: 1617-16234. [DOI] [PubMed] [Google Scholar]