


Abstract
d[G4(T4G4)3] has been folded into a unimolecular G-quadruplex in the presence of 15 ions. NMR spectroscopy confirmed that its topology is the same as the solution state structure determined earlier by Wang and Patel (J. Mol. Biol., 1995; 251: 76–94) in the presence of Na+ ions. The d[G4(T4G4)3] G-quadruplex exhibits four G-quartets with three 15-ion-binding sites (O1, I and O2). Quantitative analysis utilizing 15 ions as a NMR probe clearly demonstrates that there is no unidirectional 15 ion movement through the central cavity of the G-quadruplex. 15 ions move back and forth between the binding sites within the G-quadruplex and exchange with ions in bulk solution. 15 ion movement is controlled by the thermodynamic preferences of individual binding sites, steric restraints of the G-quartets for 15 ion passage and diagonal versus edge-type arrangement of the T4 loops. The movement of 15 ions from the interior of the G-quadruplex to bulk solution is faster than exchange within the G-quadruplex. The structural details of the G-quadruplex define stiffness of individual G-quartets that intimately affects 15 ion movement. The stiffness of G-quartets and steric hindrance imposed by thymine residues in the loops contribute to the 5-fold difference in the exchange rate constants through the outer G-quartets.
INTRODUCTION
It has been known for several decades that GMP and guanine polymers form viscous gels in aqueous solutions (2). G-quartets were postulated to be the building blocks of four stranded assemblies or G-quadruplexes. However, these structures were mostly viewed with curiosity, as there was no evident application, nor was their biological relevance known at that time. More recently, interest for G-quadruplex structures has increased due to the role of G-rich DNA in telomere sequences and gene promoter regions (3–10). G-quadruplex formation has been associated with human diseases (e.g. cancer, HIV or diabetes) (4,11–15) and the sequences that form these structures are now considered therapeutic targets (16–18).
G-quartets are assembled from four coplanary arranged guanine bases that are held together by Hoogsteen hydrogen bonds (2–4,19–22). In the center of each G-quartet are four closely spaced carbonyl groups whose electrostatic repulsions are reduced by the coordination of cations (23). G-quadruplexes are formed by the stacking of two or more G-quartets. The strand stoichiometry of a G-quadruplex is primarily determined by the number of G-rich repeats in the quadruplex-forming sequence. Short oligonucleotides with a single G-rich segment usually form parallel, tetramolecular G-quadruplexes. In such structures, the glycosidic bonds of all guanines are in the anti conformation. Longer oligonucleotides with two or more G-rich segments can form bi- or unimolecular G-quadruplex structures (1,24–27). For unimolecular quadruplexes, the four G-rich segments of a DNA strand can still align in a parallel fashion, if the intervening bases form loops with a double-chain reversal conformation. Alternatively, the G-rich segments of bi- and unimolecular G-quadruplexes can align themselves in an anti-parallel fashion and form the so-called ‘fold-back’ quadruplexes. In these structures, guanine glycosidic bonds alternate between syn and anti conformations around a G-quartet and along an oligonucleotide strand. In fold-back G-quadruplexes, the loops connecting G-rich segments run diagonally across the face or along the edges of the outer G-quartets.
G-quadruplexes are typically stabilized by monovalent cations, but some divalent cations are also known to stabilize G-quadruplex structures (28–31). Not surprisingly, various cations stabilize G-quadruplexes differently (23,32). The presence of different cations can lead to conformational plurality (33,34). Our recent studies have suggested that the G-quadruplex topologies and 3D structures of some G-rich oligonucleotides with two G-rich repeats are more susceptible to the presence of different cations than others (35–39). Oligonucleotide with four human telomeric repeats, d(T2AG3), forms a unimolecular G-quadruplex with diagonal- and edge-type loops in the presence of Na+ ions (40), whereas completely different structure with four parallel G-rich strands has been determined by X-ray crystallography in the presence of K+ ions (41). A mixture of parallel–anti-parallel strands has also been observed for sequences containing d(T2AG3) repeats in solution (42–45).
K+ and Na+ are biologically important cations, as they are present in and around living cells at the highest concentrations. Na+, a relatively small cation can be coordinated in the plane of a G-quartet, while larger cations (e.g. K+,  ) have to be coordinated between two adjacent G-quartets (3,46–49). At present, there are limited detailed studies of the binding and dynamic properties of cations within G-quadruplex structures. The use of heteronuclear (metal ion) NMR to directly monitor Na+, Tl+, K+ and Rb+ cations has confirmed the direct coordination of these cations inside G-quadruplex structures (50–59). The introduction of
  ions as a probe for cation localization within G-quadruplex structures has opened a whole range of new opportunities for studies with NMR (49,60–62).
In the current study, we have focused on d[G4(T4G4)3], which consists of 3.5 units of the telomeric repeat sequence d(G4T4)n of the protozoan Oxytricha nova. The unimolecular G-quadruplex adopted by this oligonucleotide in solution with Na+ ions consists of four G-quartets with alternating parallel and anti-parallel strands (Figure 1) (1). The conformation of guanine nucleosides along the strands alternates between syn and anti. One of the T4 loops spans diagonally across the outer G-quartet, while the two T4 loops on the other side of the G-quadruplex core run along the opposite edges of the outer G-quartet. d[G4(T4G4)3] was folded into a G-quadruplex in the presence of ions and confirmed by NMR to adopt the same solution state structure. As expected, three binding sites for ions were identified within the G-quadruplex, whereas no ions could be localized between the outer G-quartets and T4 loops. Cations bound inside the d[G4(T4G4)3] quadruplex are not static. These cations exchange amongst the three binding sites within the G-quadruplex and with bulk solution. We have studied exchange using a 2D 15N–1H NzExHSQC NMR experiment and assessed the exchange processes of ions in a qualitative and quantitative manner. The comparison of our results for ion movement with cation movement measurements previously obtained for a bimolecular G-quadruplex adopted by the related DNA sequence d(G4T4G4) reveals that ion movement is 80 times slower in the case of the unimolecular G-quadruplex studied here.
Figure 1.

(A) Topology of unimolecular G-quadruplex adopted by d[G4(T4G4)3] and -ion-binding sites. The three binding sites are labeled as O1, I and O2. The guanine bases are shown as numbered rectangles, where cyan and magenta rectangles represent nucleobases in anti and syn conformation, respectively. (B) Birds-eye view of a ion above an individual G-quartet.
MATERIALS AND METHODS
Sample preparation
The oligonucleotide d[G4(T4G4)3] was synthesized on an Expedite 8909 synthesizer using standard phosphoramidite chemistry and deprotected with concentrated aqueous ammonia. DNA was then purified by passage over a 1.0 m Sephadex G15 column. Fractions containing only full-length oligonucleotide were pooled, lyophilized, redissolved in 1 ml H2O and dialyzed against 40 mM 15NH4Cl overnight. Samples were lyophilized and subsequently redissolved in 0.3 ml of 95% H2O–5% 2H2O. LiOH or HCl were added to adjust pH of NMR samples to 6.0. Oligonucleotide concentration was 1.8 mM.
NMR spectroscopy
NMR data were collected on a Varian Unity Inova 600 MHz NMR spectrometer. Standard 1D 1H spectra were acquired with 16 k complex points, a spectral width of 10 kHz and 128 scans using WATERGATE solvent suppression. 2D NOESY spectra were acquired at mixing times of 80 and 300 ms with 4 k complex points in F2 and 320 increments in F1 dimensions, 16 scans for each increment and spectral width of 10 kHz in both dimensions at 298 K. Twenty different gradient strengths (0.53–20.55 G/cm) were used in diffusion experiments (BPPSTE) with 16 k complex points, a spectral width of 10 kHz, 64 scans and WATERGATE solvent suppression at 298 K. 15N–1H HSQC spectra were acquired at 293 K with 1024 complex points in the F2 dimension and 256 increments in the F1 dimension, 16 scans for each increment and a spectral width of 4 kHz in F2 and 1 kHz in F1. 15N–1H NzExHSQC spectra were acquired with 1024 complex points in the F2 and 256 increments in the F1 dimensions, 16 scans for each increment and a spectral width of 4 kHz in F2 and 1 kHz in F1. Cross-peaks in this experiment appear due to the movement of ions from an initial to a different chemical environment during the mixing time (τm). The magnetization of during the mixing time is in Nz state. A series of NzExHSQC spectra at mixing times of 13, 50, 100, 200, 300, 400, 500 and 600 ms were acquired at 283, 293, 303 and 313 K. Quantitative analysis of cross-peak volumes as a function of mixing time was used to determine rate constants for site exchange.
Data analysis
Volumes of cross-peaks were integrated using Varian VNMRJ 2.1A software. All volumes at a given temperature were integrated relative to the most intense autocorrelation peak (O1 at τm of 13 ms). The arbitrary volume of 1.00 in the figures was assigned to volume of autocorrelation peak O1 at τm of zero. Iterative least-square fitting was done with Origin 7.5 software (www.originlab.com). Errors in variables are reported as calculated by the Origin program and are estimates of standard deviation. Quality of the fits is expressed as root mean square deviation (RMSD).
RESULTS
d[G4(T4G4)3] folds into a unimolecular quadruplex in the presence of ions
The oligonucleotide d[G4(T4G4)3] has been folded into a G-quadruplex structure by overnight dialysis against a 40 mM 15NH4Cl solution, which resulted in well-resolved imino (and other) resonances in 1H NMR spectra (Figure 2A and B). The chemical shifts of 16 imino protons were different from those reported for the same oligonucleotide in the presence of Na+ ions (1). This is not surprising because the different ionic radii of the two cations can induce differences in the local structure of the G-quadruplex, which lead to different shielding of imino protons by the nearby aromatic ring currents. In addition, and Na+ ions can themselves exert distinct (de)shielding due to their different electrostatic densities and different preferred positions between neighboring G-quartets. Our initial assumption that the general fold of the G-quadruplex is the same in the presence of Na+ and cations was substantiated by acquiring a series of NOESY spectra, by measuring translational diffusion coefficients and by other NMR experiments. The fold-back nature of the unimolecular d[G4(T4G4)3] quadruplex was confirmed by the presence of eight guanines in syn conformation, which is in full accordance with the NMR structure of the Na+ form (Figure 1). Additionally, if both Na+ and forms of G-quadruplex exhibit the same folding topology their hydrodynamic properties should be the same. Pulsed-field gradient spin-echo diffusion experiments were used to determine translational diffusion coefficients of 1.2 × 10⁻⁶ and 1.1 × 10⁻⁶ cm2/s for the Na+ and NH4+ forms, respectively. The equivalence of these diffusion coefficients, within the experimental error, also supports equivalent folding topologies.
Figure 2.

Aromatic (A) and imino (B) regions of 1H NMR spectrum of form of d[G4(T4G4)3] G-quadruplex at 298 K. Plot of 2D 15N–1H HSQC spectrum (C). The cross-peak corresponding to ions in bulk is labeled as B, while those residing at the binding sites within the G-quadruplex are labeled as O1, O2 and I.
Cation localization
The -ion-binding sites within the d[G4(T4G4)3] G-quadruplex were identified with the use of 2D 15N–1H HSQC NMR spectra. Analysis of these spectra revealed four peaks that correspond to ions in four distinct chemical environments (Figure 2C).
The most intense peak at δ(1H) of 7.10 p.p.m. corresponds to ions in bulk solution, while the three smaller peaks correspond to ions occupying different binding sites within the G-quadruplex. The -ion-binding sites are located between pairs of adjacent G-quartets. The cross-peaks with the similar 1H NMR chemical shifts of 7.38 and 7.36 p.p.m. were assigned to the outer binding sites O1 and O2, respectively. Their chemical shifts along the 15N dimension are 38.18 and 38.35 p.p.m., respectively (Figure 2C). The cross-peak at δ(1H) of 7.28 p.p.m. was assigned to the inner binding site (I). The assignment of bound ions and their localization sites were confirmed by 2D NOESY data. The outer binding site designated as O1 was assigned to the intra-quadruplex binding site near the outer G-quartet that is spanned by the diagonal T4 loop. The outer binding site designated as O2 was assigned to site composed of the outer G-quartet spanned by the two lateral loops (vide infra). It has been previously suggested that cations may reside between the outer G-quartets and T4 loops with greater residence times than delocalized cations. Our NMR data does not offer support for ions residing at loop-binding sites, or at least not cations with relatively long (e.g. millisecond) resonance times, as we only observe a single NMR resonance corresponding to bulk ions.
It is noteworthy that volume integrals of these three cross-peaks in HSQC spectrum are not the same. The ratios of volume integrals of cross-peaks O1, I and O2 at 130 mM ion concentration are 1.0:0.7:0.7, respectively. The occupancies of binding sites O1, I and O2 calculated on the basis of equilibrium binding constants at 1.8 mM G-quadruplex and 130 mM ion concentrations are 90, 75 and 80%, respectively.
ion movement
Cations inside the d[G4(T4G4)3] quadruplex are not static, as demonstrated by several cross-peaks in NzExHSQC spectra, which are observed in addition to the four autocorrelation peaks in standard 1H–15N HSQC spectra (Figures 2C and 3). These cross-peaks clearly show that during mixing time (τm) a fraction of ions move from their initial binding site to another binding site within the G-quadruplex, or out into bulk solution. A two-letter code is used in Figure 3 to denote the initial and final locations of certain ions over the course of an NMR pulse sequence. A series of NzExHSQC spectra were acquired with different mixing times in the range from 13 ms to 3 s, and at several temperatures. Two initial observations are noteworthy. First, at short mixing times (up to ∼50 ms) the volumes of ion site-exchange cross-peaks grow more slowly than previously demonstrated for the bimolecular G-quadruplex of d(G4T4G4) (49,61). Thus, ion movement is slow within the unimolecular d[G4(T4G4)3] quadruplex in comparison to the dimeric d[G4T4G4]2 quadruplex (49). Second, certain autocorrelation peaks (e.g. O1 and I) persist for mixing times as long as 3 s and their signal intensities reduce more slowly than expected for cations participating in site exchange.
Figure 3.

Plot of 2D 15N–1H NzExHSQC spectrum (τm = 500 ms) of d[G4(T4G4)3] quadruplex at 293 K. The autocorrelation peaks are labeled with single letter, while the cross-peaks, which confirm movement of ions are labeled with two letters where the first indicates the initial and the second the final location. Asterisk denotes cross-peaks of deuterium isotopomers of ammonium ions.
Inspection of Figure 3 clearly demonstrates ion movement between the three binding sites within the d[G4(T4G4)3] quadruplex. A portion of ions from the inner binding site moved to two outer binding sites. Considerable overlap due to nearly identical 1H chemical shifts for ions bound at sites O1 and O2 resulted in the observation of only a single combined cross-peak for the movement of ions from the inner binding site, I, to both outer binding sites (i.e. IOx in Figure 3). However, upon close examination it becomes evident that the IOx cross-peak is not symmetric. This asymmetry reveals that more ions moved from the inner binding site to the site O1 in comparison to O2. ions are also observed to move from the outer binding sites to the inner binding site. We observed two resolved cross-peaks (i.e. O1I and O2I in Figure 3). A comparison of the O1I and O2I cross-peaks reveals that more ions move to the inner binding site from the site O1 than from O2.
The cross-peaks corresponding to exchange from the interior of the G-quadruplex into bulk solution were also observed (Figure 3). The cross-peak O2B is significantly more intense than O1B which suggests that more ions move into bulk through binding site O2. ions from bulk solution enter the interior of G-quadruplex almost exclusively through the O2 site, which leads to cross-peak BO2. The cross-peaks anticipated for movement of cations from bulk to O1 and I (i.e. BO1 and BI) are not observed above the noise level, presumably due to their low intensity and broad nature.
Some NzExHSQC cross-peaks in Figure 3 denote a two-step ion movement during the mixing time of the NMR experiment. The IB cross-peak corresponds to a two-step movement from binding site I into bulk via one of the outer binding sites. Exchange between the outer sites (O1O2 and O2O1) may also take place. However, the movement of between binding sites O1 and O2 cannot be experimentally substantiated by existing NzExHSQC spectra due to spectral overlap and low intensities of the relevant cross-peaks. Taken together, our qualitative analysis of cross-peak volumes reveals that there is no ion-channel-like net traffic of ions through the G-quadruplex. ions move back and forth between the binding sites within the G-quadruplex and exchange with ions in bulk solution.
Exchange rate constants for ion movement within d[G4(T4G4)3]
A quantitative analysis of ion movement was conducted based upon a series of NzExHSQC spectra where the mixing time (τm) was systematically increased from the lowest possible value of 13 ms, which is determined by the inherent delays of the pulse sequence and spectrometer hardware, to values over 1 s, where signal intensities are reduced significantly by nuclear spin relaxation. We attempted to completely analyze the relationship between autocorrelation and cross-peaks’ volume integrals as a function of mixing time in terms of ion movements. There are eight possible single-step ion movements taking place within the G-quadruplex and between the quadruplex and bulk solution. These exchange events are designated in our nomenclature as IO1, IO2, O1I, O2I, BO1, BO2, O1B and O2B. Only the cross-peaks corresponding to O1I and O2I could be quantitatively evaluated due to the above-mentioned spectral overlap and low signal intensity of cross-peaks corresponding to exchange with bulk solution. The complete analysis of all possible ion site exchange steps by simultaneous equations proved impossible to solve uniquely with the available experimental data because the number of competing exchange processes exceeds the number of experimental observables. Therefore, our analysis of ion movement has concentrated on individual processes, which afforded resolved cross-peaks in NzExHSQC spectra.
Each ion at any of the three binding sites within G-quadruplex can, in principle, move to either of two binding sites (which includes movement to bulk solution for cations initially at O1 and O2). An ion that moves from one binding site to the other can move back to its original binding site, to the next binding site or into the bulk solution, and so forth. The longer the mixing time, the more exchange scenarios (i.e. double, triple) that must be taken into consideration. In order to simplify our analysis, we have quantitatively analyzed only NzExHSQC spectra with mixing times up to 600 ms. The basic model in which ions are allowed to move from binding site 1 through the intermediate G-quartet plane to binding site 2 was introduced, Equation (1),
| 1 |
where k represents exchange rate constant. According to Equation (1), the volume of cross-peak corresponding to movement of ions to binding site 2 increases as a function of mixing time (τm). Exchange cross-peaks also decrease in intensity due to spin relaxation (T1). These two factors contribute to cross-peak volume and can be expressed by Equation (2).
| 2 |
Iterative least-square fitting of experimental O1I and O2I cross-peak volumes by optimizing k and T1 parameters in Equation (2) showed good agreement between experimental data and the simple model for exchange peak intensity (Figure 4). Exchange rate constants and T1 relaxation times are reported in Table 1. The largest individual discrepancy between the experimental data point and the fitted curve was 0.01 normalized volume units with low RMSD. The curve fitting of the data shown in Figure 4 confirmed that cross-peak volumes depend upon specific site-to-site exchange rates and T1 values for each site. At 283 K, ion movements from O1- and O2-binding sites into the inner binding site are relatively slow, with the low exchange rate constants of 0.05 and 0.07 s−1, respectively (Table 1). Both rates increase with increasing temperature. Exchange rate constants corresponding to the O1I and O2I processes are comparable in the temperature range from 283 to 303 K (Table 1). At 313 K, however, the exchange rate constant becomes greater for O1I (0.66 s−1) than for O2I process (0.50 s−1), which is clearly evident from examination of the experimentally observed cross-peak volumes in Figure 4B. T1 relaxation also plays a determining role for individual O1I and O2I cross-peak volumes at a given temperature (Table 1). Interestingly, T1 relaxation times are shorter for O2I in comparison to O1I cross-peak. As expected, T1 relaxation time is reduced when the temperature is increased from 293 to 313 K. At 283 K, T1 values are somewhat lower than expected because there is no clear inflection in the experimental data points, which makes the fitting procedure less sensitive to T1 values and thus its calculated value less accurate (Table 1).
Figure 4.

Relative volumes of cross-peaks as a function of mixing time (τm) at 283 K (A) and 313 K (B). Red open circles and black filled squares represent experimental data points for O1I and O2I cross-peaks, respectively. Curves represent the best fits of the experimental data to Equation (2).
Table 1.
Exchange rate constants (k) and longitudinal relaxation times (T1) for the movement of ions from the two outer into the inner binding sites
| T (K) | O1I process* | O2I process* | ||||
|---|---|---|---|---|---|---|
| k (s−1) | T1 (s) | RMSD | k (s−1) | T1 (s) | RMSD | |
| 283 | 0.05 (±0.01) | 0.77 (±0.26) | 0.00240 | 0.07 (±0.01) | 0.57 (±0.09) | 0.00304 |
| 293 | 0.16 (±0.01) | 0.80 (±0.11) | 0.00187 | 0.14 (±0.02) | 0.57 (±0.08) | 0.00191 |
| 303 | 0.36 (±0.04) | 0.60 (±0.09) | 0.00502 | 0.37 (±0.05) | 0.38 (±0.05) | 0.00413 |
| 313 | 0.66 (±0.05) | 0.46 (±0.04) | 0.00573 | 0.50 (±0.06) | 0.30 (±0.03) | 0.00395 |
*Values were obtained through iterative fitting of the experimental data to Equation (2). Quality of the individual fits is expressed as RMSD. Errors of individual k and T1 values are given in brackets.
A similar analysis was not possible for the reverse processes (i.e. IO1 and IO2) due to nearly identical chemical shifts of both cross-peaks in the 1H dimension of the NzExHSQC spectrum. The intensity of the IOx cross-peak therefore corresponds to the weighted sum of the two contributions. The volume integral of the IOx cross-peak is approximately equal to twice the sum of volumes of O1I and O2I cross-peaks at a given mixing time. According to Equation (2), the IOx cross-peak is characterized by two individual exchange rate constants and two longitudinal relaxation times for the IO1 and IO2 processes. These four variables could not be calculated by fitting the IOx experimental data set. The use of k and T1 values derived from O1I and O2I cross-peaks (Table 1) could not reproduce the experimentally observed volumes for IOx cross-peak using Equation (2). The amount of ions that move from binding site I to the outer binding sites is under steady-state conditions the same as the amount of ions moving back. However, individual cross-peaks that correspond to specific ion movement within the G-quadruplex are characterized with individual rate constants and T1 relaxation times that cannot be simply transferred from one to the other. The decrease of volume of a given cross-peak as a function of mixing time is a complex function of T1 relaxation at the initial and final binding sites as well as many other phenomena (e.g. proton exchange).
Movement of ions into bulk solution
The intensity of cross-peaks corresponding to ion movement from G-quadruplex into bulk is reduced due to proton exchange with bulk solvent. At neutral pH, exchange of protons is sufficiently fast that cross-peaks involving bulk ions (B) are broadened to baseline. The same applies for cross-peaks corresponding to the movement of ions into bulk solution from within the G-quadruplex. We were therefore able to follow the movement of ions into and from bulk solution only for samples with pH ≤ 6. The cross-peaks O1B and O2B showed distinct behavior as a function of mixing time (Figure 5). Movement of ions from the binding site O2 into bulk solution is characterized by the exchange rate constant of 0.75 s−1 at 293 K (Table 2). Observed changes in cross-peak volumes as a function of mixing time are fitted well by Equation (2) (Figure 5). The largest individual discrepancy between the experimental data points and the fitted curve was 0.03 normalized volume units, with low RMSD (Table 2). Movement of ions from binding site O1 to bulk solution is almost five times slower. The data obtained for both of these exchange processes are also influenced by relaxation. Curve fitting revealed that T1 relaxation time is more than twice as long for O1B in comparison to the O2B process (Table 2).
Figure 5.
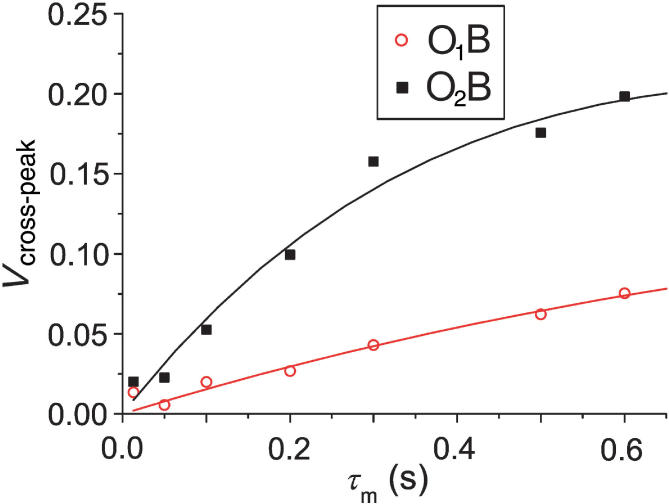
Relative volumes of O1B (red open circles) and O2B (black filled squares) cross-peaks as a function of mixing time (τm) at 293 K. Curves represent the best fit of the experimental data to Equation (2).
Table 2.
Exchange rate constants (k) and longitudinal relaxation times (T1) for the movement of ions from the outer binding sites into bulk solution at 293 K
| T (K) | O1B process* | O2B process* | ||||
|---|---|---|---|---|---|---|
| k (s−1) | T1 (s) | RMSD | k (s−1) | T1 (s) | RMSD | |
| 293 | 0.16 (±0.03) | 2.63 (±2.44) | 0.00478 | 0.75 (±0.08) | 1.19 (±0.27) | 0.00953 |
*See footnote to Table 1.
Quantitative analysis of autocorrelation peaks
The movement of ions from certain binding site results in exponential decrease of volume for the corresponding autocorrelation peak with increasing mixing time. Simultaneously autocorrelation peak is reduced by various types of relaxation. Attempts to fit our experimental data revealed that exponential function with a single rate constant does not adequately describe the observed decrease in autocorrelation peak volume (Vauto) as a function of mixing time (τm). However, good agreement with experimental data points was achieved using a biexponential function [Equation (3)],
| 3 |
where f is the fraction of autocorrelation peak decay through the faster relaxation mechanism, d1 and d2 are the rate constants of the fast and slow relaxation mechanisms, respectively. The use of Equation (3), where parameters f, d1 and d2 were freely optimized resulted in satisfactory agreement between the experimental data and calculated parameters (Figure 6). Reproducible optimized parameter sets were obtained from a wide range of starting parameters. The results of iterative fitting procedure are given in Table 3.
Figure 6.

Relative volumes of autocorrelation peaks as a function of mixing time (τm) at 283 K (A) and 313 K (B). Black filled squares, blue open triangles and red open circles represent the experimental points for the autocorrelation peaks I, O1 and O2, respectively. Curves represent the best fits of the experimental data to Equation (3).
Table 3.
Temperature dependence of parameters* describing volume integrals of autocorrelation peaks for ions within d[G4(T4G4)3]
| T (K) | f | d1 (s−1) | d2 (s−1) | RMSD |
|---|---|---|---|---|
| Binding site I | ||||
| 283 | 0.31 (±0.01) | 9.1 (±0.7) | 0.32 (±0.04) | 0.00178 |
| 293 | 0.27 (±0.02) | 10.2 (±1.4) | 0.57 (±0.06) | 0.00356 |
| 303 | 0.26 (±0.02) | 8.0 (±0.9) | 0.81 (±0.06) | 0.00166 |
| 313 | 0.3–0.6 | 4.0–8.0 | 0.4–1.3 | >0.00328 |
| Binding site O1 | ||||
| 283 | 0.37 (±0.02) | 8.8 (±0.8) | 0.76 (±0.07) | 0.00279 |
| 293 | 0.37 (±0.02) | 7.5 (±0.5) | 0.81 (±0.06) | 0.00170 |
| 303 | 0.31 (±0.02) | 8.7 (±0.7) | 1.32 (±0.06) | 0.00184 |
| 313 | 0.4–1.0 | 4.0–7.0 | 0.0–2.0 | >0.00220 |
| Binding site O2 | ||||
| 283 | 0.32 (±0.02) | 15.8 (±1.8) | 1.30 (±0.07) | 0.00384 |
| 293 | 0.33 (±0.02) | 14.1 (±1.7) | 1.82 (±0.09) | 0.00384 |
| 303 | 0.38 (±0.03) | 10.9 (±1.0) | 2.48 (±0.11) | 0.00188 |
| 313 | 0.4–0.8 | 8.0–14.0 | 1.5–3.5 | >0.00156 |
*Optimized values for fraction f and rate constants d1 and d2 were obtained through iterative fitting of experimental data to Equation (3). Quality of the individual fits is expressed as RMSD. Errors of individual f, d1 and d2 values are given in brackets.
The two rate constants d1 and d2 differ considerably for a given binding site and temperature (Table 3). The rate constant d1 is higher and cannot be correlated to the rate(s) of ion movement. Furthermore, the mechanism of decrease of volume of autocorrelation peak, which is not well understood, involves many terms including cross-correlated relaxation. The slow relaxation mechanism characterized by rate constant d2 accounts for the movement of ions from the binding site, which is combined with T1 relaxation. Dynamics of ion movement and T1 relaxation are accelerated with increasing temperature (Table 3), which is reflected in the observed increase in the rate constant d2. On the other hand, the fast relaxation mechanism characterized by rate constant d1 does not appear to be significantly influenced by increasing temperature. At the shortest mixing time of 13 ms, however, the autocorrelation peak is already reduced considerably, which renders the d1 rate constants less precisely defined. The values for individual binding sites at four temperatures are essentially the same, within experimental error. At 313 K, the rate constants d1 and d2 could not be determined unambiguously. Very good agreement between the experimental data points and Equation (3) was achieved for a range of d1 and d2 values, with an appropriate adjustment of parameter f (Table 3).
Activation energy
The temperature-dependent k values for the O1I and O2I processes from Table 1 were used to construct an Arrhenius plot (Figure 7). The extracted activation energies for exchange of ions from the outer sites to the inner site are 64.2 and 50.7 kJ mol−1 for O1I and O2I movements, respectively. Calculations according to Eyring theory indicate activation enthalpies (ΔH‡) and entropies (ΔS‡) of 60.7 kJ mol−1 and –53.8 J mol−1 K−1 for O1I and 48.3 kJ mol−1 and –95.8 J mol−1 K−1 for O2I.
Figure 7.

Arrhenius plot for O1I and O2I movements. Red open circles and black filled squares represent the experimental points for the cross-peaks O1I and O2I, respectively.
DISCUSSION
d[G4(T4G4)3] has been folded into unimolecular G-quadruplex in 130 mM aqueous solution of 15NH4Cl. This 28-mer sequence with the four G4 repeats folds into G-quadruplex with four G-quartets. Our NMR data on folded oligonucleotide in the presence of ions are consistent with the 3D structure determined earlier by Wang and Patel (1) in the presence of Na+ ions. Three ions have been localized within the intramolecular d[G4(T4G4)3] quadruplex structure. In addition, cations have been shown to move among their preferred binding sites within G-quadruplex and with bulk solution. Their movement has been analyzed in a quantitative manner through the interpretation of several cross-peaks in 2D 1H–15N NzExHSQC spectra.
Cross-peaks in NzExHSQC spectra corresponding to ions that have moved from one to the other binding site are very weak relative to the autocorrelation peaks especially in comparison to bulk. Initially cross-peak volumes increase with lengthening of mixing time as more and more ions move from their original locations. At certain mixing time (τm > 200 ms), inflection point is observed when relaxation overtakes ion movement, which results in decrease of cross-peak's volume. Two well-resolved cross-peaks (O1I and O2I) correspond to the movement of ions from the two outer binding sites into the inner binding site. For these two cross-peaks, individual exchange rate constants and relaxation times have been calculated. At 283 K, exchange rate constants for O1I and O2I processes are 0.05 and 0.07 s−1, respectively. The corresponding residence lifetimes are therefore 20 and 14 s. Temperature rise results in the increase in rate constants and concomitant shortening of residence lifetimes to 1.5 and 2.0 s for O1I and O2I processes at 313 K, respectively. Volumes of cross-peaks are further tuned by longitudinal relaxation. Analysis showed that O1I and O2I processes are characterized by T1 relaxation times of 0.77 and 0.57 s at 283 K, which are reduced to 0.46 and 0.30 s at 313 K, respectively. The third resolved cross-peak (IOx) corresponding to ion movement within d[G4(T4G4)3] G-quadruplex has been observed for the reverse movement, but did not offer sufficient chemical shift difference to analyze IO1 and IO2 cross-peaks individually. However, the asymmetry of IOx cross-peak has shown that more ions move from the inner binding site to the site O1 in comparison to O2.
Interpretation of kinetic data on movement of ions between the inside of the G-quadruplex and bulk solution is more challenging due to proton exchange with solvent. The loss in intensity of cross-peaks due to exchange with bulk proved to be considerable and highly pH dependent. The same goes for any cross-peaks for exchange with bulk. Three cross-peaks (O1B, O2B and IB) correspond to movement of ions from the binding sites within G-quadruplex to bulk. The fourth resolved cross-peak, BO2 corresponds to the movement of bulk ions into G-quadruplex. The O2B cross-peak is much more intense than O1B suggesting that most of the ions leave G-quadruplex through O2-binding site. Similarly, the vast majority of ions enter G-quadruplex through the O2-binding site. The BO2 cross-peak, however, exhibits broad line which prevents its quantitative analysis. We were able to calculate the individual exchange rate constants for O1B and O2B processes. Although they are not directly comparable to the exchange rate constants within d[G4(T4G4)3] due to loss by proton exchange, the O2B exchange rate constant of 0.75 s−1 at 293 K demonstrates that ion exchange with bulk is faster than exchange within the G-quadruplex. The comparison of O2B and O1B exchange rate constants shows that O2B process is roughly five times faster at 293 K.
Volumes of O1, I and O2 autocorrelation peaks are decreasing with mixing time (τm). The starting values (extrapolated to τm = 0 s) of the three peaks are not the same due to different ion occupancies of the binding sites. Qualitatively, the volumes for autocorrelation peaks for the two outer binding sites decrease at roughly the same rate, while decrease for the inner binding site is noticeably slower. The decrease of autocorrelation peak volumes has been described with a biexponential function of mixing time. All three autocorrelation peaks initially decay quickly with characteristic d1 values between 7.5 and 14.1 s−1 at 293 K. This fast relaxation process makes up from 26 to 38% of the total signal decay of autocorrelation peaks in the temperature range from 283 to 303 K. It is interesting to note that this fast process exhibits small if any temperature dependence. The second rate constant, d2, represents the sum of the rate constants for ion movements from a specific binding site and relaxation (1/T1) at that binding site. It increases with the rise in temperature. Its values are the lowest for the binding site I (e.g. 0.57 s−1 at 293 K) and the highest for O2 (e.g. 1.82 s−1 at 293 K). ions occupying binding site I experience longer T1 relaxation times than ions occupying the two outer binding sites.
The ionic radius of ion is too large to allow it a free passage through G-quartets. In comparison, the smaller Na+ ion can fit in the plane of a G-quartet which intimately facilitates its movement. It is noteworthy however, that the consideration of cation interactions of K+ and Na+ with respect to ions cannot be based solely on cation size. ions are potential hydrogen-bond donors, which is a feature that distinguishes them strongly from alkali cations. G-quartet has to open slightly for ion movement to occur. In this way, the rigidity of individual G-quartet is directly related to exchange rate constant. Movement within d[G4(T4G4)3] G-quadruplex requires partial opening of at least one of the inner G-quartets. The inner core of the G-quadruplex appears to be relatively rigid resulting in slow exchange rates of inner ions. On the other hand, the exchange rate constants through the outer G-quartets differ substantially which can be attributed to the different structure of T4 loops. One of the T4 loops near the binding site O1 spans the diagonal of the outer G-quartet. The diagonal loop makes the neighboring G-quartet tighter which is reflected in slower rates for movement of ions from O1-binding site. In addition, this loop represents steric barrier for the ion movement from bulk into the interior of G-quadruplex and vice versa. Two T4 loops on the other side of the G-quadruplex that span along the opposite edges of the outer G-quartet allow for the two halves of this G-quartet to open more easily upon the passage of ion(s). The two T4 loops can swing to the sides and allow easier passage of ions. The stiffness and steric hindrance contribute to the 5-fold difference in the exchange rate constants through the outer G-quartets in d[G4(T4G4)3] G-quadruplex.
The related sequence d[G4T4G4] consisting of 1.5 telomeric repeat of O. nova has been shown to exhibit three -ion-binding sites within its bimolecular G-quadruplex structure (49). ions move along the central axis of the G-quadruplex. The exchange rate constant of the central ion is 4 s−1 at 283 K (49,61), which is 80 times faster than in the case of unimolecular G-quadruplex studied here. Bimolecular d[G4T4G4]2 quadruplex is a symmetric system and there is a single cross-peak that experimentally demonstrates movement from the inner to the outer binding sites. In comparison, d[G4(T4G4)3] quadruplex exhibits two separate cross-peaks for the two outer binding sites (O1 and O2). Our analysis has shown that O1I and O2I exchange rate constants are comparable within the 283–303 K temperature range. At 313 K, however, O1I process becomes more efficient which suggests local thermal lability of d[G4(T4G4)3] G-quadruplex. A recent study based on quantitative analysis of h2JN2N7 coupling constants across hydrogen bonds revealed that the 5′ strand end is the most thermolabile region of bimolecular quadruplex adopted by d[G4T4G4]2 (63). The slower movement of ions within d[G4(T4G4)3] quadruplex results in slower decrease in intensity of autocorrelation peaks in comparison to d[G4T4G4]2. The actual volumes are the result of 15N longitudinal relaxation which depends on the structure of G-quadruplex. The combined effect of ion movement and T1 relaxation is manifested through autocorrelation peaks which persist till mixing times as long as 3 s in d[G4(T4G4)3] quadruplex. The current study adds insight to our understanding of the role of cations for stability as well as flexibility of G-quadruplex structures which are important factors in a control of assembly and disassembly of this unique DNA structures.
CONCLUSION
d[G4(T4G4)3] has been folded into unimolecular G-quadruplex in the presence of ions. NMR study confirmed that its topology is consistent with the 3D structure determined earlier by Wang and Patel (1) in the presence of Na+ ions. d[G4(T4G4)3] G-quadruplex exhibits four G-quartets with three -ion-binding sites. ions have been utilized as NMR probes to localize cations within the intramolecular d[G4(T4G4)3] quadruplex and follow their movement amongst the preferred binding sites within G-quadruplex and with bulk solution. Quantitative analysis has clearly shown that there is no unidirectional ion movement through the central cavity of the G-quadruplex. ion movement is controlled by thermodynamic preferences of individual binding sites, steric restraints of G-quartets for ion passage and structure of T4 loops. The analysis of volumes of two well-resolved cross-peaks (O1I and O2I) corresponding to the movement of ions from the two outer binding sites into the inner binding site afforded the exchange rate constants of 0.05 and 0.07 s−1 at 283 K. Temperature rise results in the increase in rate constants to 0.66 and 0.50 s−1 for O1I and O2I processes at 313 K, respectively. Volumes of cross-peaks are further tuned by T1 relaxation. The O2B exchange rate constant of 0.75 s−1 at 293 K demonstrates that ion exchange with bulk is faster than exchange within the G-quadruplex. Furthermore, the comparison of O2B and O1B exchange rate constants shows that O2B process is roughly five times faster at 293 K. The results presented in this article show that structural details define stiffness of G-quadruplex structure that intimately affects cation () movement. In this way, experimental NMR data on dynamics of cation movement can serve as a probe into (non)flexibility of specific regions of quadruplex structures.
ACKNOWLEDGEMENTS
We thank Slovenian Research Agency (ARRS) and the Ministry of Higher Education, Science and Technology of the Republic of Slovenia (Grant Nos. P1-0242-0104 and J1-6140-0104) for their financial support. Financial support from NATO Collaborative Programs Section (CLG grant 979520) to the authors is gratefully acknowledged. Funding to pay the Open Access publication charges for this article was provided by ARRS.
Conflict of interest statement. None declared.
REFERENCES
- 1.Wang Y, Patel DJ. Solution structure of the Oxytricha telomeric repeat d[G4(T4G4)3] G-tetraplex. J. Mol. Biol. 1995;251:76–94. doi: 10.1006/jmbi.1995.0417. [DOI] [PubMed] [Google Scholar]
- 2.Gellert M, Lipsett M, Davies DR. Helix formation by guanylic acid. Proc. Natl Acad. Sci. USA. 1962;48:2013–2018. doi: 10.1073/pnas.48.12.2013. [DOI] [PMC free article] [PubMed] [Google Scholar]
- 3.Neidle S, Balasubramanian S, editors. Quadruplex Nucleic Acids. Cambridge: The Royal Society of Chemistry; 2006. (Monography for a recent review on G-guadruplex nucleic acids) [Google Scholar]
- 4.Keniry MA. Quadruplex structures in nucleic acids. Biopolymers. 2001;56:123–146. doi: 10.1002/1097-0282(2000/2001)56:3<123::AID-BIP10010>3.0.CO;2-3. [DOI] [PubMed] [Google Scholar]
- 5.Schaffitzel C, Berger I, Postberg J, Hanes J, Lipps HJ, Pluckthun A. In vitro generated antibodies specific for telomeric guanine-quadruplex DNA react with Stylonychia lemnae macronuclei. Proc. Natl Acad. Sci. USA. 2001;98:8572–8577. doi: 10.1073/pnas.141229498. [DOI] [PMC free article] [PubMed] [Google Scholar]
- 6.Dai JX, Dexheimer TS, Chen D, Carver M, Ambrus A, Jones RA, Yang DZ. An intramolecular G-quadruplex structure with mixed parallel/antiparallel G-strands formed in the human BCL-2 promoter region in solution. J. Am. Chem. Soc. 2006;128:1096–1098. doi: 10.1021/ja055636a. [DOI] [PMC free article] [PubMed] [Google Scholar]
- 7.Ambrus A, Chen D, Dai JX, Jones RA, Yang DZ. Solution structure of the biologically relevant G-quadruplex element in the human c-MYC promoter. Implications for G-quadruplex stabilization. Biochemistry. 2005;44:2048–2058. doi: 10.1021/bi048242p. [DOI] [PubMed] [Google Scholar]
- 8.Phan AT, Kuryavyi V, Gaw HY, Patel DJ. Small-molecule interaction with a five-guanine-tract G-quadruplex structure from the human MYC promoter. Nat. Chem. Biol. 2005;1:167–173. doi: 10.1038/nchembio723. [DOI] [PMC free article] [PubMed] [Google Scholar]
- 9.Siddiqui-Jain A, Grand CL, Bearss DJ, Hurley LH. Direct evidence for a G-quadruplex in a promoter region and its targeting with a small molecule to repress c-MYC transcription. Proc. Natl Acad. Sci. USA. 2002;99:11593–11598. doi: 10.1073/pnas.182256799. [DOI] [PMC free article] [PubMed] [Google Scholar]
- 10.Phan AT, Kuryavyi V, Patel DJ. DNA architecture: from G to Z. Curr. Opin. Struct. Biol. 2006;16:288–298. doi: 10.1016/j.sbi.2006.05.011. [DOI] [PMC free article] [PubMed] [Google Scholar]
- 11.Wyatt JR, Vickers TA, Roberson JL, Buckheit RW, Ecker DJ. Combinatorially selected guanosine-quartet structure is a potent inhibitor of human immunodeficiency virus envelope-mediated cell fusion. Proc. Natl Acad. Sci. USA. 1994;91:1356–1360. doi: 10.1073/pnas.91.4.1356. [DOI] [PMC free article] [PubMed] [Google Scholar]
- 12.Jing NJ, Marchand C, Liu J, Mitra R, Hogan ME, Pommier Y. Mechanism of inhibition of HIV-1 integrase by G-tetrad forming oligonucleotides in vitro. J. Biol. Chem. 2000;275:21460–21467. doi: 10.1074/jbc.M001436200. [DOI] [PubMed] [Google Scholar]
- 13.Lew A, Rutter WJ, Kennedy GC. Unusual DNA structure of the diabetes susceptibility locus IDDM2 and its effect on transcription by the insulin promoter factor Pur-1/MAZ. Proc. Natl Acad. Sci. USA. 2000;97:12508–12512. doi: 10.1073/pnas.97.23.12508. [DOI] [PMC free article] [PubMed] [Google Scholar]
- 14.Simonsson T. G-quadruplex DNA structures – variations on a theme. Biol. Chem. 2001;382:621–628. doi: 10.1515/BC.2001.073. [DOI] [PubMed] [Google Scholar]
- 15.Xu Y, Sugiyama H. Formation of the G-quadruplex and i-motif structures in retinoblastoma susceptibility genes (Rb) Nucleic Acids Res. 2006;34:949–954. doi: 10.1093/nar/gkj485. [DOI] [PMC free article] [PubMed] [Google Scholar]
- 16.Neidle S, Read MA. G-quadruplexes as therapeutic targets. Biopolymers. 2001;56:195–208. doi: 10.1002/1097-0282(2000)56:3<195::AID-BIP10009>3.0.CO;2-5. [DOI] [PubMed] [Google Scholar]
- 17.Rezler EM, Bearss DJ, Hurley LH. Telomeres and telomerases as drug targets. Curr. Opin. Pharmacol. 2002;2:415–423. doi: 10.1016/s1471-4892(02)00182-0. [DOI] [PubMed] [Google Scholar]
- 18.Seenisamy J, Bashyam S, Gokhale V, Vankayalapati H, Sun D, Siddiqui-Jain A, Streiner N, Shin-ya K, White E, et al. Design and synthesis of an expanded porphyrin that has selectivity for the c-MYC G-quadruplex structure. J. Am. Chem. Soc. 2005;127:2944–2959. doi: 10.1021/ja0444482. [DOI] [PubMed] [Google Scholar]
- 19.Smith FW, Feigon J. Quadruplex structure of Oxytricha telomeric DNA oligonucleotides. Nature. 1992;356:164–168. doi: 10.1038/356164a0. [DOI] [PubMed] [Google Scholar]
- 20.Laughlan G, Murchie AIH, Norman DG, Moore MH, Moody PCE, Lilley DMJ, Luisi B. The high-resolution crystal-structure of a parallel-stranded guanine tetraplex. Science. 1994;265:520–524. doi: 10.1126/science.8036494. [DOI] [PubMed] [Google Scholar]
- 21.Neidle S, Parkinson GN. The structure of telomeric DNA. Curr. Opin. Struct. Biol. 2003;13:275–283. doi: 10.1016/s0959-440x(03)00072-1. [DOI] [PubMed] [Google Scholar]
- 22.Davis JT. G-quartets 40 years later: from 5′-GMP to molecular biology and supramolecular chemistry. Angew. Chem. Int. Ed. 2004;43:668–698. doi: 10.1002/anie.200300589. [DOI] [PubMed] [Google Scholar]
- 23.Hud NV, Plavec J. The role of cations in determining quadruplex structure and stability. In: Neidle S, Balasubramanian S, editors. Quadruplex Nucleic Acids. Cambridge: The Royal Society of Chemistry; 2006. pp. 100–130. [Google Scholar]
- 24.Smith FW, Lau FW, Feigon J. d(G3T4G3) forms an asymmetric diagonally looped dimeric quadruplex with guanosine 5′-syn-syn-anti and 5′-syn-syn-anti N-glycosidic conformations. Proc. Natl Acad. Sci. USA. 1994;91:10546–10550. doi: 10.1073/pnas.91.22.10546. [DOI] [PMC free article] [PubMed] [Google Scholar]
- 25.Strahan GD, Keniry MA, Shafer RH. NMR structure refinement and dynamics of the K+-[d(G3T4G3)]2 quadruplex via particle mesh Ewald molecular dynamics simulations. Biophys. J. 1998;75:968–981. doi: 10.1016/S0006-3495(98)77585-X. [DOI] [PMC free article] [PubMed] [Google Scholar]
- 26.Keniry MA, Strahan GD, Owen EA, Shafer RH. Solution structure of the Na+ form of the dimeric quadruplex [d(G3T4G3)]2. Eur. J. Biochem. 1995;233:631–643. doi: 10.1111/j.1432-1033.1995.631_2.x. [DOI] [PubMed] [Google Scholar]
- 27.Petraccone L, Erra E, Esposito V, Randazzo A, Mayol L, Nasti L, Barone G, Giancola C. Stability and structure of telomeric DNA sequences forming quadruplexes containing four G-tetrads with different topological arrangements. Biochemistry. 2004;43:4877–4884. doi: 10.1021/bi0300985. [DOI] [PubMed] [Google Scholar]
- 28.Wang KY, Kumar S, Pham TQ, Marathias VM, Swaminathan S, Bolton PH. Determination of the number and location of the manganese binding sites of DNA quadruplexes in solution by EPR and NMR in the presence and absence of thrombin. J. Mol. Biol. 1996;260:378–394. doi: 10.1006/jmbi.1996.0408. [DOI] [PubMed] [Google Scholar]
- 29.Chen FM. Sr2+ facilitates intermolecular G-quadruplex formation of telomeric sequences. Biochemistry. 1992;31:3769–3776. doi: 10.1021/bi00130a006. [DOI] [PubMed] [Google Scholar]
- 30.Miyoshi D, Nakao A, Toda T, Sugimoto N. Effect of divalent cations on antiparallel G-quartet structure of d(G4T4G4) FEBS Lett. 2001;496:128–133. doi: 10.1016/s0014-5793(01)02416-4. [DOI] [PubMed] [Google Scholar]
- 31.Miyoshi D, Nakao A, Sugimoto N. Structural transition from antiparallel to parallel G-quadruplex of d(G4T4G4) induced by Ca2+ Nucleic Acids Res. 2003;31:1156–1163. doi: 10.1093/nar/gkg211. [DOI] [PMC free article] [PubMed] [Google Scholar]
- 32.Hardin CC, Perry AG, White K. Thermodynamic and kinetic characterization of the dissociation and assembly of quadruplex nucleic acids. Biopolymers. 2001;56:147–194. doi: 10.1002/1097-0282(2000/2001)56:3<147::AID-BIP10011>3.0.CO;2-N. [DOI] [PubMed] [Google Scholar]
- 33.Miura T, Benevides JM, Thomas GJ. A phase-diagram for sodium and potassium-ion control of polymorphism in telomeric DNA. J. Mol. Biol. 1995;248:233–238. doi: 10.1016/s0022-2836(95)80046-8. [DOI] [PubMed] [Google Scholar]
- 34.Schultze P, Hud NV, Smith FW, Feigon J. The effect of sodium, potassium and ammonium ions on the conformation of the dimeric quadruplex formed by the Oxytricha nova telomere repeat oligonucleotide d(G4T4G4) Nucleic Acids Res. 1999;27:3018–3028. doi: 10.1093/nar/27.15.3018. [DOI] [PMC free article] [PubMed] [Google Scholar]
- 35.Crnugelj M, Hud NV, Plavec J. The solution structure of d(G4T4G3)2: a bimolecular G-quadruplex with a novel fold. J. Mol. Biol. 2002;320:911–924. doi: 10.1016/s0022-2836(02)00569-7. [DOI] [PubMed] [Google Scholar]
- 36.Crnugelj M, Sket P, Plavec J. Small change in a G-rich sequence, a dramatic change in topology: new dimeric G-quadruplex folding motif with unique loop orientations. J. Am. Chem. Soc. 2003;125:7866–7871. doi: 10.1021/ja0348694. [DOI] [PubMed] [Google Scholar]
- 37.Sket P, Crnugelj M, Plavec J. d(G3T4G4) forms unusual dimeric G-quadruplex structure with the same general fold in the presence of K+, Na+ or ions. Bioorg. Med. Chem. 2004;12:5735–5744. doi: 10.1016/j.bmc.2004.08.009. [DOI] [PubMed] [Google Scholar]
- 38.Sket P, Crnugelj M, Plavec J. Identification of mixed di-cation forms of G-quadruplex in solution. Nucleic Acids Res. 2005;33:3691–3697. doi: 10.1093/nar/gki690. [DOI] [PMC free article] [PubMed] [Google Scholar]
- 39.Cevec M, Plavec J. Role of loop residues and cations on the formation and stability of dimeric DNA G-quadruplexes. Biochemistry. 2005;44:15238–15246. doi: 10.1021/bi0514414. [DOI] [PubMed] [Google Scholar]
- 40.Wang Y, Patel DJ. Solution structure of the human telomeric repeat d[AG3(T2AG3)3] G-tetraplex. Structure. 1993;1:263–282. doi: 10.1016/0969-2126(93)90015-9. [DOI] [PubMed] [Google Scholar]
- 41.Parkinson GN, Lee PPH, Neidle S. Crystal structure of parallel quadruplexes from human telomeric DNA. Nature. 2002;417:876–880. doi: 10.1038/nature755. [DOI] [PubMed] [Google Scholar]
- 42.Li J, Correia JJ, Wang L, Trent JO, Chaires JB. Not so crystal clear: the structure of the human telomere G-quadruplex in solution differs from that present in a crystal. Nucleic Acids Res. 2005;33:4649–4659. doi: 10.1093/nar/gki782. [DOI] [PMC free article] [PubMed] [Google Scholar]
- 43.Luu KN, Phan AT, Kuryavyi V, Lacroix L, Patel DJ. Structure of the human telomere in K+ solution: an intramolecular (3 + 1) G-quadruplex scaffold. J. Am. Chem. Soc. 2006;128:9963–9970. doi: 10.1021/ja062791w. [DOI] [PMC free article] [PubMed] [Google Scholar]
- 44.Ambrus A, Chen D, Dai JX, Bialis T, Jones RA, Yang DZ. Human telomeric sequence forms a hybrid-type intramolecular G-quadruplex structure with mixed parallel/antiparallel strands in potassium solution. Nucleic Acids Res. 2006;34:2723–2735. doi: 10.1093/nar/gkl348. [DOI] [PMC free article] [PubMed] [Google Scholar]
- 45.Xu Y, Noguchi Y, Sugiyama H. The new models of the human telomere d[AGGG(TTAGGG)3] in K+ solution. Bioorg. Med. Chem. 2006;14:5584–5591. doi: 10.1016/j.bmc.2006.04.033. [DOI] [PubMed] [Google Scholar]
- 46.Haider S, Parkinson GN, Neidle S. Crystal structure of the potassium form of an Oxytricha nova G-quadruplex. J. Mol. Biol. 2002;320:189–200. doi: 10.1016/S0022-2836(02)00428-X. [DOI] [PubMed] [Google Scholar]
- 47.Phillips K, Dauter Z, Murchie AIH, Lilley DMJ, Luisi B. The crystal structure of a parallel-stranded guanine tetraplex at 0.95 angstrom resolution. J. Mol. Biol. 1997;273:171–182. doi: 10.1006/jmbi.1997.1292. [DOI] [PubMed] [Google Scholar]
- 48.Horvath MP, Schultz SC. DNA G-quartets in a 1.86 angstrom resolution structure of an Oxytricha nova telomeric protein-DNA complex. J. Mol. Biol. 2001;310:367–377. doi: 10.1006/jmbi.2001.4766. [DOI] [PubMed] [Google Scholar]
- 49.Hud NV, Schultze P, Sklenar V, Feigon J. Binding sites and dynamics of ammonium ions in a telomere repeat DNA quadruplex. J. Mol. Biol. 1999;285:233–243. doi: 10.1006/jmbi.1998.2327. [DOI] [PubMed] [Google Scholar]
- 50.Deng H, Braunlin WH. Kinetics of sodium ion binding to DNA quadruplexes. J. Mol. Biol. 1996;255:476–483. doi: 10.1006/jmbi.1996.0039. [DOI] [PubMed] [Google Scholar]
- 51.Basu S, Szewczak A, Cocco M, Strobel SA. Direct detection of monovalent metal ion binding to a DNA G-quartet by 205Tl NMR. J. Am. Chem. Soc. 2000;122:3240–3241. [Google Scholar]
- 52.Wu G, Wong A. Direct detection of the bound sodium ions in self-assembled 5′-GMP gels: a solid-state 23Na NMR approach. Chem. Commun. 2001:2658–2659. [Google Scholar]
- 53.Wong A, Fettinger JC, Forman SL, Davis JT, Wu G. The sodium ions inside a lipophilic G-quadruplex channel as probed by solid-state 23Na NMR. J. Am. Chem. Soc. 2002;124:742–743. doi: 10.1021/ja0120330. [DOI] [PubMed] [Google Scholar]
- 54.Wu G, Wong A, Gan ZH, Davis JT. Direct detection of potassium cations bound to G-quadruplex structures by solid-state 39K NMR at 19.6 T. J. Am. Chem. Soc. 2003;125:7182–7183. doi: 10.1021/ja0340634. [DOI] [PubMed] [Google Scholar]
- 55.Wong A, Wu G. Selective binding of monovalent cations to the stacking G-quartet structure formed by guanosine 5′-monophosphate: a solid-state NMR study. J. Am. Chem. Soc. 2003;125:13895–13905. doi: 10.1021/ja0302174. [DOI] [PubMed] [Google Scholar]
- 56.Wu G, Wong A. Solid-state 23Na NMR determination of the number and coordination of sodium cations bound to Oxytricha nova telomere repeat d(G4T4G4) Biochem. Biophys. Res. Commun. 2004;323:1139–1144. doi: 10.1016/j.bbrc.2004.08.210. [DOI] [PubMed] [Google Scholar]
- 57.Gill ML, Strobel SA, Loria JP. 205Tl NMR methods for the characterization of monovalent cation binding to nucleic acids. J. Am. Chem. Soc. 2005;127:16723–16732. doi: 10.1021/ja055358f. [DOI] [PubMed] [Google Scholar]
- 58.Wong A, Ida R, Wu G. Direct NMR detection of the “invisible” alkali metal cations tightly bound to G-quadruplex structures. Biochem. Biophys. Res. Commun. 2005;337:363–366. doi: 10.1016/j.bbrc.2005.08.275. [DOI] [PubMed] [Google Scholar]
- 59.Ida R, Wu G. Solid-state 87Rb NMR signatures for rubidium cations bound to a G-quadruplex. Chem. Commun. 2005:4294–4296. doi: 10.1039/b505674h. [DOI] [PubMed] [Google Scholar]
- 60.Hud NV, Schultze P, Feigon J. Ammonium ion as an NMR probe for monovalent cation coordination sites of DNA quadruplexes. J. Am. Chem. Soc. 1998;120:6403–6404. [Google Scholar]
-
61.Sket P, Crnugelj M, Kozminski W, Plavec J. ion movement inside d(G4T4G4)2 G-quadruplex is accelerated in the presence of smaller Na+ ions. Org. Biomol. Chem. 2004;2:1970–1973. doi: 10.1039/b406815g. [DOI] [PubMed] [Google Scholar]
- 62.Ma L, Iezzi M, Kaucher MS, Lam YF, Davis JT. Cation exchange in lipophilic G-quadruplexes: not all ion binding sites are equal. J. Am. Chem. Soc. 2006;128:15269–15277. doi: 10.1021/ja064878n. [DOI] [PubMed] [Google Scholar]
- 63.Dingley AJ, Peterson RD, Grzesiek S, Feigon J. Characterization of the cation and temperature dependence of DNA quadruplex hydrogen bond properties using high-resolution NMR. J. Am. Chem. Soc. 2005;127:14466–14472. doi: 10.1021/ja0540369. [DOI] [PubMed] [Google Scholar]