Abstract
Habitat fragmentation may strongly affect species density, species interactions, and the rate of ecosystem processes. It is therefore important to understand the observed variability among species responses to fragmentation and the underlying mechanisms. In this study, we compare density–area relationships (DARs) for 344 lepidopteran species belonging to 22 families (butterflies and moths). This analysis suggested that the DARslope is generally positive for moths and negative for butterflies. The differences are suggested to occur because moths are largely olfactory searchers, whereas most butterflies are visual searchers. The analysis also suggests that DARs vary as a function of habitat specialization and body size. In butterflies, generalist species had a more negative DARslope than specialist species because of a lower patch size threshold. In moths, the differences in DARslope between forest and open habitat species were large for small species but absent for large species. This difference is argued to occur because the DARslope in large species mainly reflects their search mode, which does not necessarily vary between moth groups, whereas the slope in small species reflects population growth rates.
Keywords: butterflies and moths, habitat fragmentation, Lepidoptera, life history traits, olfactory and visual information
Fragmentation of natural habitats is a serious threat to biodiversity worldwide and is a central issue in conservation biology research (1–4). The negative effects arise for several reasons, as habitat fragmentation is a complex process involving changes in both the size and spatial arrangement of habitat patches (5). Three hypotheses are mainly used to explain the species loss: First, smaller and more isolated patches will increase local extinction rates and decrease dispersal rates among patches (6). Second, the reduction in patch size and increase in edge habitats will increase the density of generalists and matrix specialists, and this increase may both negatively affect habitat specialists (7) and mask fragmentation effects on species richness (2). Third, increasing fragmentation may change the habitat quality with potentially negative effects on local growth rates (8). All of these mechanisms point to an important role of patch size in understanding species responses to fragmentation, but they also indicate that species are not likely to have common responses to habitat fragmentation.
Although it is well established, from a theoretical and empirical perspective, that abundance is almost always reduced with a reduction in patch size, the effect on density is much more variable among species. Recent studies suggest that almost any pattern, negative, positive, or nonlinear, can be observed in relationships between patch size and density (9–11). This variability is as important to understand from a conservation perspective as the effect on species abundance for the simple reason that density effects are likely to be closely related to the strength of species interactions and to the functioning of ecosystems. Several studies also show that fragmentation may lead to reduced pollination, seed dispersal, parasitism, and decomposition rates (12–14).
Multiple hypotheses have been proposed to explain the interspecific variability in density along patch size gradients, such as variability in search mode, trophic specialization, or density dependence (10, 15–17). Irrespective of mechanism, the understanding of species responses to patch size is centered on the relative role of local and regional processes. In general, local patch processes are more important for density in large patches whereas regional processes are more important in small patches. Similarly, local patch processes are more important for habitat specialists than for generalist species. As a consequence, there is a strong emphasis in conservation and basic ecological research on the scale of population responses to habitat heterogeneity (18, 19). A general pattern appearing from this research is the role of body size, because large body sizes are often related to large area requirements and also to an increased mobility and a reduced reliance on local habitats (2, 18, 20). This pattern suggests that responses to patch size, and density–area relationships (DARs), are also governed by body size. The effect of body size should, however, be analyzed together with habitat specialization because the role of dispersal processes for animal densities strongly depends on local growth rates (10).
In this paper, we use a theoretical model to predict the role of local and regional processes in DAR. We then test our predictions by using empirical data on DARs in multiple independent sites for 344 lepidopteran species belonging to 22 families (moths and butterflies) in Europe and the United States. The reasons for selecting these species are the following: (i) the availability of large data sets, (ii) the representation of a broad range of life history traits among species, and (iii) because theory on DARs suggests different patch size responses in visual searchers, such as diurnal butterflies, and olfactory searchers, such as nocturnal moths (10). Using three data sets, one on butterfly responses to fragmentation of calcareous grasslands and two on moth responses to forest fragmentation, we analyzed four primary questions. First, we compared the DARslope of moth and butterfly species, using each fragment as an independent sample. Second, using published data, we divided species based on their preference for patch or matrix habitats. We then compared the DARslope of habitat specialists, generalists, edge species, and matrix specialists to test the prediction that the DARslope for habitat specialists is more positive than for other groups. Third, we examined whether observed differences between habitat specialists and generalists could be attributed to differences in patch size threshold by testing whether differences disappeared when removing small patches with zero density. Finally, we included wing span in the analysis to test the hypothesis that large species should have DARs that reflect immigration–emigration dynamics, whereas small species should have DARs that reflect local growth.
Theoretical Background.
As a framework for examining the role of local and regional processes on population density (n), we used the following model that allows migration rates to vary with patch size (10):
In this equation, r is the relative growth rate, E is the relative emigration rate, I is the absolute number of immigrants per unit area, ε and i are the corresponding emigration and immigration rates for a patch with unit area, and β and ζ are parameters scaling emigration and immigration to patch area (A). In the model, we assume that r is area-independent, but we note that Allee effects may reduce r in small patches and cause a more positive DARslope, whereas edge effects may cause deviations in both directions. Based on this model, P.A.H and G.E. derived the following relationship between population density at time t and patch area:
and the slope in the DAR can then be described as
 |
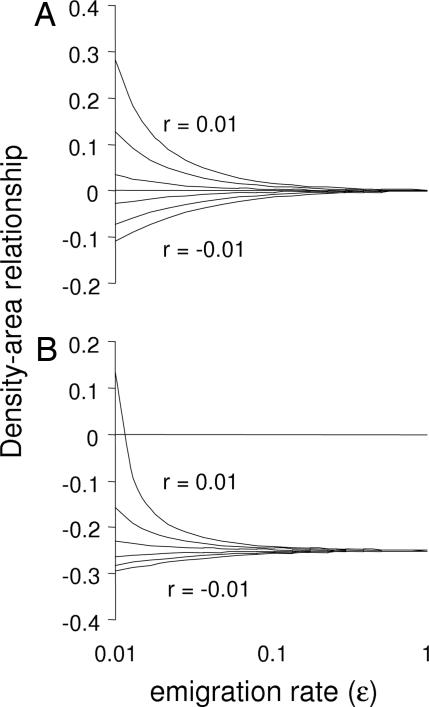
The first term in Eqs. 2 and 3 shows the stable density distribution, and the second term shows the temporal trend. In the following, we ignore the temporal trend because all patches in this study are at least 30 years old. First, these equations show that the DARslope depends on a balance between local and regional processes and that regional processes are more important for species with a high migration rate relative to r. When the emigration rate (ε) is sufficiently large in relation to r, then the DARslope is dominated by a balance of the scaling relationships for immigration and emigration rates (β and ζ) (Fig. 1). In fact, when r = 0, then DARslope = β − ζ. When r is sufficiently large in relation to the emigration rate, however, then the DARslope is positive for r > 0 and negative for r < 0 (Fig. 1). This difference corresponds to the difference between a habitat and matrix specialist, because habitat specialists are expected to have r > 0 whereas matrix specialists are expected to have r < 0 in the patch. Hence, the simple prediction would be that the DARslope is positive for habitat specialists and negative for matrix specialists, but the quantitative outcome depends on the emigration rate ε and on the magnitude of β and ζ. Because species with a high ε should have a DARslope that is determined by β and ζ, species with high migration rates should have a more shallow slope than species with low migration rates, when β≈ζ (Fig. 1A). Hence, a habitat specialist with a low migration rate should have a more positive DARslope than a habitat specialist with a high migration rate, and a matrix specialist with a low migration rate should have a more negative DARslope than a matrix specialist with high migration rate. When β ≠ ζ, we could instead expect the sign in the DARslope to change with the species migration rate (Fig. 1B). Responses by habitat generalists are likely to be intermediate between patch and matrix specialists, but the quantitative outcome depends on the difference in r between patch and matrix habitats.
Fig. 1.
Predicted DARs (Eq. 3) in relation to emigration rate for a range of local growth rates (from the bottom, r = −0.01, −0.006, −0.002, 0.002, 0.006, and 0.01) and for species with equal area scaling of emigration and immigration rates (β = ζ = 0.3) (A) or more shallow area scaling of emigration rates (β = 0.1, ζ = 0.35) (B). The area scaling of migration rates in A and B corresponds to published information about moth and butterfly species.
When translating these general predictions to specific predictions for lepidopteran species, we should consider characteristics affecting both migration rates (ε and i) and the area scaling of these rates. Movement and migration rates in lepidopterans generally increase with several body size measures (21, 22), although some groups are highly sedentary irrespective of body size (22, 23). In this study, we use wing span both because this measure is easily accessible and because field studies have found strong correlations between wing span and migration rates (22). For area scaling, the data are limited. For moths, only one study has quantified migration rates, for noctuids, in a patch size gradient, and this study suggests that β ≈ ζ (22). A larger data set exists for butterflies (24), suggesting that β < ζ. These differences between moth and butterfly species may be a consequence of their distinct search modes, because most moth species are nocturnal and rely on olfactory cues for host location whereas butterfly species are diurnal and mainly rely on visual cues (25). Dissimilar search modes may translate into differences in area-scaling relationships because edges are perceived differently by visual and olfactory searchers, and insect responses to these cues may have a different scaling with patch size (26). Irrespective of the mechanism, the observed difference in the area scaling of migration rates would translate into differences in DARslope (Fig. 1).
Predictions.
Based on this analysis, we arrive at three predictions for lepidopteran DAR. (a) Moths should have a more positive DARslope than butterflies, with the exception of zygaenid moths that are diurnal and similar to butterflies in most ecological aspects (27). (b) Habitat specialists should have a more positive DARslope than matrix specialists or generalists. Because this prediction may arise as a consequence of both search behavior, as described above, and higher patch size thresholds in habitat specialists, we tested the prediction both on the total data set and on a reduced data set without small empty patches. (c) There should be an interaction between migration rates and the degree of habitat specialization on the DARslope; the slope should be negatively related to wing span for habitat specialists and positively related to wing span for matrix specialists (Fig. 1).
The predictions were tested on three data sets, one on butterflies and two on moths, and for each species we estimated a separate DARslope. To test predictions a and b, we performed metaanalyses using a random model and the bootstrap procedure in MetaWin 2.0 (28), and to test prediction c, we performed an analysis of covariance using wing span, continent, and habitat preference as independent variables. In all analyses, weighted means of scaling coefficients were calculated using the inverse of sample variances as weights (29). For moths, prediction c was restricted to geometrids and noctuids because there are few data for other moth families. We also tested the generality of DARslope with a paired t test by identifying 21 pairs of closely related moth species in the two data sets [supporting information (SI) Table 2].
Results
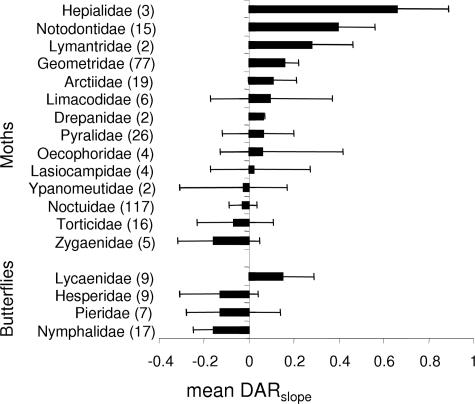
The mean slope for all species was slightly positive [0.048 ± 0.035, mean ± bias-corrected confidence interval (C.I.)] but with a substantial heterogeneity among taxa (SI Tables 3–5). When comparing the broad groups of nocturnal moths and butterflies, we found as predicted that the DARslope was more positive for moths (0.076 ± 0.038) than for butterflies (−0.098 ± 0.079; total heterogeneity Q = 7.1, df = 1, P = 0.004). The same general pattern was also apparent when we repeated the analyses at the family level, but we also found differences among families (Fig. 2). First, all butterfly families had nonsignificant or negative DARslope with the exception of Lycaenidae, which had a positive slope. Second, moth families had a mean DARslope between −0.16 for Zygaenidae and 0.66 for Hepialidae. Some of this variability may be due to low sample sizes for some families, but the variability may also reflect ecological differences among families. It is however notable that all moth families except the diurnal zygaenid moths had a mean DARslope that was more positive than the mean butterfly DARslope.
Fig. 2.
DARslope of moth and butterfly families (mean ± bias-corrected C.I.). Number of species is given within parentheses.
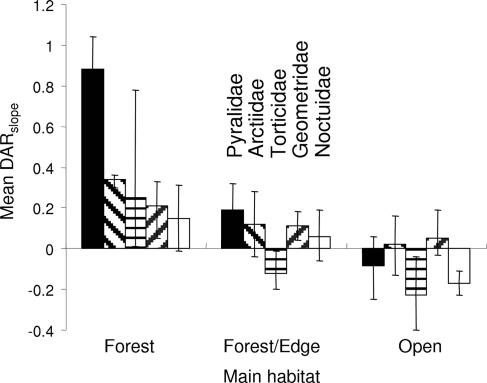
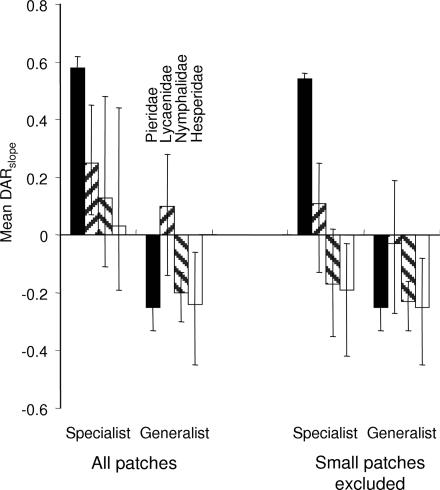
When we tested the role of habitat preference on the DARslope, we found as predicted that habitat specialists had more positive slopes than other groups. For moth species, the mean DARslope was increasingly negative with a decreasing dependence on forest habitats (Q = 37.6, df = 2, P = 0.001, Fig. 3), and the pattern was the same when excluding small empty patches (Q = 27.3, df = 2, P = 0.001). For butterflies, specialized species had a more positive DARslope than generalist species (Q = 4.8, df = 1, P = 0.002, Fig. 4), but this difference did not occur when we excluded small empty patches (Q = 0.9, df = 1, P = 0.07, Fig. 4). Both responses were consistent among families, except for Pieridae, but this exception should be interpreted cautiously because the sample size for specialist Pieridae was very small (n = 2). Overall, the results suggest that different DARslope for generalist and specialist butterfly species arise because specialists are unable to persist in small patches. The different responses by moths and butterflies are difficult to interpret, but it is possible that butterflies are more sensitive than moths to Allee effects in small patches.
Fig. 3.
DARslope of moth species depending on general habitat preference (mean ± bias-corrected C.I.). Estimation of DAR is based on the data set without small empty patches, but the pattern is similar for the full data set.
Fig. 4.
DARslope of specialist and generalist butterfly species (mean ± bias-corrected C.I.).
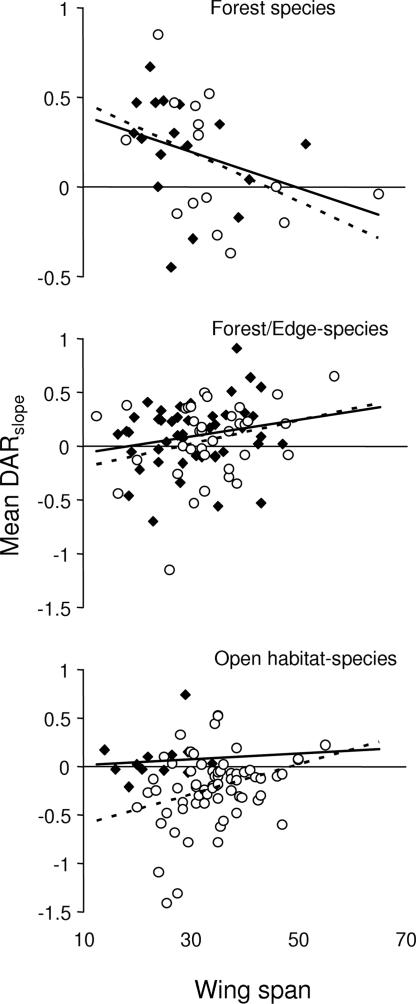
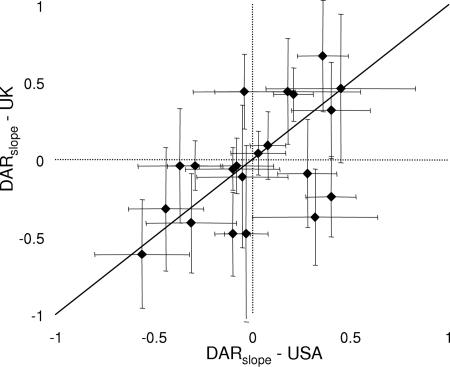
The effect of body size was also different for moths and butterflies. For moths, we found that the DARslope depended not only on wing span but also on a habitat specialization-by-wing span interaction (Table 1), whereas no effect of either wing span or higher-order interactions was apparent for butterflies (P > 0.05). Moreover, the interaction for moths arose as predicted, as the DARslope was positive for small forest species, negative for small open habitat species, and close to zero for large species in both groups (Fig. 5). There were also differences between families, as geometrids had a more positive DARslope than noctuids when controlling for wing span and habitat preference, but this effect varied with country (Table 1). The family-by-country interaction arose because noctuids had a more positive slope in the United States data set than in the United Kingdom data set (data not shown). This result contrasts with the paired species analysis, showing no differences in the DARslope for closely related species (t = 0.53, P = 0.6, n = 21, Fig. 6). This finding suggests that the family-by-country interaction did not arise because of different responses by ecologically similar noctuids between the two data sets but is rather due to differences in the community composition of noctuids. Hence, an improved classification of noctuids might reveal additional characteristics determining their response to patch size.
Table 1.
ANOVA results
| Source | df | Sums of squares | F (P value) |
|---|---|---|---|
| H | 2 | 87.3 | 28.9 (<0.0001) |
| W | 1 | 6.9 | 4.5 (0.03) |
| F | 1 | 13.9 | 9.2 (0.003) |
| C | 1 | 0.0 | 0.0 (>0.2) |
| H-by-W | 2 | 15.2 | 5.0 (0.008) |
| H-by-F | 2 | 7.4 | 2.4 (0.09) |
| W-by-F | 1 | 3.7 | 2.5 (0.12) |
| H-by-C | 2 | 2.0 | 0.6 (>0.2) |
| W-by-C | 1 | 0.0 | 0.0 (>0.2) |
| F-by-C | 1 | 18.3 | 12.1 (0.0006) |
| Error | 178 | 269.3 |
ANOVA (sums of squares = type 1) results modeled the effect of habitat preference (forest, forest-edge, and open habitat), family (geometrid vs. noctuid), wing span, and country (United States vs. United Kingdom) on moth DARs (R2 = 0.39). All higher-order interactions were nonsignificant. The analysis was based on the data set with small empty patches excluded. H, habitat preference; W, wing span; F, family; C, country.
Fig. 5.
DARslope for geometrid (♦, solid line) and noctuid (○, dotted line) moth species in relation to wing span and habitat preference (mean ± bias-corrected C.I.). Estimation of DAR is based on the data set with small empty patches excluded.
Fig. 6.
DARslope for moth species pairs, including one species from each data set (mean ± bias-corrected C.I.).
Discussion
The structure of the lepidopteran community clearly differs among patches of different size, both for diurnal butterflies and for nocturnal moths, and these differences are reflected in the large variability in DARs among families and species. In our comparison of 344 lepidopteran species, we identified three general patterns. First, the DARslope was on average positive for moth species and negative for butterfly species, which would have the consequence that most butterflies reach higher densities in small patches whereas most moth species reach higher densities in large patches. This pattern, which may explain the observed lack of correlations between moth and butterfly diversity (30, 31), was fairly consistent among families, with some important exceptions. The DARslope for zygaenid moths was similar to that for butterfly species, whereas the DARslope for lycaenid butterflies was similar to that for moth species. Second, the observed DARslope for moths was remarkably consistent between the United Kingdom and United States data sets. The paired species analysis showed that >30% of the variability in DARslope was common among the two data sets. This result is important because it may improve our ability to predict future density changes to fragmentation through inclusion of species characteristics such as wing span. Third, the DARslope for habitat specialists was largely positive whereas the slope for habitat generalists and matrix specialists was negative, which is consistent with community-level studies suggesting that small patches have a community composition resembling the matrix (8, 32). This pattern seemingly occurs for different reasons in moths and butterflies. In butterflies, the pattern disappeared when we excluded small patches with zero abundance, suggesting that the underlying mechanism was differences in patch size threshold. In moth species, the pattern remained after the same data exclusion but instead disappeared for large species. Based on theoretical predictions (Eqs. 1–3), this finding suggests that differences between forest and open-habitat species were due to habitat preferences combined with different local growth rates, but also that the DARslope depends on the relative importance of local and regional processes.
The differences in DARslope for moth and butterfly species are intriguing and suggest important differences in the way that these groups locate suitable patches (see also ref. 30). In the analysis, we could exclude other possible hypotheses explaining the variability in DARslope (16, 17, 33), because these hypotheses either did not vary between groups or were included in the analysis. First, moth and butterfly species in the study are of similar size, have a similar life cycle, and are largely herbivorous. Second, differences in habitat specialization and patch-size threshold were included in the analysis and could not explain differences in DARslope between the two groups. Moreover, zygaenid moths, with a similar diurnal lifestyle as butterflies, also showed a similar DARslope as butterflies, suggesting that ecology may be more important than family identity in determining lepidopteran responses to fragmentation. Hence, even though we cannot exclude the possibility that structural differences for patches in the moth (forest) and butterfly (grassland) studies could also affect the DARslope, we argue that the main reason for observed responses is that the difference between a nocturnal and diurnal lifestyle affects both the patch location behavior in lepidopterans and their response to fragmentation. The exact mechanism underlying these differences is yet unclear, but we suggest that an important distinction may be the type of information used when searching for host plant patches (25). The low light availability during night reduces the content of visual information and necessitates the use of odor cues. This fact does not imply that nocturnal insects do not use visual information, as visual information is the basis for the trapping method used in moth studies, but that visual information is mainly used for maintaining a straight flight course (34). Diurnal lepidopterans are of course also known to use olfactory information when searching for host plants, but mostly from a quite close range (35). At longer distances, visual information seems more important for patch finding (36).
These differences in the use of olfactory and visual information have consequences for edge detection and patch location behavior and for the area scaling of migration rates. First, olfactory information may have a different scaling than visual information. The model by Bossert and Wilson (26) suggests that odor attraction increases faster with patch size than for visual attraction, causing a more positive DARslope for olfactory searchers. This hypothesis is appealing, although it has never been evaluated in field conditions, but it needs to be adjusted for later information on the behavior of odor molecules in turbulent conditions (37, 38). Moreover, the different scaling of olfactory and visual information does not necessarily result in different DARslope because these differences depend on differences in the area scaling of immigration and emigration rates (Eq. 3). Hence, the quantitative outcome depends on the cues used by insects both when locating and leaving patches. An additional difference between olfactory and visual searchers is their ability to detect patches from in and outside patches. Although both visual and olfactory searchers may detect patches from a distance, olfactory searchers may be unable to perceive edges from inside the patch. The consequences of these differences are yet unclear but deserve further attention because they may explain variation in the relative area scaling of immigration and emigration rates of lepidopterans and other insects.
The processes underlying patch size responses are obviously different in habitat and matrix specialists, and habitat specialists generally had a more positive DARslope than matrix specialists. In butterflies, the difference between specialists and generalists largely disappeared when we removed small empty patches from the analysis, suggesting that habitat specialists are less able to sustain populations in small patches, presumably because they are unable to use matrix habitats. In moths, an alternative mechanism may be more important because differences in DARslope between forest and open habitat species depend on wing span. The DARslope for forest species was positive for small species and close to zero for large species, whereas the DARslope for open habitat species was negative for small species and close to zero for large species. Consequently, differences between forest and open habitat species were most pronounced for small species and disappeared for large species. This pattern matches our model predictions that search behavior should determine DARs for species with high migration rates, whereas local growth rates should determine the DARslope for species with low migration rates. It seems safe to assume that forest specialists have positive growth rates and open habitat specialists have negative growth rates within forest patches and that large moth species have higher migration rates than small species (22). Hence, we should observe differences in DARslope for small species depending on habitat preference but not for large species. Given that we have not estimated local growth rates or the relation between wing span and migration rate for different species, it is encouraging that the analysis provided strong indications for the fairly simple population model across a wide range of moth species and for two continents.
Our results have consequences for understanding fragmentation effects on species density, with possible implications for nature reserve design. It is generally assumed that large species are more sensitive to fragmentation (2) and therefore need larger reserve sizes than small species. Our findings contradict this assumption because large moth species had more shallow DARslope than small species, but the different conclusions may be due to differences in spatial scale, which are governed by body size (39). Large species are thought to be more sensitive to fragmentation because of greater space use and food resource requirements (40), but this assumption ignores the fact that large species may, because of their higher mobility, be able to use multiple patches. This fact suggests that small and large species may be affected by different aspects of fragmentation. Small species may be most affected by the patch size reduction, whereas large species are more affected by the total amount of suitable habitat in the landscape. This reasoning is consistent with previous studies on butterflies in agricultural landscapes (20), suggesting that small species survive because they are able to sustain local populations even in small patches whereas large species survive because they are able to use multiple patches. The same study actually suggests that species with intermediate body sizes may be most sensitive to fragmentation because they are unable to use either strategy.
The scaling issues involved in the response to fragmentation by small and large species has consequences for the interpretation of small-scale fragmentation experiments. It has been suggested that model systems may provide useful insights for understanding fragmentation effects on larger species or landscapes, where experimental manipulations are logistically impossible. Our analysis supports this suggestion, but only when the selection of model system carefully considers the relative role of local and regional processes, as observations may only scale properly within the same domain of population processes (41). Consequently, a proper selection of model species would involve a dimensional analysis of population growth and migration rates as well as considerations of habitat specialization and search mode (42).
Methods
In the analyses, we use three data sets from four studies. The butterfly data originate from two studies (1996 and 2000) in a network of 31 habitat patches in Germany (16, 43) that examined butterfly and zygaenid moth densities in calcareous grasslands within an agricultural matrix. The methodology for estimating densities was by standardized transect counts (23), which were translated to density based on transect length and width. In our analysis, we assumed that the differences between years reflect random differences and therefore calculated average densities. The moth data originate from one study in the United Kingdom (44) that estimated densities in 18 forest patches within an agricultural matrix and one study from the United States (8) that estimated densities in 21 forest patches in two regions but both within an agricultural matrix. The methodology used in both studies was portable blacklight traps, which is a standard method for estimating the abundance of nocturnal moths. Although there were differences in trapping effort between studies (SI Tables 4 and 5), these differences were unlikely to affect our analysis because DARslope estimates do not require absolute densities but only the relative densities among patches. Hence, density estimates among patches within a study were directly comparable because sampling effort was similar for all included patches.
All species occurring in five or more patches, and with a total abundance of at least 10 individuals, were included in the analysis. Because the moth data from the United States were collected in two regions, we used this criterion for each region. When the data were sufficient for both regions, then region was included as a factor when estimating DAR. After this adjustment, the butterfly data included 28,107 individuals and 43 species in four families (SI Table 3) and 3,332 individuals and five species of zygaenid moths, whereas the moth data set included 34,068 individuals and 296 species in 17 families (SI Tables 4 and 5). For each species, we estimated a separate DAR in S-Plus 6.2 by a Poisson regression with density as the response variable and ln(Area) as the independent variable. Because the deviance analysis suggested underdispersion, we adjusted standard errors using quasi-Poisson errors (45). Because patch area could correlate with isolation, we initially examined interactions between an isolation index and patch area, but this interaction was only significant in very few cases and did not affect the estimation of the DARslope.
In the metaanalysis, we used information about family, wing span, and habitat preferences to predict variability in DARslope. Wing span and habitat preferences were extracted from the literature (SI Tables 3–5). Based on information about habitat preference, butterfly species were separated into two classes (generalists and specialists), and moth species were separated into three classes, species occurring in (i) open habitats, (ii) forests and edges, and (iii) forests only. As forest habitats, we included all forests and parks whereas edge habitats included forest margins and gardens. In ambiguous cases we placed the species in the forests and edges category.
Supplementary Material
Acknowledgments
The study was supported by the Swedish Research Council for Environment, Agricultural Sciences, and Spatial Planning (Formas) (P.A.H.) and by the Sixth European Union Framework Program (Project COCONUT, Contract 2006-044346 to I.S.-D. and J.K.).
Abbreviations
- DAR
density–area relationship
- C.I.
confidence interval.
Footnotes
The authors declare no conflict of interest.
This article is a PNAS Direct Submission.
This article contains supporting information online at www.pnas.org/cgi/content/full/0611462104/DC1.
References
- 1.Turner IM. J Appl Ecol. 1996;33:200–209. [Google Scholar]
- 2.Ewers RM, Didham RK. Biol Rev. 2006;81:117–142. doi: 10.1017/S1464793105006949. [DOI] [PubMed] [Google Scholar]
- 3.Saunders DA, Hobb RJ, Margules CR. Conservation Biol. 1991;5:18–32. [Google Scholar]
- 4.Bierregaard RO, Gascon C, Lovejoy TE, Mesquita R. Lessons from Amazonia: The Ecology and Conservation of a Fragmented Forest. New Haven, CT: Yale Univ Press; 2001. [Google Scholar]
- 5.Fahrig L. Annu Rev Ecol Syst. 2003;34:487–515. [Google Scholar]
- 6.Hanski I. Metapopulation Ecology. Oxford: Oxford Univ Press; 2001. [Google Scholar]
- 7.Burke DM, Nol E. Ecol Appl. 2000;10:1749–1761. [Google Scholar]
- 8.Summerville KS, Crist TO. Ecography. 2004;27:3–12. [Google Scholar]
- 9.Connor EF, Courtney AC, Yoder JM. Ecology. 2000;81:734–748. [Google Scholar]
- 10.Hambäck PA, Englund G. Ecol Lett. 2005;8:1057–1065. [Google Scholar]
- 11.Bowers MA, Matter SF. J Mammal. 1997;78:999–1013. [Google Scholar]
- 12.Andresen E. Ecography. 2003;26:87–97. [Google Scholar]
- 13.Steffan-Dewenter I, Tscharntke T. Oecologia. 1999;121:432–440. doi: 10.1007/s004420050949. [DOI] [PubMed] [Google Scholar]
- 14.Didham RK, Ghazoul J, Stork NE, Davis AJ. Trends Ecol Evol. 1996;11:255–260. doi: 10.1016/0169-5347(96)20047-3. [DOI] [PubMed] [Google Scholar]
- 15.Bowman J, Cappuccino N, Fahrig L. [Accessed June 2002];Conservation Ecology. 2002 Vol 6(Issue 1(9)) Available at: www.ecologyandsociety.org.
- 16.Steffan-Dewenter I, Tscharntke T. Ecol Lett. 2000;3:449–456. [Google Scholar]
- 17.Cronin JT. Ecology. 2003;84:1179–1188. [Google Scholar]
- 18.Holland JD, Fahrig L, Cappuccino N. Oikos. 2005;110:101–108. [Google Scholar]
- 19.Thies C, Steffan-Dewenter I, Tscharntke T. Oikos. 2003;101:18–25. [Google Scholar]
- 20.Thomas CD. Proc R Soc London Ser B. 2000;267:139–145. [Google Scholar]
- 21.Berwaerts K, Van Dyck H, Aerts P. Funct Ecol. 2002;16:484–491. [Google Scholar]
- 22.Nieminen M. Oecologia. 1996;108:643–651. doi: 10.1007/BF00329038. [DOI] [PubMed] [Google Scholar]
- 23.Pollard E, Yates TJ. Monitoring Butterflies for Ecology and Conservation. London: Chapman & Hall; 1993. [Google Scholar]
- 24.Englund G, Hambäck PA. J Anim Ecol. 2007;76:30–35. doi: 10.1111/j.1365-2656.2006.01174.x. [DOI] [PubMed] [Google Scholar]
- 25.Renwick JAA, Chew FS. Annu Rev Entomol. 1994;39:377–400. [Google Scholar]
- 26.Bossert WH, Wilson EO. J Theor Biol. 1963;5:443–469. doi: 10.1016/0022-5193(63)90089-4. [DOI] [PubMed] [Google Scholar]
- 27.Naumann CM, Tarmann GM, Tremewan WG. The Western Palearctic Zygaenidae. Stenstrup: Apollo Books; 1999. [Google Scholar]
- 28.Rosenberg MS, Adams DC, Gurevitch J. MetaWin: Statistical Software for Meta-Analysis. Sunderland, MA: Sinauer; 1997. Version 2.0. [Google Scholar]
- 29.Hedges LV, Olkin I. Statistical Methods for Meta-Analysis. New York: Academic; 1985. [Google Scholar]
- 30.Daily GC, Ehrlich PR. Proc Natl Acad Sci USA. 1996;93:11709–11712. doi: 10.1073/pnas.93.21.11709. [DOI] [PMC free article] [PubMed] [Google Scholar]
- 31.Ricketts TH, Daily GC, Ehrlich PR. Biol Conserv. 2002;103:361–370. [Google Scholar]
- 32.Ricketts TH, Daily GC, Ehrlich PR, Fay JP. Conserv Biol. 2000;15:378–388. [Google Scholar]
- 33.Matter SF. Ecol Model. 1999;118:261–275. [Google Scholar]
- 34.Showers WB, Keaster AJ, Raulston JR, Hendrix WH, Derrick ME, McCorcle MD, Robinson JF, Way MO, Wallendorf MJ, Goodenough JL. Ecology. 1993;74:2303–2314. [Google Scholar]
- 35.Heinz CA, Feeny P. Anim Behav. 2005;69:107–115. [Google Scholar]
- 36.Pe'er G, Saltz D, Thulke HH, Motro U. Anim Behav. 2004;68:825–839. [Google Scholar]
- 37.Murlis J, Elkinton JS, Cardé RT. Annu Rev Entomol. 1992;37:505–532. [Google Scholar]
- 38.Vickers NJ. Biol Bull. 2000;198:203–212. doi: 10.2307/1542524. [DOI] [PubMed] [Google Scholar]
- 39.Davies KF, Margules CR, Lawrence JF. Ecology. 2000;81:1450–1461. [Google Scholar]
- 40.Cyr H. In: Scaling in Biology. Brown JH, West GB, editors. Oxford: Oxford Univ Press; 2000. pp. 267–295. [Google Scholar]
- 41.Englund G, Cooper SD. Adv Ecol Res. 2003;33:161–213. [Google Scholar]
- 42.Summerville KS, Crist TO. Ecology. 2001;82:1360–1370. [Google Scholar]
- 43.Krauss J, Steffan-Dewenter I, Tscharntke T. Oecologia. 2003;137:591–602. doi: 10.1007/s00442-003-1353-x. [DOI] [PubMed] [Google Scholar]
- 44.Usher MB, Keiller SWJ. Biodiv Cons. 1998;7:725–748. [Google Scholar]
- 45.Crawley MJ. Statistical Computing, An Introduction to Data Analysis Using S-Plus. Chippenham, UK: Wiley; 2002. [Google Scholar]
Associated Data
This section collects any data citations, data availability statements, or supplementary materials included in this article.


