Abstract
We report the construction and characterization of a new compact surface plasmon resonance imaging instrument. Surface plasmon resonance imaging is a versatile technique for detection, quantification, and visualization of bio-molecular binding events which have spatial structure. The imager uses a folded light path, wide-field optics and a tilted detector to implement a high performance optical system in a volume 7″×4″×2″. A bright diode light source and an image detector with fast frame rate and integrated digital signal processor enable real-time averaging of multiple images for improved signal-to-noise ratio. Operating angle of the imager is adjusted by linear translation of the light source. Imager performance is illustrated using resolution test targets, refractive index test solutions, and competition assays for the anti-epileptic drug phenytoin. Microfluidic flowcells are used to enable simultaneous assay of three sample streams. Noise level of refractive index measurements was found to decrease proportional to the square root of the number of pixels averaged, reaching approximately 5 × 10⁻⁷ refractive index units root-mean-square for 160×120 pixel image regions imaged for one second. The simple, compact construction and high performance of the imager will allow the device to be readily applied to a wide range of applications.
Keywords: Surface plasmon resonance imaging, microfluidics
1. Introduction
1.1. Surface plasmon resonance imaging
SPR imaging was first demonstrated in the late 1980’s (Yeatman and Ash, 1987; Rothenhausler and Knoll, 1988). It is an optical technique for detecting changes in refractive index near the surface of a thin layer of metal. Due to its high sensitivity and label-free operation, SPR has emerged as an effective method for quantitative analysis of biological and chemical binding reactions (Steiner, 2004). In a typical SPR imaging system, collimated monochromatic light is reflected from the sensor surface in the Kretschmann configuration (Kretschmann and Raether, 1968) and focused onto a two-dimensional image detector, allowing spatially varying binding events to be measured.
SPR imaging applications typically fall into the areas of genomics and proteomics. Some examples of genomics applications include DNA-DNA (Wark et al., 2005; He et al., 2000), DNA-RNA (Nelson et al., 2001), and DNA-drug (Wolf et al., 2005) interactions. For proteomics, the applications include determining protein thickness (Otsuki et al., 2005; Wilkop et al., 2004), conformational changes (Kim et al., 2005), and expression profiling (Usui-Aoki et al., 2005). Other diverse application areas for SPR imaging include toxin-binding inhibition in glycomics (Kanda et al., 2005), self-assembled monolayers (Pyo et al., 2005), detection of human choriogonadotropin (Piliarik et al., 2005), and fabrication of electrochemical switches (Arena et al., 2004).
SPR imaging systems have evolved over the past 20 years. The first published description of an SPR microscope included many moving parts (Yeatman and Ash, 1988). Since then, researchers have worked on simplifying and improving various aspects of the technique. Some examples include use of multi-spectral scanning (Otsuki et al., 2005; Yuk et al., 2006), use of an incoherent light source, such as an LED, in place of a laser to eliminate speckle (Wilkop et al., 2004), and use of a liquid crystal variable retarder to reduce spatial and temporal fluctuations from the light source (Wolf et al., 2005). SPR imagers designed for laboratory use are beginning to be commercially available, including the SPRimager II (GWC Technologies, USA) and FlexChip (Biacore, Sweden). The goal of our research is to take the next step by enabling leaps in instrumentation which will enable SPR imaging to be used outside of the laboratory, by relatively untrained users, for point-of-care medical applications. This will require improvements in performance and reliability, reduction in size and cost, and simplification and automation of sample handling and assay procedures.
To this end, we are developing a prototype system capable of performing rapid (<20 min) multiple simultaneous assays of small molecules in liquid matrices. The system consists of a disposable microfluidics card that contains all of the chemistry and sample handling needed, mated to an optical sensing platform that allows highly sensitive surface plasmon resonance (SPR) imaging bioassays to be conducted in the sensing region of the microfluidic card. The instrument is designed to be rugged and compact, with few moving parts. In addition to its optical system, the instrument includes light shielding so that the instrument may be used in normal room lighting, a magnetic clamping mechanism for reproducible placement of the disposable card on the instrument, and a tablet PC for instrument control (Fig. 1).
Figure 1.
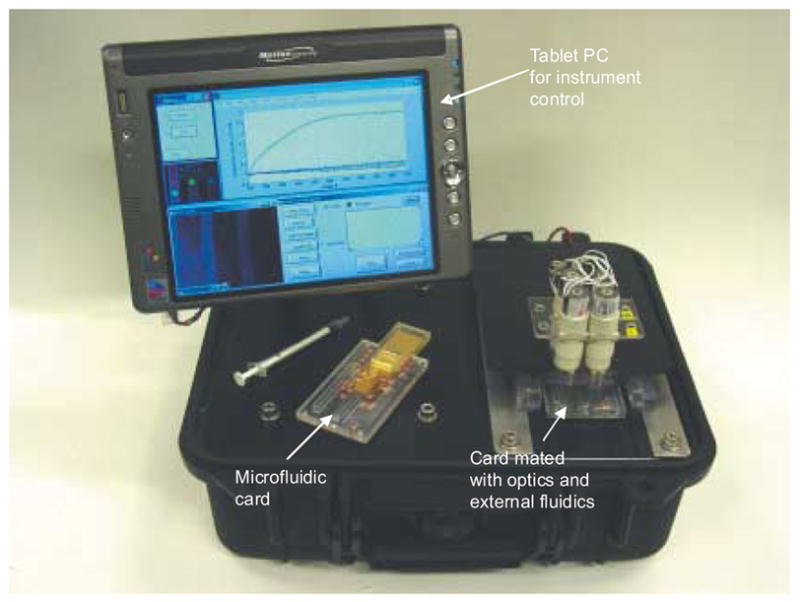
Photograph of the compact SPR imager, showing optical platform, control computer, microfluidic card, and external fluidics fixtures.
In this paper, we describe the optical sensing platform we have developed. The other critical component of our sensing system, the microfluidic cards containing the sample handling and assay chemistry, will be described in detail in a separate publication. Briefly, these cards are constructed from laminated layers of laser-cut adhesive-coated Mylar and polydimethylsiloxane (PDMS), in structures designed to implement (1) sample loop for storage of the injected sample; (2) diffusion-based “H” filter for extraction of low molecular weight compounds (Brody and Yager, 1997); (3) herringbone micromixer (Stroock et al., 2002) for combining filter sample with antibody solution; (4) assay channels for flowing sample-antibody mixture over the gold-coated surfaces monitored by SPR imaging, and (5) storage of waste solutions produced during the course of the assay.
1.2. Principles of SPR imaging
SPR is a well established technique for observing biomolecular binding reactions. As typically implemented, light traveling through a high refractive index (RI) substrate (here BK7, n=1.51) reflects from the substrate surface, which is coated with a thin layer of gold (~45 nm). An aqueous sample, generally contained in a flowcell, contacts the opposite side of the gold. For certain wavelengths and angles of transverse-magnetic (TM)-polarized incident light, part of the incident energy will couple into a surface plasma wave traveling between the sample and the gold layer. The loss of this energy is observed as a decrease in reflectivity. Because the coupling conditions vary strongly with the refractive index of the sample, observations of reflectivity may be used as a surface sensitive measure of sample refractive index. To make an SPR sensor for detection of specific substances, the gold surface is chemically functionalized such that substances of interest will bind to the surface while other material will tend not to bind. Imaging the reflectivity of the surface makes it possible to obtain a measurement of binding at each point on the surface. As biomolecules bind to the surface, the surface RI will increase roughly proportional to the quantity of the substance that has bound. Observation of the RI over time will give a binding curve which reveals the quantity of bound material in real time. If the functionalization layer on the gold surface is patterned such that different regions of the surface tend to bind different substances, the changes in reflectivity which result as the surface is exposed to a sample may be analyzed to determine which of those substances are present in the sample, and in what concentration.
2. Instrumentation
2.1. Design goals
The goal of the research described in this paper is to develop a compact high-performance SPR imager suitable for use in medical diagnostics. Optimization of such an instrument is not straightforward because tradeoffs must be made between four main instrumental attributes: Refractive index resolution, spatial resolution, refractive index linear range, and mechanical and optical simplicity and cost (Chinowsky 2004). The optics of all SPR imagers are somewhat similar: Light emitted from one or more light sources passes through collimating optics and filters, passes through the side of a prism, and strikes the gold-coated sensing surface at angles appropriate for observation of SPR. The reflected light passes through imaging optics and is focused onto a detector which records the image. In implementing each of these components, we sought to achieve state-of-the-art performance while avoiding complicated, expensive construction.
2.2. Collimated light source
The light source should be intense enough to nearly saturate the detector used, to reduce the effects of shot noise and detector dark noise. The source should be uniform across the field to produce images that can be interpreted with a minimum of processing. The source should have a narrow wavelength spectrum and angular spread, to produce a sharp SPR characteristic. Near-IR sources will give a sharper response characteristic than sources of shorter wavelength, but operation in the visible range may be more convenient for some applications.
We chose a light-emitting-diode (LED) light source for its simplicity, low cost, brightness, and freedom from speckle. We used an infrared LED (Fairchild F5E1, 880 nm peak wavelength) collimated by an achromatic doublet (75 mm F.L.). The bandwidth of our LED is specified as 60 nm (full width half-max). The angular spread of the source was measured to be 1.05 degrees. At an operating current of 100 mA, typical emission is specified at 12 mW. In our instrument, LED current was 90 mA.
To adjust the SPR imager for the maximum signal level for a given analyte RI, it may be necessary to adjust the incident angle or wavelength of illumination. We translate the LED perpendicular to the optical axis to adjust the angle at which light exits the collimator (Fig. 2). In our current configuration, this allows adjustment of the incident angle from approximately 61 to 66 degrees.
Figure 2.
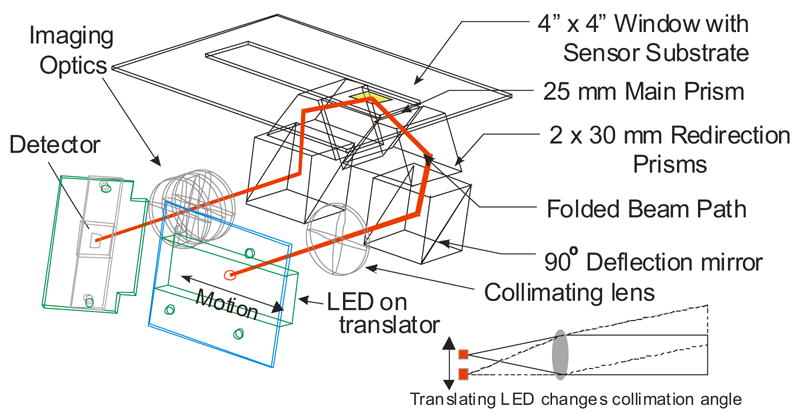
Folded optical path. Mirrors and prisms are used to fold the optical path such that input and output optical paths are parallel to each other and to the sensing surface. Inset: The LED light source is translated across the focal plane of the collimating lens to change the angle of light exiting the collimator.
2.3. Prism and sensing surface
To observe SPR, the collimated light source is used to illuminate the back side of a gold-coated sensing surface at a range of angles above the critical angle. In our instrument, the sensing surface is a disposable gold-coated microscope slide incorporated into a microfluidic sample handling card. To image the slide, it is index-matched to a prism in the base unit using index-matching oil such that the center of the sensing film intersects the nominal optical axis of the illumination beam.
We have added additional optical components to produce a compact optical structure and improve ease of substrate mounting (Fig. 2). The main prism is bonded to a flat glass window. The window provides a convenient method of mounting the prism to the rest of the instrument, supports the sensing substrate, and helps to contain any wayward sample fluid. Because the window is much larger than the sensing area, the user can readily reposition the substrate to observe different areas of the gold surface.
To produce an instrument with a compact footprint, the optical paths of the illumination and signal light are folded. The collimator is oriented with its optical axis parallel to the surface of the sensor. The beam is folded to be perpendicular to the sensing surface using a mirror in an adjustable mount. After striking the mirror, the beam is redirected by a prism such that the nominal optical axis intersects the sensor surface at 65º from normal. A second mirror-prism pair redirects the light reflected from the sensor surface to be normal to the sensor surface to be parallel to, but displaced from, the collimated input beam.
2.4. Imaging optics
The task of the sensor’s imaging optics is to form a sharp image of the sensing surface on an image detector. If the angle of incidence is changed to accommodate a different analyte RI, the angle of the reflected light will also change, and the imaging optics must be able to accommodate this. Because the SPR sensing surface is tilted relative to the optical axis of the imaging optics, the depth-of-field of the imaging optics limits the size of the object which can be imaged with high quality. To remove this limitation, we tilt the detector surface to match the tilt of the image surface, bringing the entire image into focus. (Smith, 2000). We constructed an imaging lens using a combination of commercially available elements and optimized the assembly using ZEMAX optical design software. The final configuration uses an objective lens split into a pair of biconvex lenses. This minimizes aberrations and allowed the use of commonly available lenses. This lens pair is followed by a negative lens that acts as a field flattener. This negative lens was chosen as an achromatic element to further reduce aberrations.
2.5. Image detector and software
To reduce the effects of shot noise, it is desirable to increase the flux which the detector can observe without saturation. Two ways to accomplish this are to increase the detector pixel size and increase the image acquisition rate (decrease integration time). For our instrument, to minimize size and cost, we used a relatively small detector which can be read at a fairly high frame rate. The camera (Vision Components VCSBC4018) uses a 1/3″ format 640×480 pixel CCD which can be read at up to 32 frames per second. The DSP built into the camera (Texas Instruments TMS320C6410) allows frames to be acquired and processed at nearly the full frame rate. “C” software running on the camera’s DSP controls the CCD image detector and captures images into the camera’s internal memory. Successive images are summed together, and the summed image is delivered to the instrument’s tablet PC over an Ethernet interface once per second. PC software controls the instrument, processes averaged SPR images, and provides a graphical user interface.
3. Calibration experiments
3.1. Uniformity tests
To test the response of the imager, calibration experiments using test solutions of known refractive index were performed. A 15 mm wide diamond-shaped flowcell constructed from laser-cut mylar was adhered to a microscope slide coated via e-beam evaporation with 45 nm gold on top of a 1 nm chromium adhesion layer. Movement of sample through the flowcell was driven by a syringe-pump driven injection loop system (~700 μL loop volume, 100 μl/min flow rate). To test the uniformity of illumination and SPR response across the image area, the flowcell was filled with distilled water and positioned such that the entire imaged area was contained within the flowcell. The illumination angle was swept from ~62 degrees to ~65.5 degrees in 80 steps under computer control; at each step an image was recorded.
3.2. Noise tests
To measure the sensitivity and noise behavior of the imager, the flowcell was positioned such that the sample area occupied about 2/3 of the image area, with the remaining 1/3 imaging the plastic flowcell material outside of the flow region. Because the plastic is not within the resonant RI range, its image can be used to provide a measurement of illumination intensity simultaneous with the SPR measurement. Solutions consisting of various dilutions of phosphate-buffered saline (PBS) were flowed across the sensor, with the sensor exposed to each solution for long enough (~2 min) that solutions were fully exchanged and >100 images were obtained for each solution. 7:3 water:PBS, 8:2 water:PBS, and 9:1 water:PBS, were used, producing a maximum RI excursion of Dn=1050 RU (1050 × 10−6 RI units) at the highest concentration. Data were analyzed to compare the brightness changes due to RI to brightness changes observed (due to noise) when the RI was nominally constant.
3.3. Spatial resolution tests
To test the ability of the imager to spatially resolve SPR reponse, a molded silicone stamp containing 100×100 μm square wells was pressed onto a gold-coated slide holding a drop of water as images were collected. Water trapped in the wells is resonant (dark), while the silicone grid separating the wells is out of resonance (light). The well-defined features of the resulting images provide a convenient method for evaluating spatial resolution.
4. Biosensing experiments
4.1. Construction of microfluidic assay devices
Instrument biosensing performance was tested using microfluidic devices designed for competition assays of the anti-epileptic drug phenytoin. Assays were tested in PBS, rather than a more complex matrix, to simplify experimental procedure. Sensor substrates were constructed from soda-lime glass microscope slides evaporated with 1 nm chromium and 45 nm gold. Gold surfaces were then functionalized as follows. The surface of the channel between the device inlets and to just inside the imaging region was coated with a polyethylene glycol (PEG)-terminated thiol (HS(CH2)11(OCH2CH2)4OH) (coating concentration was 5 mM in ethanol) to prevent loss of sample prior to reaching the sensing surface. The surface inside the imaging area immediately downstream of the PEG treated region was coated with a BSA-phenytoin conjugate (coating solution concentration was 10 mg/mL of BSA-phenytoin in PBS). The BSA-phenytoin coating provides for specific binding of anti-phenytoin antibody from bulk solution. Coating of both regions was accomplished using capillary forces to distribute the fluid underneath a 10 mil Mylar sheet cut to the dimensions of the area to be treated. Surface patterning was done sequentially (PEG first). Each solution was allowed to adsorb for 1 hour. Patterning masks were then removed, and the substrates were rinsed and blown dry with nitrogen. Functionalized slides were assembled into microfluidic flowcells containing a single 3.6 mm wide channel with three inlets and one outlet. Nominal channel depth was 60 μm.
4.2. Assay procedure
Fluid was driven into each of the three input ports on the card using syringe pumps. Flow was 250 nL/sec for each of the three fluid streams. 80 μL sample loops (first in, last out) are connected to each of the three pump channels approximately 10 μL upstream of the device via six-position selection valves. To perform an assay, 125 μL of the solution to be assayed was mixed with 125 μL of 200 nM antiphenytoin monoclonal antibody solution and injected into the sample loops. Valves were then switched, flowing the mixture through the sample channels. Solutions containing 0 nM, 25 nM, 50 nM, and 75 nM phenytoin (concentration after mixing with antibody) were tested. As a check on the specificity of the phenytoin antibody, 50 nM cortisol was also tested.
Prior to the start of the experiment, the device and all the pump tubing was primed with degassed PBS. Each assay is conducted by aligning the selection valves to inject the sample, beginning image data acquisition, then starting the fluid flow.
5. Results and discussion
5.1. Uniformity tests
To quantify variations in SPR response across the image, images were divided into 16 regions arranged in a 4×4 grid (160×120 pixels each). To compare the SPR characteristic for each region, the reflected intensity of a gold surface in water was divided by the reflected intensity measured using a bare glass surface. Plots of this normalized reflectivity as a function of angle in each region were overlaid (Fig. 3). Response was found to be very uniform across the image. During sensing operations, incident angle is typically adjusted such that reflected intensity is approximately 1/3 up the left side of the curve. (Dashed line in Fig. 3). Binding to the sensor surface will cause a local increase in RI, a shift of the SPR curve to higher angles, and an increase in observed brightness. Brightness changes will be approximately linear with respect to refractive index, as long as the operating point remains on the portion of the SPR curve which is close to linear.
Figure 3.
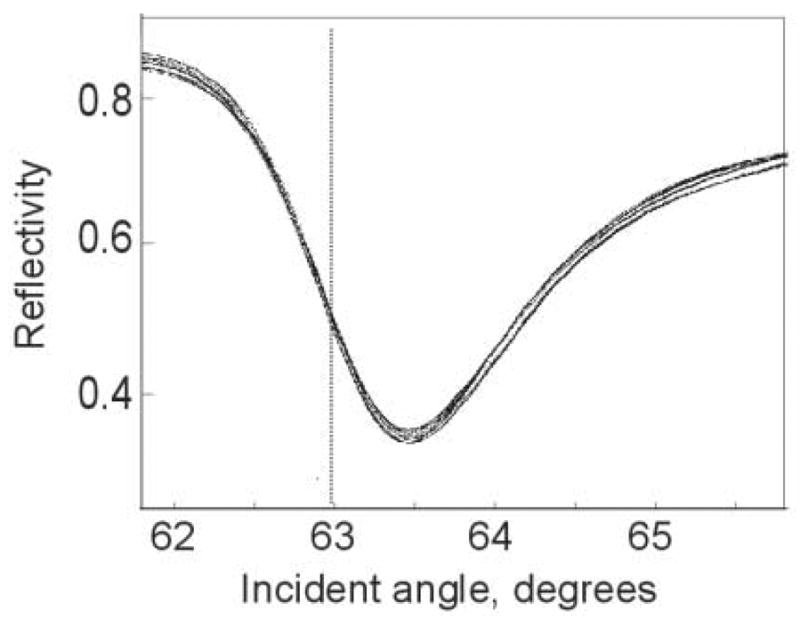
SPR curves measured in each of 16 image regions. Gold sensing surface was exposed to water and images were collected as the incident angle was scanned from <62 degrees to >65.5 degrees. Reflected intensity was normalized to the same measurement performed on a bare glass surface. During operation, incident angle is typically adjusted to a position on the curve close to the dotted line. Increases in refractive index cause the curve to move to the right, increasing the observed brightness.
5.2. Noise tests
Images obtained during the RI calibration measurements described above were divided into 16 regions arranged in a 4×4 grid. To determine the precision to which these measurements could be used to measure RI, the variation in the measurements during each sampling period was calculated. During periods of nominally constant RI, RI values were calculated from each active region of each of the ~100 images captured. A best-fit quartic polynomial was subtracted from these values to remove any systematic drift component, and the standard deviation of the residual was calculated. To examine how the standard deviation would change with the number of pixels in the region, the procedure was repeated with subsets of each region consisting of 80×60, 40×30, 20×15, 10×8, 5×4, 2×2, and 1×1 pixel regions aligned to the upper left corner of each 160x120 patch. Results were plotted on a log-log scale with the number of pixels on the horizontal axis and RI standard deviation on the vertical axis (Fig. 4). Three curves are shown on the plot. The “Raw” curve was calculated from the recorded pixel values with no additional manipulation. The “Normalized” curve was calculated by first normalizing the brightness of each patch to the corresponding patch of the “intensity reference” sector of the image. Because this sector is not in resonance, any changes in its brightness are expected to be due to light source variations, camera fluctuations, and other systematic effects. It was anticipated that normalization could be used to reduce the effects of these variations in the active sectors and therefore increase RI resolution. Also plotted for comparison in the “Dark” curve of Fig. 4 are the noise values calculated from a set of dark images assuming the same instrument sensitivity (i.e. pixel count to RI response function). This indicates the noise level expected solely due to noise present in the image detection apparatus.
Figure 4.
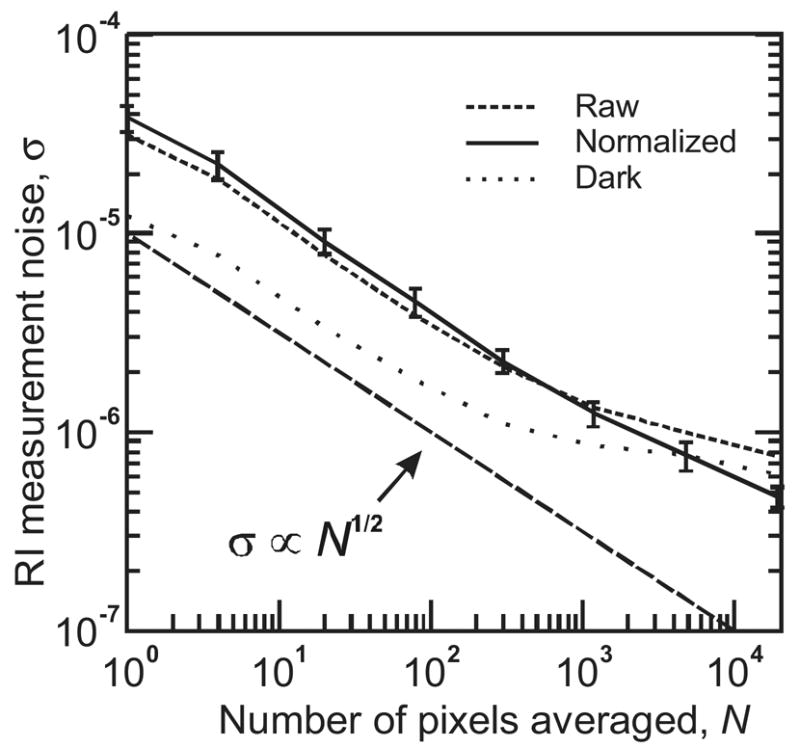
Imager noise characterization. Root-mean-square refractive index noise values were calculated from measurements of RI test solutions. Error bars indicate the standard deviation of calculated noise values across 32 measurements (eight sample regions, four solutions). Calculation was then repeated for subsets of each sample region, ranging from 160 × 120 pixels down to 1x1 pixel. Shown for comparison are the equivalent RI noise measured with no illumination (detector dark noise), and a line showing the expected inverse-square-root relationship between the number of pixels averaged and RI measurement noise.
The raw and normalized curves were calculated for each of the eight active regions of the image, and for each of the four solutions measured. In Fig. 4 the average of these 32 curves are plotted. The error bars shown on the normalized curve indicate the standard deviation of the 32 values at each point. Error bars for raw and dark traces were similar, and are not shown to maintain clarity of the plot.
For the random shot noise which dominates at low levels of averaging, it is expected that averaging of N pixels will yield a standard deviation inversely proportional to N1/2. Increased averaging will reduce the relative significance of shot noise, allowing systematic noise components such as light source fluctuations to become dominant (Chinowsky et al., 2003; Fu et al., 2004). The data of Fig. 4 support this prediction. Beginning with σ = 2–3 × 10⁻⁵ for 1×1 pixel regions, raw noise level is observed to reduce proportional to N−1/2, reaching ~2 × 10⁻⁶ when 300 pixels are averaged. As the number of pixels is increased, the raw noise level continues to decrease, but at a diminishing rate, reaching 8 × 10⁻⁷ for a 19200 pixel region. The normalized noise level, in contrast, continues to decrease almost proportional to N−1/2, reaching a noise level of 4–5 × 10⁻⁷ for 19200 pixels. This compares favorably with the state-of-the-art A100 non-imaging SPR instrument manufactured by the leading SPR company, Biacore (www.biacore.com). As specified by Biacore, the A100 can monitor up to 20 surface regions, with typical noise of <3 × 10⁻⁷ RI with similar time resolution. Our device therefore delivers performance almost equal to the A100, in a much smaller package and at a much lower cost.
Normalization successfully reduces measured noise to a level which is inversely proportional to the square root of the number of pixels averaged. In contrast, the un-normalized data decreases at a slower rate for high levels of averaging, indicating the presence of noise components which are correlated across pixels and cannot be reduced with averaging. This characteristic is also observed in the dark noise curve, suggesting that an important component of this correlated noise is produced by the detector electronics. Temperature effects may also contribute to this noise component – the imager does not include active temperature control, and temperature drift over the course of the experiment could also introduce a correlated noise component. A production SPR imager would include active temperature control to eliminate this. However, in the current system, passive temperature control is quite effective. The sensing prism and supporting baseplate provides a large thermal mass for temperature stabilization, and the sensing substrate in the microfluidic card is fairly well insulated from the air by plastic layers. In the experiment presented in Fig. 4, drift of 14 RU was observed over an experiment time of 22 minutes, or 0.6 RU/min. For comparison, the specification for the Biacore A100, a production device with comprehensive temperature control, is only a factor of two better, listed as 0.3 RU/min.
To further improve resolution at high levels of averaging, higher-resolution electronics could be used; our relatively inexpensive camera used an 8-bit analog to digital converter, compared to 12-bit and higher devices found in more expensive devices.
5.3. Spatial resolution tests
Tests using PDMS stamps showed a well-focused image across the sensor’s active area of 7.4 × 10 mm (Fig. 5). The images show greater resolution in the horizontal (non-foreshortened) direction. Focus remained consistent as the angle of illumination was scanned from 62 degrees to 65.5 degrees, with some softening of features and loss of contrast at the highest angles.
Figure 5.
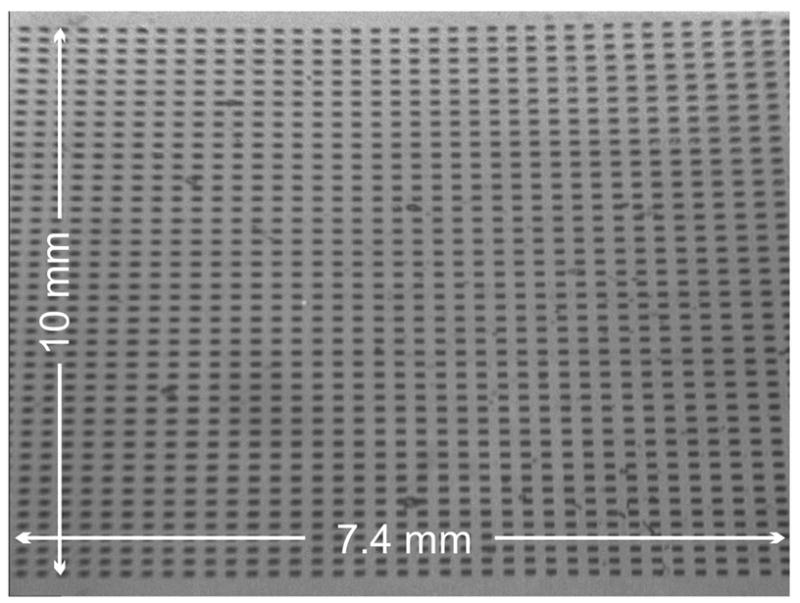
Resolution test using PDMS stamp. Water is trapped in 100×100 μm pits on the underside of the stamp, forming dark squares.
5.4. Biosensing results
The channel dimensions and flow rates used in these experiments ensure low Reynolds number, high Peclet number flow conditions. This provides for laminar fluid flow and negligible diffusion across the different flow streams in the channel. Antiphenytoin antibody flowing across the BSA-phenytoin functionalized surface will adsorb at a rate determined by the concentration of free antibody binding sites immediately adjacent to the BSA-phenytoin substrate. The concentration of the antibody binding sites will be determined by a number of factors including the volumetric flow rate, distance downstream of the leading edge of the BSA-phenytoin region, the antibody-phenytoin reaction rate, and antibody lateral and rotational diffusion rates. However, since the conditions in all three flow streams are identical with the exception of the concentration of competitor added, the rate of antibody adsorption as determined by the rate of SPR intensity increase will correlate with the concentration of competitor in the sample (phenytoin, in this case). The three flow streams allow for the creation of a two-point run-time calibration of the assay simultaneous with the sample measurement.
Results from two representative assay experiments are shown in Fig. 6. Over the ~250 second course of the experiment, the brightness of each region increases proportional to the amount of free antibody binding to the surface. The assay is a competition assay in which the binding of antibody to the surface is suppressed by the presence of the target analyte in the test solution. Thus, the greatest SPR response (binding of antibody) is observed when the least amount of the specific analyte is present. When phenytoin is present in the sample, binding rate decreases due to reduction of free antibody. As shown in Fig. 6, 0 nM phenytoin produced the highest binding rate, with 25 nM, 50 nM, and 75 nM phenytoin producing progressively less binding. For the phenytoin assay to be specific, we require that the binding of phenytoin antibody be suppressed by the presence of phenytoin, but not by the presence of other substances. In the rightmost plot, we see that the response to 50 nM cortisol is similar to that for 0 nM phenytoin. The fact that the binding of the phenytoin antibody to the surface is not perturbed by the presence of 50 nM cortisol shows that there is little binding of the phenytoin antibody to cortisol, as desired for a specific assay. This assay is in the process of being characterized and validated, and will be described in detail in a future publication. The results presented here demonstrate the ability to conduct rapid assays for small molecule analytes using SPR imaging.
Figure 6.
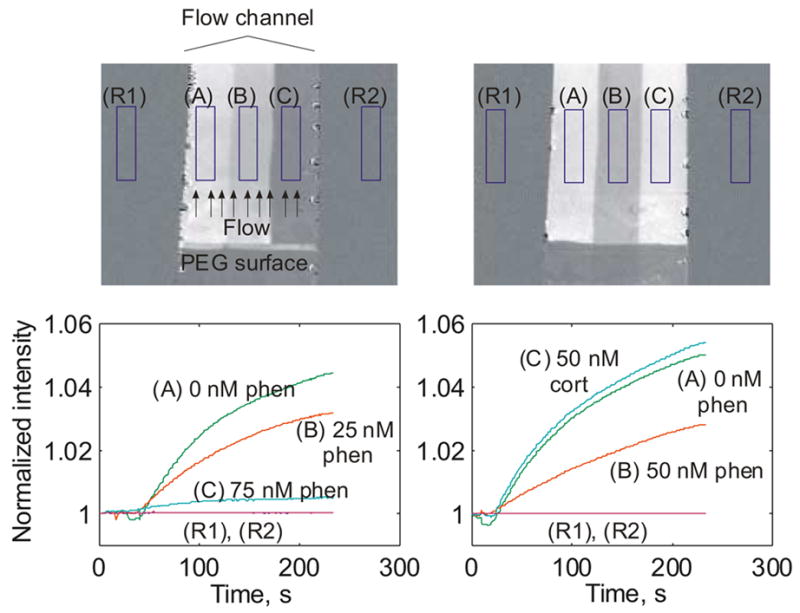
Imaging assays for phenytoin. Gold surfaces were coated with a nonfouling layer (dark region on bottom) and BSA-phenytoin. Three fluid streams containing different concentrations of phenytoin mixed with 100 nM phenytoin antibody were flowed across the surface simultaneously. Sample streams remain distinct due to laminar flow. Over the ~250 second course of the experiment, the brightness of each region increases proportional to the amount of free antibody binding to the surface, and is expected to decrease with increasing analyte concentration. Experiments confirm this, with 0 nM phenytoin producing the highest binding rate, with 25 nM, 50 nM, and 75 nM phenytoin producing monotonically decreasing rates of binding. In the rightmost plot, specificity of response was tested by assaying a 50 nM cortisol solution. Binding similar to that for 0 nM phenytoin was observed, confirming specificity of the phenytoin antibody.
6. Conclusions
We have described the construction and testing of a new, compact, high-performance SPR imaging instrument. Using refractive index test solutions, performance of the imager in terms of RI noise and drift was measured and found to be almost equal to that of a large, expensive state-of-the-art commercial device. Utility of the device for biological measurements was illustrated using a competition immunoassay for the small molecule phenytoin, implemented in a simple microfluidic flowcell. A complete measurement system based on this technology will include microfluidic assay cards under development which will integrate and automate much of the assay procedure currently performed manually. Passive temperature control was found to be effective in the current device, however active temperature control will be added to permit versatility in portable operation. The simplicity of the instrument design will enable further miniaturization and reduction of costs, with the ultimate goal of producing a device which can be used for point-of-care diagnostics in a variety of settings.
Acknowledgments
This work was supported by NIH grant U01DE14971-02.
Footnotes
Publisher's Disclaimer: This is a PDF file of an unedited manuscript that has been accepted for publication. As a service to our customers we are providing this early version of the manuscript. The manuscript will undergo copyediting, typesetting, and review of the resulting proof before it is published in its final citable form. Please note that during the production process errors may be discovered which could affect the content, and all legal disclaimers that apply to the journal pertain.
References
- Arena G, Contino A, Longo E, Sgarlata C, Spota G, Zito V. Chem Commun. 2004;16:1812–1813. doi: 10.1039/b408326c. [DOI] [PubMed] [Google Scholar]
- Brody J, Yager P. Sens Actuators A. 1997;58:13–18. [Google Scholar]
- Chinowsky TM, Mactutuis T, Fu E, Yager P. Proc SPIE. 2004;5261:173–182. [Google Scholar]
- Chinowsky TM, Quinn JG, Bartholomew DU, Kaiser R, Elkind JL. Sens Actuators, B. 2003;91:266–274. [Google Scholar]
- He L, Musick MD, Nicewarner SR, Salinas FG, Benkovic SJ, Natan MJ, Keating CD. J Am Chem Soc. 2000;122:9071–9077. [Google Scholar]
- Fu E, Chinowsky T, Foley J, Weinstein J, Yager P. Review of Scientific Instruments. 2004;75(7):2300–2304. [Google Scholar]
- Inamori K, Kyo M, Nishiya Y, Inoue Y, Sonoda T, Kinoshita E, Koike T, Katayama Y. Anal Chem. 2005;77:3979–3985. doi: 10.1021/ac050135t. [DOI] [PubMed] [Google Scholar]
- Kanda V, Kitov P, Bundle DR, McDermott MT. Anal Chem. 2005;77:7497–7504. doi: 10.1021/ac050423p. [DOI] [PubMed] [Google Scholar]
- Kim M, Jung SO, Park K, Jeong E-J, Joung H-A, Kim T-H, Seol D-W, Chung BH. Biochem Biophys Res Commun. 2005;338:1834–1838. doi: 10.1016/j.bbrc.2005.10.155. [DOI] [PubMed] [Google Scholar]
- Kretschmann E, Raether H. Z Naturforsch, A: Phys Sci. 1968;23A:2135–2136. [Google Scholar]
- Nelson BP, Grimsrud TE, Liles MR, Goodman RM, Corn RM. Anal Chem. 2001;73:1–7. doi: 10.1021/ac0010431. [DOI] [PubMed] [Google Scholar]
- Otsuki S, Tamada K, Wakida S. Appl Opt. 2005;44:3468–3472. doi: 10.1364/ao.44.003468. [DOI] [PubMed] [Google Scholar]
- Piliarik M, Vaisocherova H, Homola J. Biosens Bioelectron. 2005;20:2104–2110. doi: 10.1016/j.bios.2004.09.025. [DOI] [PubMed] [Google Scholar]
- Pyo H-B, Shin Y-B, Kim M-G, Yoon HC. Langmuir. 2005;21:166–171. doi: 10.1021/la0486382. [DOI] [PubMed] [Google Scholar]
- Rothenhausler B, Knoll W. Nature. 1988;332:615–617. [Google Scholar]
- Smith W. Modern Optical Engineering. 3. New York: McGraw-Hill Professional; 2000. pp. 55–57. [Google Scholar]
- Steiner G. Anal Bioanal Chem. 2004;379:328–331. doi: 10.1007/s00216-004-2636-8. [DOI] [PubMed] [Google Scholar]
- Stroock A, Dertinger SKW, Ajdari A, Mezic I, Stone HA, Whitesides GM. Science. 2002;295:647–651. doi: 10.1126/science.1066238. [DOI] [PubMed] [Google Scholar]
- Usui-Aoki K, Shimada K, Nagano M, Kawai M, Koga H. Proteomics. 2005;5:2396–2401. doi: 10.1002/pmic.200401171. [DOI] [PubMed] [Google Scholar]
- Wark AW, Lee HJ, Corn RM. Anal Chem. 2005;77:3904–3907. doi: 10.1021/ac050402v. [DOI] [PubMed] [Google Scholar]
- Wilkop T, Wang Z, Cheng Q. Langmuir. 2004;20:11141–11148. doi: 10.1021/la048177k. [DOI] [PubMed] [Google Scholar]
- Wolf LK, Fullenkamp DE, Georgiadis RM. JACS. 2005;127:17453–17459. doi: 10.1021/ja056422w. [DOI] [PubMed] [Google Scholar]
- Yeatman E, Ash EA. Electron Lett. 1987;23:1091–1092. [Google Scholar]
- Yeatman EM, Ash EA. SPIE proc. 1988;897:100–107. [Google Scholar]
- Yuk JS, Kim H-S, Jung J-W, Jung S-H, Lee S-J, Kim WJ, Han J-A, Kim Y-M, Ha KS. Biosens Bioelectron. 2006;21:1521–1528. doi: 10.1016/j.bios.2005.07.009. [DOI] [PubMed] [Google Scholar]


