

Abstract
A library of amino acid-fatty acid conjugates (elmiric acids) was synthesized and evaluated for activity as potential anti-inflammatory agents. The compounds were tested in vitro for their effects on cell proliferation and prostaglandin production and compared with their effects on in vivo models of inflammation. LPS stimulated RAW 267.4 mouse macrophage cells was the in vitro model and phorbol ester-induced mouse ear edema served as the principal in vivo model. The prostaglandin responses were found to be strongly dependent on the nature of the fatty acid part of the molecule. Polyunsaturated acid conjugates produced a marked increase in media levels of i15-deoxy-PGJ2 with minimal effects on PGE production. It is reported in the literature that prostaglandin ratios in which the J series predominates over the E series promote the resolution of inflammatory conditions. Several of the elmiric acids tested here produced such favorable ratios suggesting that their potential anti-inflammatory activity occurs via a novel mechanism of action. The ear edema assay results were generally in agreement with the prostaglandin assay findings indicating a connection between them.
Keywords: endocannabinoid, anti-inflammatory, ear edema, prostaglandin
1. Introduction
Acid congeners of anandamide or lipoamino acids, here named elmiric acids, exist as endogenous substances and may have a role in regulating tissue levels of anandamide1. This hypothesis received support from a study that showed that such a substance, N-arachidonylglycine (NAGly, Fig.1), is indeed an endogenous constituent of many tissues and occurs at higher concentrations than anandamide2. An interesting property of NAGly is its potent inhibitory effect on FAAH, the enzyme primarily responsible for the termination of anandamide action via hydrolysis. As could be expected, NAGly treatment in both in vitro and in vivo models, leads to a robust increase in anandamide concentrations3. It was also observed that several of the elmiric acids profoundly reversed the prostaglandin (PG) profile from a pro inflammatory to an anti-inflammatory state in a cell culture model. This has formed the basis for a hypothesis on the mechanism for the potential anti-inflammatory action of these compounds. At this point, it is assumed that these two effects occur independently of one another, however, the possibility that the amidase inhibition and PG ratio effects are somehow interrelated cannot be ruled out.
Fig. 1. The structure of the endocannabinoid anandamide and its endogenous analog, N-arachidonylglycine (NAGly).
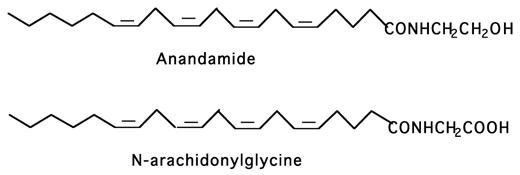
Several amino acid – fatty acid combinations have been found in tissue extracts 2.
The older literature on this topic is mainly concerned with lipoamino acids of bacterial origin 4–8. These involve amino acid conjugation with complex and unusual fatty acids and little is known about their function in bacteria. More recently, attention has been given to the lipoamino acids present in mammalian species in part because of their possible relationships to the endocannabinoids. The origin of NAGly in vivo is not well understood, however, it is an endogenous substance found in rat brain and other sites that occurs in amounts greater than the closely related endocannabinoid, anandamide2. In this same report, it was suggested that NAGly might have analgesic properties similar to those reported for anandamide9,10 but would be inactive in assays for psychotropic action such as the "ring test11. The latter was in agreement with a report showing a lack of affinity by NAGly for the cannabinoid receptor, CB112. This activity profile is reminiscent of that observed for THC-11-oic acid and its analog ajulemic acid13. Based on preliminary data, NAGly appears to be the endogenous ligand for the orphan G-protein-coupled receptor GPR18 14,15. Like anandamide, NAGly is also a substrate for COX-2 giving rise to amino acid conjugates of the prostaglandins 16. Other amino acid conjugates have been found in diverse tissues17 and N-arachidonoyl-L-serine has recently been isolated from rat17 and from bovine brain and reported to have vasodilatory effects in rat mesenteric arteries18. Finally, NAGly inhibits the glycine transporter, GLYT2a, which is expressed in pre synaptic glycinergic neurons 19.
We have defined the term elmiric acids as compounds that conform to the general structure shown in Figure 2 for which a short hand nomenclature system is proposed. Using this system N-arachidonylglycine would be written as: EMA-1 (20:4). EMA stands for elmiric acid; each amino acid constituent is assigned a number, e.g. 1=glycine; 2=alanine, etc. The identity of the acyl substituent is indicated in parentheses; e.g. (20:4)=arachidonoyl; (16:0)=palmitoyl, etc. This system would also accommodate any number of unnatural amino acids. We are proposing this nomenclature to simplify the naming of these compounds; it has not been approved or adopted by any official body.
Fig. 2. The general structure for the elmiric acids.
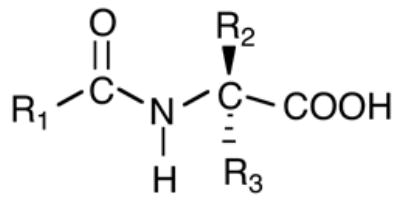
This name has been chosen to designate the entire family of molecules that includes both the naturally occurring lipoamino acids such as NAGly and synthetic analogs where R1 is a long chain alkyl group and R2 and R3 can be a wide range of substituents.
In this report, we have screened in vitro a library of elmiric acids consisting of glycine and l-alanine conjugates with a series of ten fatty acids. The objective was to determine whether any of these compounds are candidates for further study as potential anti-inflammatory agents. Positive findings would support further studies in which the amino acid moieties would be expanded not only to include naturally occurring molecules but also synthetic examples. The ultimate goal is to discover a potent and efficacious molecule for the treatment of conditions characterized by acute and chronic inflammation.
2. Chemistry
Several of the elmiric acids were synthesized in the university laboratories using the procedures described below and shown in Scheme 1. Briefly this involved condensation of the acid chloride with the amino acid methyl ester in the presence of triethylamine followed by saponification with lithium hydroxide to yield the elmiric acid. However, the majority of the compounds came from a commercially available library of endocannabinoids obtained from Biomol International LP (Plymouth Meeting PA 19462) that contains sixty examples, half of which would fall into the category of elmiric acids. Table 1 is a partial list of these compounds. They are composed of glycine, L-alanine and γ-aminobutyric acid (GABA) conjugates with ten different naturally occurring long-chain fatty acids ranging from palmitic to docosahexaenoic acid.
Scheme 1.
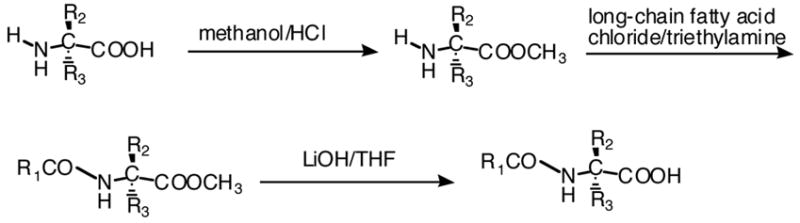
General synthetic procedure for the elmiric acids.
Table 1.
Library of Compounds
| Chemical Name | EMA NAME |
|---|---|
| Palmitoyl glycine | EMA-1 (16:0) |
| Oleoyl glycine | EMA-1 (18:1) |
| Linoleoyl glycine | EMA-1 (18:2) |
| gamma- Linolenoyl glycine | EMA-1 (γ–18:3) |
| Eicosa-11Z,14Z-dienoyl glycine | EMA-1 (20:2) |
| Dihomo-gamma-linolenoyl glycine | EMA-1 (γ–20:3) |
| Arachidonoyl glycine | EMA-1 (20:4) |
| Eicosapentaenoyl glycine | EMA-1 (20:5) |
| Docosatetra-7Z,10Z,13Z,16Z-enoyl glycine | EMA-1 (22:4) |
| Docosahexaenoyl glycine | EMA-1 (22:6) |
| Palmitoyl l-alanine | L-EMA-2 (16:0) |
| Oleoyl l-alanine | L-EMA-2 (18:1) |
| Linoleoyl l-alanine | L-EMA-2 (18:2) |
| gamma- Linolenoyl l-alanine | L-EMA-2 (γ–18:3) |
| Eicosa-11Z,14Z-dienoyl l-alanine | L-EMA-2 (20:2) |
| Dihomo-gamma-linolenoyl l-alanine | L-EMA-2 (γ–20:3) |
| Arachidonoyl l-alanine | L-EMA-2 (20:4) |
| Eicosapentaenoyl l-alanine | L-EMA-2 (20:5) |
| Docosatetra-7Z,10Z,13Z,16Z-enoyl l-alanine | L-EMA-2 (22:4) |
| Docosahexaenoyl l-alanine | L-EMA-2 (22:6) |
| Palmitoyl GABA | EMA-9 (16:0) |
| Oleoyl GABA | EMA-9 (18:1) |
| Linoleoyl GABA | EMA-9 (18:2) |
| gamma- Linolenoyl GABA | EMA-9 (γ–18:3) |
| Eicosa-11Z,14Z-dienoyl GABA | EMA-9 (20:2) |
| Dihomo-gamma-linolenoyl GABA | EMA-9 (γ–20:3) |
| Arachidonoyl GABA | EMA-9 (20:4) |
| Eicosapentaenoyl GABA | EMA-9 (20:5) |
| Docosatetra-7Z,10Z,13Z,16Z-enoyl GABA | EMA-9 (22:4) |
| Docosahexaenoyl GABA | EMA-9 (22:6) |
3. Results and discussion
3.1. Effects on cell proliferation
Initially, the library shown in Table 1 was screened for anti-proliferative activity in an in vitro assay using the mouse macrophage cell line RAW264.7 as the drug target. Table 2 shows the results of this study in which each compound was tested at three concentrations, 0.1, 1.0, and 10 uM, and compared with vehicle treated cells as a control. Based on these limited data, it is not possible to assign a rank order for this group of substances, however, it is clear that many produced around 90% reduction of cell numbers with increasing concentrations between 1.0 to 10 uM. In the glycine series this amounted to 6 out of 10 compounds whereas in the l-alanine series 9 out of 10 compounds were inhibitory at 10uM. A cross series comparison showed general agreement with one exception, namely N-palmitoyl glycine, which was inactive while its l-alanine counterpart showed 89% inhibition at 10uM. Palmitoyl glycine is an abundant component of the lipid fraction from rat skin and has significant effects on calcium levels in F11 cells, considered to be a model for dorsal root ganglion neurons (Bradshaw et al., unpublished data). It also can reduce heat stimulated firing of nociceptive neurons. The results obtained with the γ-aminobutyric acid (GABA) conjugates were similar to most of the other elmiric acids tested (data not shown).
Table 2. Effects of elmiric acids on the proliferation of mouse macrophage RAW cells.
96 well plates were seeded with 500 RAW cells / 100ul media/well. The cells were incubated for 24hrs at 37°C and 5% CO2 removed from the incubator and a 1ul solution of each of the above compounds added with an N of 4. After 1hr., 1ul LPS (1 ug/ml) was added to each well and the cells returned to the incubator for 48 hrs. Cell numbers were determined with the CellTiter-Glo assay kit (Promega). Luminometer units are linearly proportional to the number of cells in each well and the values shown are the means of four wells.
| ′GLYCINE SERIES | L-ALANINE SERIES | ||||||
|---|---|---|---|---|---|---|---|
| Acyl group | Conc.* | MEAN | SD | T/C** | MEAN | SD | T/C** |
| DMSO+LPS | 0.0 | 4866 | 326 | 1.000 | 3889 | 369 | 1.000 |
| Palmitoyl | 0.1 | 5120 | 480 | 1.052 | 4541 | 249 | 1.168 |
| 1.0 | 5524 | 207 | 1.135 | 4670 | 248 | 1.201 | |
| 10 | 5108 | 851 | 1.050 | 432 | 46 | 0.111 | |
| Oleoyl | 0.1 | 5172 | 239 | 1.063 | 3637 | 339 | 0.935 |
| 1.0 | 5557 | 269 | 1.142 | 4533 | 535 | 1.166 | |
| 10 | 425 | 6 | 0.087 | 422 | 45 | 0.109 | |
| Linoleoyl | 0.1 | 5979 | 179 | 1.229 | 3955 | 236 | 1.017 |
| 1.0 | 4595 | 1793 | 0.944 | 4233 | 635 | 1.088 | |
| 10 | 713 | 24 | 0.147 | 621 | 55 | 0.160 | |
| γ-Linolenoyl | 0.1 | 5435 | 157 | 1.117 | 4247 | 636 | 1.092 |
| 1.0 | 5700 | 190 | 1.171 | 4557 | 173 | 1.172 | |
| 10 | 6602 | 1935 | 1.357 | 2696 | 511 | 0.693 | |
| Eicosa-11Z,14Z-dienoyl | 0.1 | 2945 | 982 | 0.605 | 3641 | 612 | 0.936 |
| 1.0 | 5738 | 179 | 1.179 | 4397 | 280 | 1.131 | |
| 10 | 609 | 3 | 0.125 | 605 | 4 | 0.156 | |
| Dihomo-γ-linolenoyl | 0.1 | 5486 | 494 | 1.127 | 4326 | 487 | 1.112 |
| 1.0 | 5563 | 122 | 1.143 | 4680 | 389 | 1.203 | |
| 10 | 647 | 20 | 0.133 | 637 | 12 | 0.164 | |
| Arachidonoyl | 0.1 | 5630 | 245 | 1.157 | 4781 | 530 | 1.229 |
| 1.0 | 6156 | 68 | 1.265 | 4735 | 398 | 1.218 | |
| 10 | 591 | 20 | 0.121 | 2110 | 1327 | 0.543 | |
| Eicosapentaenoyl | 0.1 | 5659 | 282 | 1.163 | 4270 | 758 | 1.098 |
| 1.0 | 5161 | 771 | 1.061 | 4798 | 518 | 1.234 | |
| 10 | 5937 | 367 | 1.220 | 4672 | 222 | 1.201 | |
| Docosatetra-7Z,10Z,13Z,16Z-enoyl | 0.1 | 5131 | 282 | 1.055 | 4668 | 382 | 1.200 |
| 1.0 | 5310 | 127 | 1.091 | 4415 | 734 | 1.135 | |
| 10 | 3574 | 655 | 0.734 | 618 | 22 | 0.159 | |
| Docosahexaenoyl | 0.1 | 5708 | 387 | 1.173 | 4452 | 419 | 1.145 |
| 1.0 | 5675 | 288 | 1.166 | 4176 | 251 | 1.074 | |
| 10 | 2103 | 888 | 0.432 | 1010 | 153 | 0.260 | |
3.2. Anti-inflammatory action in vitro
Data obtained with selected examples of elmiric acids from our library are shown in Table 3. These were chosen to provide a variety of fatty acid conjugates with either glycine or alanine to test for a possible stucture-activity relationship. With the latter, examples of both enantiomers were included to detect possible stereoselectivity. For comparison, the widely used NSAID naproxen, a COX inhibitor, was included. All of the elmiric acids were screened at two concentrations, 1 and 10 uM. A clear pattern emerged from this experiment in which compounds with saturated fatty acids have little or no effect on the ratio of PGJ/PGE while all of those with polyunsaturated fatty acids induced large increases. The control substance naproxen failed to cause a measurable increase even at a concentration of 50uM. This suggests a novel mechanism of action for the active elmiric acids. A modest degree of stereoselectivity was observed between the alanine containing D and L-EMA-2(20:4) isomers; interestingly, the D isomer was somewhat more active. Unlike the cell proliferation assay shown above, a possible structure-activity pattern seems to be present, suggesting that the PGJ/PGE ratio in RAW cells may be a useful preliminary screening procedure to identify anti-inflammatory activity.
Table 3. Effects of elmiric acids on the ratio of iPGJ/iPGE in RAW cell media.
48 well plates were seeded with 20,000 RAW cells / 500ul media and incubated for 20 hrs at 37° and 5% CO2. After washing, 500ul of serum free RPMI media was added to each well. Cells were then treated with 5ul in DMSO of each of the elmiric acids; final concentrations of agents were 1 or 10 uM (N = 3). After 30 minutes, 5ul LPS (1 ug/ml) was added to each well and the incubation continued for 2 hours. Media were then harvested, centrifuged at 800xg and 50ul from each tube assayed by ELISA with iPGE (Cayman) and iPGJ2 (Assay Design) enzyme immunoassay kits. Prostaglandin concentrations are in pg/ml.
| Treatment | Conc. | iPGJ2 | S.D. | iPGE2 | S.D. | J/E Ratio |
|---|---|---|---|---|---|---|
| DMSO+LPS | - | 136 | 84 | 120 | 3 | 1 |
| Naproxen | 2 | 57 | 51 | 106 | 6 | 1 |
| Naproxen | 10 | 70 | 38 | 75 | 9 | 1 |
| Naproxen | 50 | 119 | 44 | 81 | 2 | 1 |
| EMA-1(16:0) | 1 | 219 | 215 | 103 | 23 | 2 |
| EMA-1(16:0 | 10 | 401 | 194 | 128 | 12 | 3 |
| EMA-1(18:0) | 1 | 201 | 159 | 121 | 20 | 1 |
| EMA-1(18:0) | 10 | 159 | 26 | 126 | 1 | 1 |
| EMA-1(18.3) | 1 | 5042 | 1672 | 127 | 6 | 39 |
| EMA-1(18:3) | 10 | 80205 | 7534 | 289 | 19 | 277 |
| EMA-1(20:4) | 1 | 40407 | 10331 | 273 | 125 | 147 |
| EMA-1(20:4) | 10 | 97830 | 9805 | 425 | 180 | 229 |
| EMA-1(20:5) | 1 | 1729 | 249 | 126 | 14 | 13 |
| EMA-1(20:5) | 10 | 44729 | 8848 | 355 | 46 | 125 |
| D-EMA-2(16:0) | 1 | 281 | 46 | 256 | 35 | 1 |
| D-EMA-2(16:0) | 10 | 3079 | 3936 | 319 | 18 | 9 |
| L-EMA-2(16:0) | 1 | 261 | 55 | 251 | 21 | 1 |
| L-EMA-2(16:0) | 10 | 4177 | 1352 | 232 | 16 | 17 |
| D-EMA-2(20:4) | 1 | 1496 | 427 | 124 | 5 | 12 |
| D-EMA-2(20:4) | 10 | 28224 | 5201 | 269 | 27 | 104 |
| L-EMA-2(20:4) | 1 | 2345 | 252 | 241 | 18 | 9 |
| L-EMA-2(20:4) | 10 | 41059 | 3834 | 652 | 92 | 62 |
| L-EMA-2(22:6) | 1 | 3156 | 317 | 229 | 22 | 13 |
| L-EMA-2(22:6) | 10 | 62176 | 12969 | 437 | 153 | 142 |
Several literature reports suggest that an elevation of tissue concentrations of 15d-PGJ2 is associated with the resolution of an inflammatory condition20–23. This is thought to come about through the binding and activation of the transcription factor PPAR-γ followed by increased expression of anti-inflammatory factors. Previous studies in our lab showed that the synthetic cannabinoid analog ajulemic acid elevates i15d-PGJ2 in similar models, i.e. LPS-challenged fibroblast-like synovial cells (Stebulis et al. unpublished data).
The murine macrophage cell line RAW 264.7 has been used widely as a model for inflammatory responses in vitro. Moreover, we and others have reported data on cannabinoid induced responses in these cells 24–26. LPS is a potent inducer of inflammatory responses including, the arachidonic acid cascade, and has been used in a wide variety of models including some used to evaluate drug candidates. Our model consisted of a cultured monolayer of RAW cells in which media concentrations of prostaglandins were measured by ELISA following LPS stimulation. The use of immunoassay procedures always raises questions of specificity. Therefore, we have indicated that we measured immunoreactive prostaglandin as defined by the cross reactivities of the antiserum used by the manufacturer. It is also necessary to monitor PGE2 concentrations in our model since they may increase as well. In view of the fact that PGE2 is a pro inflammatory eicosanoid, a sharp increase in its level following drug treatment would possibly offset any benefit resulting from an increase in PGJ concentration. It is suggested that PGJ/PGE ratio measurements may be a useful initial test for anti inflammatory activity.
3.3. Anti-inflammatory effects in vivo
In vivo data on a small group of the elmiric acids have been obtained and are shown in Figures 3–7. These specific examples were chosen on the basis of their responses in the in vitro assay for the PGJ/PGE in mouse macrophages (Table 3). Both active and inactive examples were selected to determine whether or not an SAR could be demonstrated in these whole animal models. Several examples containing unnatural amino acids were also tested to study the effect of steric factors. The in vivo assay models used have been previously described in a variety of applications including proof of principle studies for anti inflammatory agents 27–32. However, complete dose response studies and a much larger series of compounds will be needed to confirm the findings shown here.
Figure 3. Effects of the elmiric acids in the mouse paw edema model.
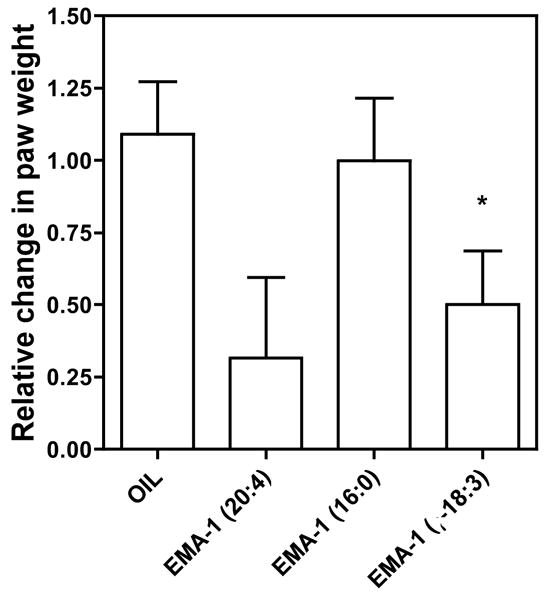
The compounds were dissolved in safflower oil and administered orally at 30 mg/kg. After 60 min, 50 ul of the 0.5% arachidonate in pH 8.3 carbonate buffer was injected into the plantar surface of the left (ipsilateral) hind paw of each mouse. The right (contra lateral) paws were injected with 50 ul of the buffer vehicle. This step was done with mice under deep halothane anesthesia. After 2 hours, mice were euthanized with halothane, both hind paws severed at the ankle joint and the weights recorded. Values shown are the means ± s.e.m. p<0.05 Plots and statistical analyses were done using Prism by GraphPad.
Figure 7. Dose related reduction of phorbol ester induced ear edema in the mouse.
All of the conditions were the same as in Figure 6 except that the drugs were dissolved in dimethylacetamide (DMA) instead of acetone. p<0.05.
Note: EMA-8 = methionine.
Suppression of chemically induced paw edema in mice is a long-standing assay for assessment of an agent’s potential anti-inflammatory activity 33–39,32. In prior studies, several cannabinoids40 and a number of NSAIDs tested in this model exhibited inhibitory effects on chemically induced edema. Figure 3 shows a single dose comparison of three glycine derivatives in this assay with arachidonate as the edema inducer. Some suppression was seen with the polyunsaturated compounds, however the effects were barely statistically significant. Thus, further studies using this assay were not carried out. Induction of inflammation by carrageenan in the paw edema assay gave an SAR different than that predicted by the prostaglandin ratio screen with EMA-1(16:0) being a potent anti-inflammatory agent (data not shown). At this time we cannot explain these differences, however, it seems clear that the nature of the assay will influence the relative activities of the elmiric acids in reducing an inflammatory reaction.
Figure 4 shows several examples of the effects of elmiric acids in the subcutaneous pouch assay using two methods for inducing an inflammatory response, namely, a combination of cytokines in panel A and carrageenan in panel B. The subcutaneous air pouch simulates a synovium lined joint space by providing a blind connective tissue cavity without a mesothelial basement membrane; the pouch lining has the two cell types (fibroblasts and macrophage-like cells) common to synovia41–43. While the precision of the assay was improved over the paw edema, an unexpected discrepancy arose with the palmitoyl derivatives when carrageenan was the inducer. There is no obvious explanation for this finding and further studies are needed to address this question. Thus, pending a better understanding of this issue, it was decided not to use this assay.
Figure 4. Effects of elmiric acids in the mouse subcutaneous pouch assay.
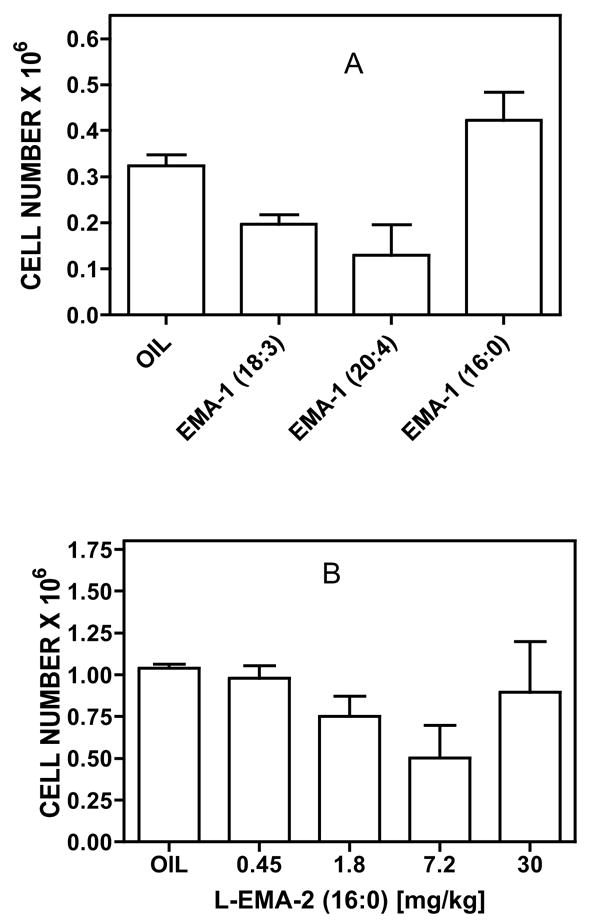
Subcutaneous pouches were generated in male CD-1 mice (30–35g) by injection of air on two-three successive occasions. Panel A. Drugs were given orally in safflower oil (50ul) at a dose of 20mg/kg. After 60 min, cytokines TNF-a and IL1-b were injected into the pouches with mice under halothane anesthesia. After 90 min, mice were euthanized with halothane, cells harvested and counted. Panel B. One hour after oral dosing at the indicated levels, 2% carrageenan was injected into the pouches. The pouch contents were allowed to incubate for 4 hrs following which the mice were euthanized with halothane and the cells harvested and counted. Plots and statistical analyses were done using Prism by GraphPad. N=4 mice/group. P<0.05 by ANOVA
In Figure 5 we show the results of a preliminary experiment comparing two methods, using either arachidonic acid or phorbol ester, for inducing ear edema in the mouse. Both procedures yielded useful data, however, we found that the phorbol ester data were more precise and more easily obtained. This may be due to the transient nature of the induction produced by arachidonic acid. Nevertheless a favorable comparison between EMA-1(20:4) and dexamethasone, a potent anti-inflammatory agent, was demonstrated (Panel A). All subsequent studies used phorbol ester as the inducing agent. In Panel B ear edema was induced by the topical application of phorbol ester in acetone. EMA-1(20:4) gave a comparable reduction in ear thickness of about 40–50% as that obtained in the arachidonate model. The response obtained with EMA-23(20:4) was similar suggesting that substituted amino acids do not lose activity.
Figure 5. Reduction of arachidonic acid (A) phorbol ester (B) induced ear edema in the mouse.
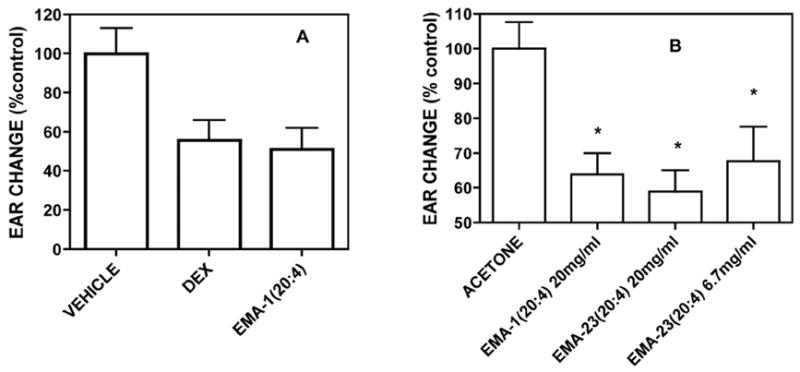
CD-1 male mice between 34 and 40g were treated as described in Experimental. Treatment was initiated by the application of vehicle (10ul), dexamethasone (10ug/ear) or EMA-1(20:4) and EMA-23(20:4) (200ug/ear) in 10ul acetone. Values shown are expressed as the differences between the ipsi lateral (induced) and contra lateral (vehicle control) ears in microns. Paired t-test results were: p<0.02 for vehicle vs. dexamethasone and p<0.007 for vehicle vs. EMA-1(20:4). Plots and statistical analyses were done using Prism by GraphPad. N = 8.
Note: EMA-23 = 1-aminocyclopropane-carboxylic acid
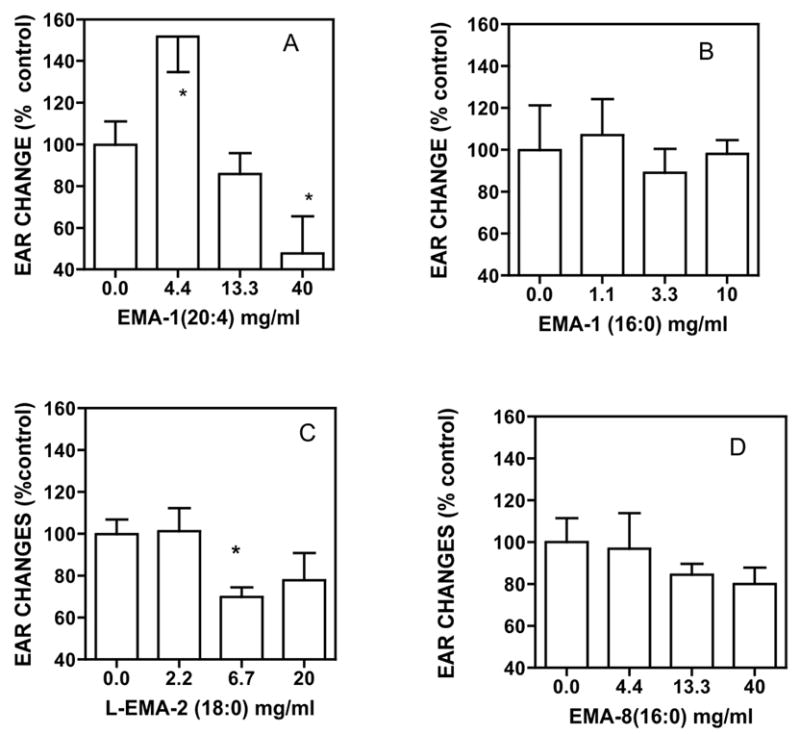
The four examples of elmiric acids tested at three doses shown in Figure 6 suggests that the anti-inflammatory response is sensitive to both fatty acid and amino acid structure. Comparing 6B and 6D, namely, oleoyl and arachidonoyl show a preference for greater unsaturation in reducing ear edema. When 6A and 6B are compared it appears that the substitution pattern at the α position can be an important factor. However, in 6C and 6D, the two α disubstituted arachidonoyl examples are active as are the compounds shown in Figure 5.
Figure 6. Dose related reduction of phorbol ester induced ear edema in the mouse.
Treatment was initiated by the application of vehicle (10ul acetone), or drug in 10ul acetone to the ipsi lateral ears and only acetone to all contra lateral ears. 30 min after drug treatment 10ul of the PMA (phorbol ester) solution in acetone was applied to all ipsi lateral ears and 10ul of acetone to all of the contra lateral ears. After 4 hrs, all ear thicknesses were measured using a digital micrometer. Data are expressed as the differences between the ipsi and contra lateral ears in microns. Plots and statistical analyses were done using Prism by GraphPad. N = 4; p<0.05.
Note: EMA-22 = 1,1-dimethylglycine; EMA-25 = 1-aminocyclohexane-carboxylic acid.
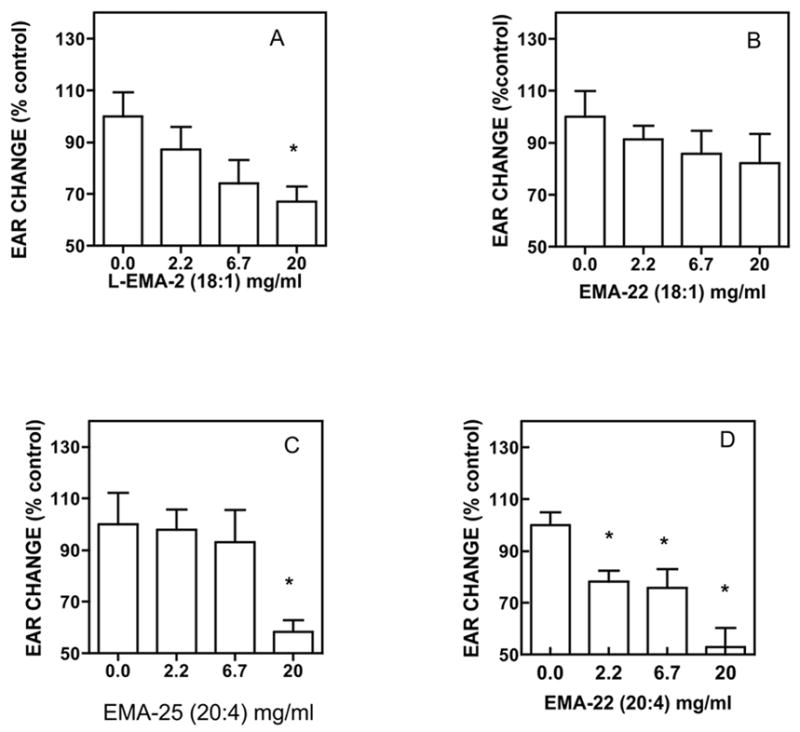
The data in Figure 7 were obtained using dimethylacetamide rather than acetone as the formulation vehicle. This was necessary due to poor solubility of the fully saturated elmiric acids in acetone. As predicted by the results of the prostaglandin ratio screen, the palmitoyl (7B) and steroyl (7C) congeners showed little or no activity as anti-inflammatory agents. The results in 7A suggest a possible biphasic response, however, this needs a more detailed study before such a conclusion is made. As positive controls44, indomethacin (20 mg/ml), phenidone (40 mg/ml) and dexamethasone (1 mg/ml) were studied using the conditions described in Figure 7. Phenidone, a lipoxygenase inhibitor, had no effect whereas indomethacin and dexamethasone produced some decrease in ear thickness (data not shown) demonstrating a favorable comparison for the elmiric acids with established anti-inflammatory agents.
3.4. Possible anti-inflammatory mechanisms
In animal models of acute vs chronic inflammation (carrageenan-induced pleurisy and collagen induced arthritis, respectively), COX inhibition suppresses endogenous 15d-PGJ2 production and prolongs the inflammatory phase whereas administration of 15d-PGJ2 has been shown to promote resolution of inflammation45,21. Prostaglandins released during an inflammatory response derive from the sequential activity of COX-2 on free arachidonic acid released from cell membranes and the activity of specific terminal synthases on the prostaglandin endoperoxide, PGH2. This process is depicted in Scheme 2. The dehydration product of PGD2, 15d-PGJ2, antagonizes inflammatory signaling pathways mediated by the transcription factors NF kappa-B, AP-1, and STAT, suppresses production of matrix metalloproteinases (MMPs) and other mediators of inflammation, prevents joint damage in rats with adjuvant arthritis, and generally acts to facilitate resolution of inflammation serving as a negative regulator of inflammation.
Scheme 2. Putative mechanism of action for the elmiric acids.
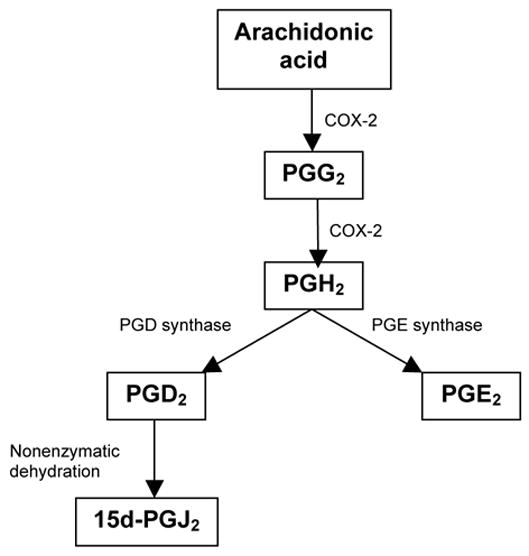
During an inflammatory response, cells are activated to release arachidonic acid. Activity of the bi functional enzyme COX-2 oxidizes arachidonic acid to PGG2 and a subsequent peroxidase reaction yields PGH2. Then, under the influence of terminal synthases, PGD2 and PGE2 are formed. PGD2 is then converted to the PGJ series in an unregulated manner. Resolution of inflammation occurs when the PGJ series predominates over the PGE series. The elmiric acids, which are not COX-2 inhibitors, apparently up regulate PGD synthase without affecting PGE synthase.
The mechanisms responsible for the anti-inflammatory and joint protective properties of the synthetic cannabinoid ajulemic acid are currently being studied in our lab 46. Although the elmiric acids are structurally dissimilar to ajulemic acid, there are certain similarities in their actions. In preliminary experiments, addition of ajulemic acid to human fibroblast-like synovial cells (FLS) in vitro increased arachidonic acid release and COX-2 expression with a subsequent marked increase in15d-PGJ2 production without an appreciable change in PGE2 synthesis (Stebulis et al. unpublished findings). The stimulatory effect of ajulemic acid could be reduced by pretreatment with the CB2 antagonist SR144728 but not with the CB1 antagonist SR141716a. These remarkable results are potentially important in light of accumulating evidence that the timing of COX-2 expression may determine its potential to promote either initiation or resolution of inflammation by differential production of prostaglandins, depending on the stage and progression of the inflammatory response 47. Moreover, we have observed that EMA-1(20:4) causes the mobilization of free arachidonic acid in RAW cells from sources other than the elmiric acid (unpublished data). These considerations provided the rationale for the current studies on the effects of the elmiric acids on prostaglandin ratios described above.
4. Summary and conclusions
The goal of this project was to discover a structure-activity relationship for the elmiric (lipoamino) acids as potential anti- inflammatory agents. To this end, a screening procedure was developed to allow the selection of molecules for testing in intact animal models for anti-inflammatory activity. The procedure is based on the concept that prostaglandins can mediate either pro or anti-inflammatory actions depending on their molecular composition. While PGE2 is dominant during the development of inflammation, prostaglandins of the J series are dominant during the resolution of an inflammatory condition. Thus, compounds that promote the synthesis of the latter without significantly raising the level of the former could be considered as good candidates for the treatment of inflammation. The findings reported here support this hypothesis. Specifically, elmiric acids with unsaturated structures generally produced a favorable prostaglandin ratio and were effective in reducing in vivo responses to pro inflammatory agents. Analogs with saturated structures did not enhance the J prostaglandins and had only minor effects in vivo. These observations can now be applied to the search for drug candidates in larger libraries of elmiric acids and possibly in other families of compounds.
5. Experimental
5.1. General chemical methods
All materials were obtained from commercial sources and used without further purification. For TLC, Silica Gel 60 F254 plates from Merck were used with detection by UV light or iodine vapor chamber. Acid chlorides were obtained from Nu-chek Prep, Inc. (Elysian, MN). Amino acids and esters were from Sigma-Aldridge.
5.2. General procedure for synthesis
Compounds not available commercially in the Biomol library were prepared as follows.
Esterification: The amino acid (200 mg) is dissolved in 30 ml of methanol saturated with HCl and refluxed for 6 hrs. The solvent is then removed under vacuum and the crude product dissolved in ethyl acetate and partitioned with saturated bicarbonate to remove traces of unreacted amino acid. Conjugation: the ester is dissolved in methylene chloride / triethylamine and cooled in ice. Commercially available fatty acid chloride (100 mg) (Nucheck) in methylene choride is added and the mixture allowed to react for 4 hrs. on ice. The mixture is then quenched on ice and extracted with ethyl acetate. After washing with dilute HCl, saturated bicarbonate and water, the solution is dried over sodium sulfate and evaporated to a clear oil. Saponification: the ester is dissolved in THF and treated under nitrogen with an equal volume of 1N LiOH for 24 hrs. at room temperature with stirring. Silica gel chromatography is used to purify the crude product whose identity is confirmed by mass spectral and NMR analysis.
5.3. N-arachidonoyl-1,1-dimethylglycine; EMA-22 (20:4)
Waxy low melting off-white solid. TLC: 10% methanol/methylene chloride; Rf 0.42. 1H NMR (250 MHz CDCl3) d 5.93 (bs, 1H), 5.25–5.45 (m, 8H), 2.72–2.90 (m, 6H), 2.18–2.29 (t, 2H), 2.00–2.17 (m, 4H); 13C NMR (CDCl3)
δ 176.3, 174.6, 130.8, 129.3, 129.1, 128.9, 128.5, 128.3, 128.0, 127.7, 77.6, 77.4, 77.2, 76.9, 36.2, 31.7, 29.5, 27 .5, 26.7, 25.9, 25.4, 25.2, 22.8, 14.3, 0.23; HRMS calcd. C24H39NO3 (M+H); 390.3003, found; 390.3008 (Δ mass –0.0005).
5.4. N-arachidonoyl-1-aminocyclopropane carboxylic acid; EMA-23 (20:4)
Waxy low melting off white solid. TLC: 10% methanol/methylene chloride; Rf 0.44. 1H NMR (250 MHz CDCl3) d5.95 (s, 1H), 5.25–5.45 (m, 8H), 2.72–2.90 (m, 6H), 1.98–2.32 (m, 6H), 1.66–1.80 (dt, 2H), 1.57–1.65 (m, 2H), 1.25–1.46 (m, 6H), 1.14–1.22 (m, 2H), 0.83–0.96 (t, 3H); 13C NMR (CDCl3) δ 175.1, 130.8, 129.2, 129.1, 128.9, 128.5, 128.4, 128.1, 127.7, 35.9, 31.7, 29.5, 27.5, 26.8, 25.9, 25.8, 25.4, 22.8, 18.2, 14.3. HRMS calcd. C24H37NO3 (M+H); 388.2846, found; 388.2855 (D mass–0.0009).
5.5. N-arachidonoyl-1-aminocyclohexane carboxylic acid; EMA-25 (20:4)
Waxy low melting off-white solid. TLC: 10% methanol/methylene chloride; Rf 0.48. 1H NMR (250 MHz CDCl3) d5.57 (s, 1H), 5.25–5.45 (m, 8H), 2.72–2.90 (m, 6H), 2.23–2.34 (t, 2H), 1.85–2.20 (m, 8H), 1.52–1.80 (m, 6H), 1.20–1.48 (m, 8H), 0.83–0.93 (t, 3H); 13C NMR
(CDCl3)δ 175.4, 175.3, 130.8, 129.4, 128.9, 128.8, 128.6, 128.3, 128.0, 127.7, 77.6, 77.4, 77.2, 76.9, 60.2, 42.2 , 36.2, 32.2, 31.7, 29.5, 27.4, 26.7, 25.9, 25.6, 25.2, 22.8, 21.5, 14.3. HRMS calcd. C27H43NO3 (M+H); 430.3316, found; 430.3320 (Δ mass –0.0004).
5.6. N-steroyl-L-alanine; L-EMA-2 (18:0)
Crystalline, white solid; m.p. 103–105°C. 1H NMR (400 MHz CDCl3) 5.97–5.99 (1H), 4.53–4.58 (1H), 2.22–2.26 (2H), 1.61 (2H), 1.45–1.47 (3H), 1.25–1.30 (29H), 0.86–0.89 (3H); 13C NMR (CDCl3) δ 175.0, 174.5, 48.6, 36.6, 32.2, 29.9, 29.89, 29.83, 29.69, 29.60, 29.53, 29.40, 25.7, 22.9, 17.9, 14.4. HRMS calcd. C21H41NO3 (M+H); 356.3159, found; 356.3187 (Δ mass –0.0028).
5.7. N-palmitoyl methionine; EMA-8 (16:0)
Crystalline white solid; m.p. 75–77°C. 1H NMR (400 MHz CDCl3) 6.34–6.36 (1H), 4.67–4.72 (1H), 2.56–2.60 (2H), 2.11–2.22 (3H), 2.02–2.10 (1H), 1.62–1.65 (2H), 1.25–1.29 (25H), 0.86–0.89 (3H); 13C NMR (CDCl3)
d 174.8, 174.6, 77.6, 77.4, 77.2, 76.9, 52.2, 36.7, 32.2, 31.0, 30.3, 29.94, 29.92, 29.89, 29.86, 29.72, 29.60, 29.5 5, 29.45, 25.8, 22.9, 15.7, 14.4; HRMS calcd. C21H41NO3S (M+H); 388.2880, found; 388.2899 (Δ mass–0.0019).
5.8. Enantiomeric alanine analogs
Chirally pure alanine enantiomers, D-EMA-2 and L-EMA-2, were prepared as previous reported by Cascio et al.48.
5.9. Pharmacological assays
5.9.1 Cell proliferation assay
Cell numbers were estimated using a commercially available kit (Promega). The CellTiter-Glo™ Luminescent Cell Viability Assay kit used here is based on the measurement of ATP, which signals the presence of metabolically active cells 49,50. The assay uses luciferase as the detection enzyme because of the absence of endogenous luciferase activity in mammalian cells. An equal volume of CellTiter-Glo™ Reagent is added to the cell culture and luminescence is measured. The light signal is proportional to the amount of ATP present, which correlates with the number of viable cells present. The Veritas™ Microplate Luminometer used detects as little as 1.5X10⁻¹⁵ moles ATP and values are linear from 760 fg to 5.1 ng of ATP. The supplier’s instructions were followed in our studies reported here.
5.9.2 Measurement of the ratio of iPGJ/iPGE in RAW cell media
48 well plates were seeded with 20,000 RAW cells / 500ul media and incubated for 20 hrs at 37° and 5% CO2. After washing, 500ul of serum free RPMI media was added to each well. Cells were treated with 5ul in DMSO of each of the elmiric acids; final concentrations 1 or 10 uM (N = 3). After 30 minutes, 5ul LPS (1 ug/ml) was added to each well and the incubation continued for 2 hours. Media were then harvested, centrifuged and 50ul from each tube assayed by ELISA with iPGE (Cayman) and iPGJ2 (Assay Design) enzyme immunoassay kits.
5.9.3 The mouse paw edema model
The compounds were dissolved in safflower oil and administered orally to male CD-1 mice that weighed between 35–40 g. After 60 min, 50 ul of the 0.5% arachidonate in pH 8.3 carbonate buffer was injected into the plantar surface of the left (ipsilateral) hind paw of each mouse. The right (contra lateral) paws were injected with 50 ul of the buffer vehicle. This step was done with mice under deep halothane anesthesia. After 2 hours, mice were euthanized with halothane and both hind paws severed at the ankle joint, placed in a tared weighing pan, and the weights recorded. Plots and statistical analyses were done using Prism by GraphPad.
5.9.4. The mouse subcutaneous pouch assay
Subcutaneous pouches were generated in male CD-1 mice (30–35g) by injection of air on two or three successive occasions. Drugs were given orally in safflower oil (50ul) at a dose of 20mg/kg. One hour later inflammation is induced by injection into the pouch cavity of 10 ng rHuIL-1-beta plus 0.25 ng rHuTNF-alpha in 3 ml of 1% carboxymethylcellulose. Inflammation is quantified 90 min. later by determination of pouch exudate leukocyte counts. Alternatively, after 60 min, 2% carrageenan was injected into the pouches. The pouch contents are allowed to incubate for 4 hrs following which the mice were euthanized with halothane and the cells harvested and counted. Plots and statistical analyses were done using Prism by GraphPad. N=4 mice/group. P<0.05 by ANOVA
5.9.5. Mouse ear edema assay
Arachidonic acid induced edema
CD-1 male mice between 34 and 40g were obtained from Charles River and maintained on standard feed and tap water. Treatment was initiated by the application of vehicle (10ul acetone), or drug in 10ul acetone to the ipsi lateral ears and acetone to all contra lateral ears. After 30 min, ear edema was induced by the topical application of 10ul of free arachidonic acid (20mg/ml) to all ipsi lateral ears and 10ul acetone to all contra lateral ears. One hour later, the mice were euthanized with halothane and three replicate ear thickness measurements made using a digital micrometer. Data are expressed as the differences between the ipsi and contra lateral ears in microns.
Phorbol ester induced ear edema
Conditions were as above up until the induction of edema. 30 min after drug treatment 10ul of the PMA (phorbol ester) solution in acetone was applied to all ipsi lateral ears and 10ul of acetone to all of the contra lateral ears. After 4 hrs, all ear thicknesses were measured using a digital micrometer. Compounds with saturated fatty acid groups were only sparingly soluble in acetone in which case dimethylacetamide (DMA) was substituted for acetone.
5.9.6. Animals
The animals were housed in the central facility of the school that is approved and under the supervision of a licensed veterinarian. The experiments were done with regard to all of the regulations of the University Animal Care Committee. The injection of pro inflammatory agents was done with mice under deep halothane anesthesia.
Acknowledgments
This publication was made possible by grants DA17969 (SHB) and DA13691 (RBZ) from National Institute on Drug Abuse, National Institutes of Health, Bethesda, MD. Its contents are solely the responsibility of the author and do not necessarily represent the official views of the National Institute on Drug Abuse. We thank Dr. Akbar Ali for obtaining the NMR spectra of several of the elmiric acids used in this report and James and Barbara Evans for the mass spectral data.
Footnotes
Publisher's Disclaimer: This is a PDF file of an unedited manuscript that has been accepted for publication. As a service to our customers we are providing this early version of the manuscript. The manuscript will undergo copyediting, typesetting, and review of the resulting proof before it is published in its final citable form. Please note that during the production process errors may be discovered which could affect the content, and all legal disclaimers that apply to the journal pertain.
References and notes
- 1.Burstein SH, Rossetti RG, Yagen B, Zurier RB. Prostaglandins Other Lipid Mediat. 2000;61:29. doi: 10.1016/s0090-6980(00)00053-8. [DOI] [PubMed] [Google Scholar]
- 2.Huang SM, Bisogno T, Petros TJ, Chang SY, Zavitsanos PA, Zipkin RE, Sivakumar R, Coop A, Maeda DY, De Petrocellis L, Burstein S, Di Marzo V, Walker JM. J Biol Chem. 2001;276:42639. doi: 10.1074/jbc.M107351200. [DOI] [PubMed] [Google Scholar]
- 3.Burstein SH, Huang SM, Petros TJ, Rossetti RG, Walker JM, Zurier RB. Biochem Pharmacol. 2002;64:1147. doi: 10.1016/s0006-2952(02)01301-1. [DOI] [PubMed] [Google Scholar]
- 4.Batrakov SG, Mosezhnyi AE, Ruzhitsky AO, Sheichenko VI, Nikitin DI. Biochim Biophys Acta. 2000;1484:225. doi: 10.1016/s1388-1981(00)00011-1. [DOI] [PubMed] [Google Scholar]
- 5.Kawai Y, Akagawa K, Yano I. Adv Exp Med Biol. 1990;256:159. doi: 10.1007/978-1-4757-5140-6_13. [DOI] [PubMed] [Google Scholar]
- 6.Kawazoe R, Okuyama H, Reichardt W, Sasaki S. J Bacteriol. 1991;173:5470. doi: 10.1128/jb.173.17.5470-5475.1991. [DOI] [PMC free article] [PubMed] [Google Scholar]
- 7.Lerouge P, Lebas MH, Agapakis-Causse C, Prome JC. Chem Phys Lipids. 1988;49:161. doi: 10.1016/0009-3084(88)90003-5. [DOI] [PubMed] [Google Scholar]
- 8.Miyazaki Y, Oka S, Hara-Hotta H, Yano I. FEMS Immunol Med Microbiol. 1993;6:265. doi: 10.1111/j.1574-695X.1993.tb00338.x. [DOI] [PubMed] [Google Scholar]
- 9.Walker JM, Huang SM, Strangman NM, Tsou K, Sanudo-Pena MC. Proc Natl Acad Sci U S A. 1999;96:12198. doi: 10.1073/pnas.96.21.12198. [DOI] [PMC free article] [PubMed] [Google Scholar]
- 10.Pertwee RG. Prog Neurobiol. 2001;63:569. doi: 10.1016/s0301-0082(00)00031-9. [DOI] [PubMed] [Google Scholar]
- 11.Pertwee RG. Br J Pharmacol. 1972;46:753. doi: 10.1111/j.1476-5381.1972.tb06900.x. [DOI] [PMC free article] [PubMed] [Google Scholar]
- 12.Sheskin T, Hanus L, Slager J, Vogel Z, Mechoulam R. J Med Chem. 1997;40:659. doi: 10.1021/jm960752x. [DOI] [PubMed] [Google Scholar]
- 13.Burstein SH. Pharmacol Ther. 1999;82:87. doi: 10.1016/s0163-7258(98)00069-2. [DOI] [PubMed] [Google Scholar]
- 14.Samuelson LC, Swanberg LJ, Gantz I. Mamm Genome. 1996;7:920. doi: 10.1007/s003359900272. [DOI] [PubMed] [Google Scholar]
- 15.Kohno M, Hasegawa H, Inoue A, Muraoka M, Miyazaki T, Oka K, Yasukawa M. Biochem Biophys Res Commun. 2006;347:827. doi: 10.1016/j.bbrc.2006.06.175. [DOI] [PubMed] [Google Scholar]
- 16.Prusakiewicz JJ, Kingsley PJ, Kozak KR, Marnett LJ. Biochem Biophys Res Commun. 2002;296:612. doi: 10.1016/s0006-291x(02)00915-4. [DOI] [PubMed] [Google Scholar]
- 17.Bradshaw HB, Verfring E, Jahnsen JA, O'Dell, Burstein S, Walker MJ. Identification of novel brain-derived fatty acid amides in extracts of rat brain. ICRS Symposium on Cannabinoids; 2005; Clearwater, FL. [Google Scholar]
- 18.Milman G, Maor Y, Abu-Lafi S, Horowitz M, Gallily R, Batkai S, Mo FM, Offertaler L, Pacher P, Kunos G, Mechoulam R. Proc Natl Acad Sci U S A. 2006;103:2428. doi: 10.1073/pnas.0510676103. [DOI] [PMC free article] [PubMed] [Google Scholar]
- 19.Wiles AL, Pearlman RJ, Rosvall M, Aubrey KR, Vandenberg RJ. J Neurochem. 2006 doi: 10.1111/j.1471-4159.2006.04107.x. [DOI] [PubMed] [Google Scholar]
- 20.Schuligoi R, Grill M, Heinemann A, Peskar BA, Amann R. Biochem Biophys Res Commun. 2005;335:684. doi: 10.1016/j.bbrc.2005.07.130. [DOI] [PubMed] [Google Scholar]
- 21.Gilroy DW, Colville-Nash PR, McMaster S, Sawatzky DA, Willoughby DA, Lawrence T. Faseb J. 2003;17:2269. doi: 10.1096/fj.02-1162fje. [DOI] [PubMed] [Google Scholar]
- 22.Gilroy DW, Colville-Nash PR. J Mol Med. 2000;78:121. doi: 10.1007/s001090000094. [DOI] [PubMed] [Google Scholar]
- 23.Asada K, Sasaki S, Suda T, Chida K, Nakamura H. Am J Respir Crit Care Med. 2004;169:195. doi: 10.1164/rccm.200207-740OC. [DOI] [PubMed] [Google Scholar]
- 24.Hunter SA, Burstein SH. Life Sci. 1997;60:1563. doi: 10.1016/s0024-3205(97)00122-7. [DOI] [PubMed] [Google Scholar]
- 25.Sumariwalla PF, Gallily R, Tchilibon S, Fride E, Mechoulam R, Feldmann M. Arthritis Rheum. 2004;50:985. doi: 10.1002/art.20050. [DOI] [PubMed] [Google Scholar]
- 26.Jeon YJ, Yang KH, Pulaski JT, Kaminski NE. Mol Pharmacol. 1996;50:334. [PubMed] [Google Scholar]
- 27.Nalbant S, Chen LX, Sieck MS, Clayburne G, Schumacher HR. J Rheumatol. 2005;32:1762. [PubMed] [Google Scholar]
- 28.Masferrer JL, Zweifel BS, Manning PT, Hauser SD, Leahy KM, Smith WG, Isakson PC, Seibert K. Proc Natl Acad Sci U S A. 1994;91:3228. doi: 10.1073/pnas.91.8.3228. [DOI] [PMC free article] [PubMed] [Google Scholar]
- 29.Tate GA, Mandell BF, Karmali RA, Laposata M, Baker DG, Schumacher HR, Jr, Zurier RB. Arthritis Rheum. 1988;31:1543. doi: 10.1002/art.1780311211. [DOI] [PubMed] [Google Scholar]
- 30.Sato H, Hashimoto M, Sugio K, Ohuchi K, Tsurufuji S. J Pharmacobiodyn. 1980;3:345. doi: 10.1248/bpb1978.3.345. [DOI] [PubMed] [Google Scholar]
- 31.Hambleton P, Miller P. Br J Exp Pathol. 1989;70:425. [PMC free article] [PubMed] [Google Scholar]
- 32.Calhoun W, Chang J, Carlson RP. Agents Actions. 1987;21:306. doi: 10.1007/BF01966499. [DOI] [PubMed] [Google Scholar]
- 33.Bruno O, Brullo C, Schenone S, Bondavalli F, Ranise A, Tognolini M, Ballabeni V, Barocelli E. Bioorg Med Chem. 2004;12:553. doi: 10.1016/j.bmc.2003.11.018. [DOI] [PubMed] [Google Scholar]
- 34.Khedekar PB, Bahekar RH, Chopade RS, Umathe SN, Rao AR, Bhusari KP. Arzneimittelforschung. 2003;53:640. doi: 10.1055/s-0031-1299806. [DOI] [PubMed] [Google Scholar]
- 35.Njamen D, Talla E, Mbafor JT, Fomum ZT, Kamanyi A, Mbanya JC, Cerda-Nicolas M, Giner RM, Recio MC, Rios JL. Eur J Pharmacol. 2003;468:67. doi: 10.1016/s0014-2999(03)01664-9. [DOI] [PubMed] [Google Scholar]
- 36.Nishikori T, Irie K, Suganuma T, Ozaki M, Yoshioka T. Eur J Pharmacol. 2002;451:327. doi: 10.1016/s0014-2999(02)02238-0. [DOI] [PubMed] [Google Scholar]
- 37.da Cunha FM, Frode TS, Mendes GL, Malheiros A, Cechinel Filho V, Yunes RA, Calixto JB. Life Sci. 2001;70:159. doi: 10.1016/s0024-3205(01)01387-x. [DOI] [PubMed] [Google Scholar]
- 38.Kim K, Jung SY, Lee DK, Jung JK, Park JK, Kim DK, Lee CH. Biochem Pharmacol. 1998;55:975. doi: 10.1016/s0006-2952(97)00613-8. [DOI] [PubMed] [Google Scholar]
- 39.Escrig V, Ubeda A, Ferrandiz ML, Darias J, Sanchez JM, Alcaraz MJ, Paya M. J Pharmacol Exp Ther. 1997;282:123. [PubMed] [Google Scholar]
- 40.Burstein SH, Audette CA, Breuer A, Devane WA, Colodner S, Doyle SA, Mechoulam R. J MedChem. 1992;35:3135. doi: 10.1021/jm00095a007. [DOI] [PubMed] [Google Scholar]
- 41.Gilroy DW, Tomlinson A, Willoughby DA. Inflamm Res. 1998;47:79. doi: 10.1007/s000110050285. [DOI] [PubMed] [Google Scholar]
- 42.Delano DL, Montesinos MC, Desai A, Wilder T, Fernandez P, D'Eustachio P, Wiltshire T, Cronstein BN. Arthritis Rheum. 2005;52:2567. doi: 10.1002/art.21208. [DOI] [PMC free article] [PubMed] [Google Scholar]
- 43.Delano DL, Montesinos MC, D'Eustachio P, Wiltshire T, Cronstein BN. Inflammation. 2005;29:1. doi: 10.1007/s10753-006-8962-6. [DOI] [PubMed] [Google Scholar]
- 44.Crummey A, Harper GP, Boyle EA, Mangan FR. Agents Actions. 1987;20:69. doi: 10.1007/BF01965627. [DOI] [PubMed] [Google Scholar]
- 45.Cuzzocrea S, Wayman NS, Mazzon E, Dugo L, Di Paola R, Serraino I, Britti D, Chatterjee PK, Caputi AP, Thiemermann C. Mol Pharmacol. 2002;61:997. doi: 10.1124/mol.61.5.997. [DOI] [PubMed] [Google Scholar]
- 46.Zurier RB. J Cell Biochem. 2003;88:462. doi: 10.1002/jcb.10291. [DOI] [PubMed] [Google Scholar]
- 47.Willoughby DA, Moore AR, Colville-Nash PR, Gilroy D. Int J Immunopharmacol. 2000;22:1131. doi: 10.1016/s0192-0561(00)00064-3. [DOI] [PubMed] [Google Scholar]
- 48.Cascio M, Minassi A, Ligresti A, Appendino G, Burstein S, Di Marzo V. Biochem Biophys Res Commun. 2004;314:192. doi: 10.1016/j.bbrc.2003.12.075. [DOI] [PubMed] [Google Scholar]
- 49.Bradbury DA, Simmons TD, Slater KJ, Crouch SP. J Immunol Methods. 2000;240:79. doi: 10.1016/s0022-1759(00)00178-2. [DOI] [PubMed] [Google Scholar]
- 50.Crouch SP, Kozlowski R, Slater KJ, Fletcher J. J Immunol Methods. 1993;160:81. doi: 10.1016/0022-1759(93)90011-u. [DOI] [PubMed] [Google Scholar]