Abstract
Combination of high-resolution atomic force microscope topography imaging with single molecule force spectroscopy provides a unique possibility for the detection of specific molecular recognition events. The identification and localization of specific receptor binding sites on complex heterogeneous biosurfaces such as cells and membranes are of particular interest in this context. Here simultaneous topography and recognition imaging (TREC) was applied to gently fixed microvascular endothelial cells from mouse myocardium (MyEnd) to identify binding sites of vascular endothelial (VE)-cadherin, known to play a crucial role in calcium-dependent, homophilic cell-to-cell adhesion. TREC images were acquired with magnetically oscillating atomic-force microscope tips functionalized with a recombinant VE-cadherin-Fc cis-dimer. The recognition images revealed single molecular binding sites and prominent, irregularly shaped dark spots (domains) with sizes ranging from 10 to 100 nm. These domains arose from a decrease of the oscillation amplitude during specific binding between active VE-cadherin cis-dimers. The VE-cadherin clusters were subsequently assigned to topography features. TREC represents an exquisite method to quickly obtain the local distribution of receptors on cellular surface with an unprecedented lateral resolution of 5 nm.
Real-time visualization and quantification of receptor binding sites on cell surfaces is a fundamental challenging task in molecular cell biology. This can be achieved by common techniques such as immunostaining (or immunocytochemistry) or by sophisticated optical techniques such as STED microscopy (1), NSOM (2,3), or single molecule optical microscopy (4,5). The lateral resolution in these studies ranged from a few tens of nanometers (1–5) to ∼200 nm. However, in optical studies, no information about topography is attainable. At present, atomic force microscopy (AFM), which represents a nonoptical microscopy, offers a unique solution to obtain topography images with nanoscale resolution and single molecule interaction forces of biological specimens (e.g., proteins, DNA, membranes, cells, etc.) under/or near physiological conditions and without the need for rigorous sample preparation or labeling (6). Thus, spatial mapping of molecular recognition sites can be obtained by performing AFM adhesion force mapping using the force-volume technique (7,8). With the recent development of simultaneous Topography and RECognition (TREC) technique, it becomes possible to quickly and easily obtain maps of binding sites with the lateral accuracy of several nm across a variety of surfaces, as demonstrated on model receptor-ligand pairs (9–11) and remodeled chromatin structures (12). This dynamic recognition mapping is faster and offers better lateral resolution than adhesion force mapping (8). Because cells represent systems of more complex composition, organization, and processing in space and time than proteins, the next goal is the application of TREC to eukaryotic cell membranes containing functional domains enriched in (glycol) sphingolipids, cholesterol, and specific transmembrane proteins (13).
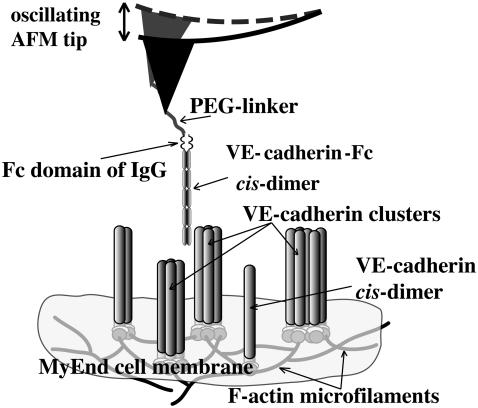
In this letter, TREC has been exploited to locally identify vascular endothelial (VE)-cadherin binding sites on MyEnd cells (5) and to colocalize their position with membrane topographical features. VE-cadherin belongs to the wide-spread family of cadherins, transmembrane glycoproteins, which are known to be crucial for calcium-dependent homophilic cell-to-cell adhesion (14). VE-cadherin is located at intercellular junctions of essentially all types of endothelium where VE-cadherin molecules are clustered (5) and linked through their cytoplasmic domain to the actin cytoskeleton (Fig. 1). The cadherin cis-dimer (Fig. 1), which is formed by association of two extracellular domains in physiological Ca2+-concentration (∼1.8 mM), represents a basic structural functional unit to promote a homophilic bond between cells.
FIGURE 1.
Scheme of dynamic recognition imaging to visualize VE-cadherin binding sites (here single cis-dimers and/or clusters) on a gently fixed MyEnd cell surface.
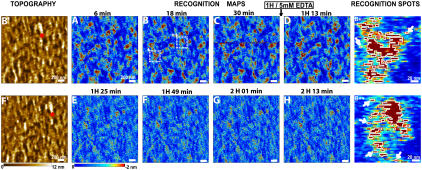
For all AFM studies, MyEnd cells were seeded onto gelatin-coated slides, grown as described (5). To avoid lateral diffusion of VE-cadherin (5) and increase the stability of the cell membrane, cells were gently fixed with glutaraldehyde by addition into the medium (final glutaraldehyde concentration was 0.5%) for 1–2 h at 37°C. Such fixation procedure is not only suitable to prevent the lateral mobility of receptors on the cell surface but also maintains the cell volume and mostly preserves the filamentous structure on the cell cortex. TREC images were acquired in the magnetic AC mode using a PicoPlus AFM (Molecular Imaging, Tempe, AZ) with magnetically coated AFM tips (magnetic AC tips) that were functionalized with a recombinant VE-cadherin-Fc cis-dimer (4) via a soft and long (∼8 nm) polyethylene glycol (PEG)-linker (Fig. 1) (15). All images (512 × 512 pixels) were taken in Hank's balanced salt solution (1.8 mM Ca2+) at 25°C with the same experimental conditions as for protein systems (10,11) (e.g., cantilever spring constant 0.1 N/m, Q-factor ∼1, resonance frequency ∼7 kHz, scanning speed ∼3 μm/s, and feedback loop coupled to the minima of the oscillations). The oscillation amplitude was adjusted to be less than the extended PEG-linker to provide the proper recognition image with high efficiencies and repeatability (>90%) (Fig. 2) (12). Accordingly, the recognition map represents an amplitude reduction due to a physical connection between VE-cadherin on the tip and VE-cadherin molecules on the cell surface when specific trans-interaction occurs (dark spots in Fig. 2, A–D). These dark spots (amplitude reduction up to 2 nm) are distributed nonuniformly and reflect microdomains with dimensions from ∼10 to ∼100 nm. The recognition efficiency is generally high and remains so on subsequent rescans (Fig. 2, A–D). Ca2+-free conditions result in the disappearance of almost all binding events in the recognition image (Fig. 2, E–H), whereas no change in the topography image has been observed (Fig. 2 F′). A closer look at some recognition spots (Fig. 2, B+ and B++) reveals that they consist of one-to-two large domains (50–80 nm, spots bordered by white line) surrounded by smaller domains (10–20 nm) or even single molecule spots (typically 1–4 pixels long, 1 pixel = 4 nm; see arrows in Fig. 2, B+ and B++). The dimensions of the single sites exactly meet the expectation, taking into account the size of the cis-dimer (diameter ∼3 nm) and the free orientation of PEG-linker leading to specific binding even before/after (∼8 nm) the binding site position (9). Greater than 600 single events were identified and ∼6000 active cis-dimers were estimated in the scanned area (4 μm2).
FIGURE 2.
Recognition images of a MyEnd cell surface obtained with VE-cadherin-Fc-functionalized tip. (A–C) During 1 h of scanning recognition maps of VE-cadherin domains remain unchanged. Then, 5 mM EDTA was very slowly (∼50 μl/min) injected in the fluid cell while scanning the sample. The first scan (D) did not reveal immediate changes in the recognition map. The recognition clusters disappeared as the active VE-cadherin-Fc cis-dimers on the AFM tip dissociated in inactive monomers, thereby abolishing specific VE-cadherin trans-interaction (E–H). Note that in Ca2+-rich conditions the previously blocked tip regains its functionality. (B′,F′) Topography images simultaneously recorded with B and F, respectively. After blocking experiments, topography (F′) remains unchanged—indicating that blocking does not affect membrane topography (compare B′ and F′). Red stars in B′ and F′ indicate the AFM scanner lateral drift of ∼5 nm/min. (B+, B++) Examples of recognition spots magnified from B (areas + and ++, respectively). Recognition areas are depicted by threshold analysis (threshold = −1.7 nm) and bordered by white lines. Single VE-cadherin cis-dimers can be clearly detected (arrows).
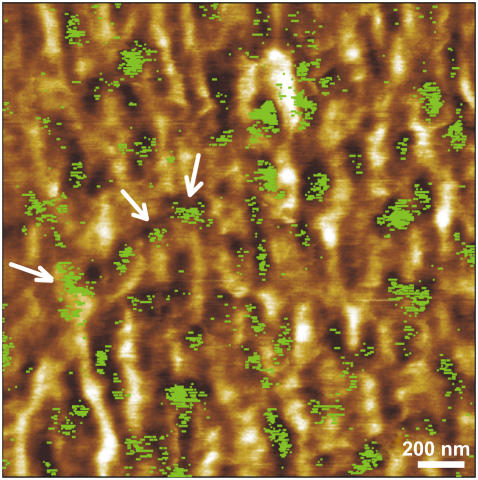
Recognition spots observed in the model protein systems (9–11) closely coincided with the locations of proteins in a topography image with several nm precision. Binding sites were also properly assigned to topographical features of heterogeneous samples such as chromatin (12). The first application for cells is given in Fig. 3, representing the overlay of the recognition spots (in green) on the topographical image. Here we correlated the shapes and the positions of VE-cadherins with topographical features of MyEnd cell surfaces. This procedure allows revealing the locations of receptors in the topographical image with high lateral resolution (several nm) and high efficiency. The topography of a scanned cell surface area (Fig. 3) shows a complex picture of linear and branched filamentous structures, likely representing filaments of the peripheral actin belt and some globular features as well. A few VE-cadherin domains are found directly on top of filaments (arrows). Nevertheless, most domains are located near and between filaments, indicating that at this stage of cell maturation (day 1 or 2 after seeding), clustering of VE-cadherin is incomplete.
FIGURE 3.
Superimposition of recognition map of VE-cadherin domains (in green) onto the corresponding topography image. Color scale (dark brown to white) is 0–12 nm.
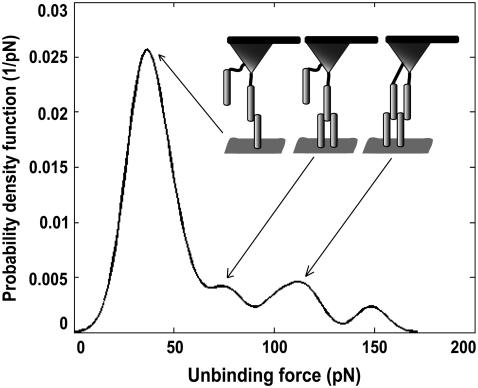
Additionally, force spectroscopy curves were accumulated (n = 500, loading rate of ∼800 nm/s, encounter duration of 100 ms) before and after blocking experiment at the same scan area with the same VE-cadherin-Fc tip (Fig. 4). The force distribution of cadherin-cadherin dissociation illustrates multiple force peaks of one-, two-, and threefold binding with a force quantum of 40 pN. This characteristic force fingerprint is similar to an isolated VE-cadherin system (16). The unbinding events were abolished by addition of 5 mM EDTA (reduction of binding probability from ∼30% to ∼1%). Thus, the force spectroscopy data unequivocally proof that the specific domains contain active VE-cadherin cis-dimers.
FIGURE 4.
Force distribution recorded on gently fixed MyEnd surface with VE-cadherin-Fc-coated tip in Ca2+-rich conditions.
The present work shows a major advantage of TREC over optical approaches to cells (1–4) with a spatial topographical and recognition resolution of ∼5 nm. Dynamic recognition imaging allows to detect single molecular interactions, and thus to visualize, identify, and quantify local receptor binding sites and assign their locations to the topographical features of cell surfaces. TREC shows a high potential to be successfully used for many adherent cells or extracted cellular membranes to locally identify receptor binding sites.
Acknowledgments
The authors thank Wassili Pastushenko for the assistance in figure preparation and Werner Baumgartner for preliminary discussions.
This work was supported by European Commission contract No. LSHG-CT-2005-512101.
Editor: Barry R. Lentz.
References
- 1.Willing, K. I., S. O. Rizzoli, V. Westphal, R. Jahn, and S. W. Hell. 2006. STED microscopy reveals that synaptotagmin remains clustered after synaptic vesicle exocytosis. Nature. 440:935–939. [DOI] [PubMed] [Google Scholar]
- 2.Koopman, M., A. Cambi, B. I. de Bakker, B. Joosten, C. G. Figdor, N. F. van Hulst, and M. F. Garcia-Parajo. 2004. Near-field scanning optical microscopy in liquid for high resolution single molecule detection on dendritic cells. FEBS Lett. 573:6–10. [DOI] [PubMed] [Google Scholar]
- 3.Ianoul, A., M. Street, D. Grant, J. Pezacki, R. S. Taylor, and L. J. Johnston. 2004. Near-field scanning fluorescence microscopy study of ion channel clusters in cardiac myocyte membranes. Biophys. J. 87:3525–3535. [DOI] [PMC free article] [PubMed] [Google Scholar]
- 4.Schmidt, Th., G. J. Schütz, W. Baumgartner, H. J. Gruber, and H. Schindler. 1996. Imaging of single molecule diffusion. Proc. Natl. Acad. Sci. USA. 93:2926–2929. [DOI] [PMC free article] [PubMed] [Google Scholar]
- 5.Baumgartner, W., G. J. Schütz, J. Wiegand, N. Golenhofen, and D. Drenckhahn. 2003. Cadherin function probed by laser tweezer and single molecule fluorescence in vascular endothelial cells. J. Cell Sci. 116:1001–1011. [DOI] [PubMed] [Google Scholar]
- 6.Hörber, J. K. H., and M. J. Miles. 2003. Scanning probe evolution in biology. Science. 302:1002–1005. [DOI] [PubMed] [Google Scholar]
- 7.Grandbois, M., W. Dettmann, M. Benoit, and H. E. Gaub. 2000. Affinity imaging of red blood cells using an atomic force microscope. J. Histochem. Cytochem. 48:719–724. [DOI] [PubMed] [Google Scholar]
- 8.Hinterdorfer, P., and Y. F. Dufrêne. 2006. Detection and localization of single molecular recognition events using atomic force microscopy. Nat. Methods. 3:347–355. [DOI] [PubMed] [Google Scholar]
- 9.Raab, A., W. Han, D. Badt, S. J. Smith-Gill, S. M. Lindsay, H. Schindler, and P. Hinterdorfer. 1999. Antibody recognition imaging by force microscopy. Nat. Biotechnol. 17:902–905. [DOI] [PubMed] [Google Scholar]
- 10.Stroh, C. M., A. Ebner, M. Geretschläger, G. Freudenthaler, F. Kienberger, A. S. M. Kamruzzahan, S. J. Smith-Gill, H. J. Gruber, and P. Hinterdorfer. 2004. Simultaneous topography and recognition imaging using force microscopy. Biophys. J. 87:1981–1990. [DOI] [PMC free article] [PubMed] [Google Scholar]
- 11.Ebner, A., F. Kienberger, G. Kada, C. M. Stroh, M. Geretschläger, A. S. M. Kamruzzahan, L. Wildling, W. T. Johnson, B. Ashcroft, J. Nelson, S. M. Lindsay, H. J. Gruber, and P. Hinterdorfer. 2005. Localization of single avidin-biotin interactions using simultaneous topography and molecular recognition imaging. ChemPhysChem. 6:897–900. [DOI] [PubMed] [Google Scholar]
- 12.Stroh, C., H. Wang, R. Bash, B. Ashcroft, J. Nelson, H. Gruber, D. Lohr, S. M. Lindsay, and P. Hinterdorfer. 2004. Single-molecule recognition imaging microscopy. Proc. Natl. Acad. Sci. USA. 101:12503–12507. [DOI] [PMC free article] [PubMed] [Google Scholar]
- 13.Simons, K., and E. Ikonen. 1997. Functional rafts in cell membranes. Nature. 387:569–572. [DOI] [PubMed] [Google Scholar]
- 14.Vincent, P. A., K. Xiao, K. M. Buckley, and A. P. Kowalczyk. 2004. VE-cadherin: adhesion at arm's length. Am. J. Physiol. Cell Physiol. 286:C987–C997. [DOI] [PubMed] [Google Scholar]
- 15.Bonanni, B., A. S. M. Kamruzzahan, A. R. Bizzarri, C. Rankl, H. J. Gruber, P. Hinterdorfer, and S. Cannistraro. 2005. Single molecule recognition between cytochrome c 551 and gold-immobilized azurin by force spectroscopy. Biophys. J. 89:1177–1184. [DOI] [PMC free article] [PubMed] [Google Scholar]
- 16.Baumgartner, W., P. Hinterdorfer, W. Ness, A. Raab, D. Vestweber, H. Schindler, and D. Drenckhahn. 2000. Cadherin interaction probed by atomic force microscopy. Proc. Natl. Acad. Sci. USA. 97:4005–4010. [DOI] [PMC free article] [PubMed] [Google Scholar]


