Abstract
Conformational energy maps of the glycosidic linkages are a valuable resource to gain information about preferred conformations and flexibility of carbohydrates. Here we present GlycoMapsDB, a new database containing more than 2500 calculated conformational maps for a variety of di- to pentasaccharide fragments contained in N- and O-glycans. Oligosaccharides representing branchpoints of N-glycans are included in the set of fragments, thus the influence of neighbouring residues is reflected in the conformational maps. During refinement of new crystal structures, maps contained in GlycoMapsDB can serve as a valuable resource to check whether the torsion values of a glycosidic linkage are located in an ‘allowed’ region similar to the Ramachandran plot analysis for proteins. This might help to improve the structural quality of the glycan data contained in the Protein Data Bank (PDB). A link between GlycoMapsDB and the PDB has been established so that the glycosidic torsions of all glycans contained in the PDB can be retrieved and compared to calculated data. The service is available at www.glycosciences.de/modeling/glycomapsdb/.
INTRODUCTION
Ramachandran plots (1) of protein backbone torsions φ/ψ are frequently used to validate 3D structures of proteins (2,3). The quality of a protein structure is considered to be ‘good’ when (preferably all) amino acids have φ/ψ values located in ‘allowed’ regions of the plot. For carbohydrates the glycosidic torsions φ/ψ (ω) are the main determinants of the 3D structure and it is straightforward to validate the quality of an experimentally determined carbohydrate structure in a similar way to protein structures. In contrast to proteins, however, the ‘allowed’ regions on a conformational map for a given glycosidic linkage not only depend on the linked monosaccharide types, but also on the linkage type and—a feature completely different from proteins—the degree of branching of the glycan. The number of available high quality crystal structures of carbohydrates is too limited to serve as a basis to determine the ‘allowed’ regions for all linkage types so the accessible conformational space of carbohydrate linkages has therefore to be estimated using computational methods. Consequently, over the last 30 years a considerable effort has been put into the development of force fields that are able to predict accurately the local minima and flexibility of glycosidic torsions (4). The force field most frequently used to calculate conformational maps of glycosidic linkages is MM3 (5).
CALCULATION OF CONFORMATIONAL MAPS
A variety of methods exist to calculate the energy of a carbohydrate as a function of the glycosidic torsions φ/ψ (or φ/ψ/ω for 1–6 linkages). Traditionally systematic search methods are applied to disaccharides (6). A ‘relaxed’ map is obtained by systematically changing φ and ψ in small intervals (normally 10°) and minimizing all degrees of freedom while restraining φ/ψ using an external force. Relaxed conformational maps depend on the orientation of the exocyclic torsions in the starting conformation of the carbohydrate and therefore the calculation of an ‘adiabatic’ map is advisable. To generate a fully adiabatic map the calculation of 310 relaxed maps would be required for a simple disaccharide (7). In routine calculations the computational cost is reduced by taking into account only gg and gt (or gt and tg for monosaccharides that have the OH4 group in an axial orientation) conformations for the hydroxymethyl groups and a clock- and anticlockwise orientation for the hydroxyl groups. This reduces the number of relaxed maps to be calculated to eight resulting in a total of 10 368 conformations to minimize for each ‘pseudo’ adiabatic map. It is obvious that this approach is limited to disaccharides since the number of conformations to be minimized for a trisaccharide would already be ∼3 × 10⁶ (assuming the second linkage is searched in intervals of 30°), far too many for a large-scale project where thousands of maps need to be calculated.
High temperature molecular dynamics simulation is a robust and efficient method to explore the accessible conformational space of carbohydrates (8). Conformational free energy maps can be derived from population analysis by applying the Boltzmann equation. This approach has several advantages compared to the systematic search methods:
it is directly applicable to branched oligosaccharides, so that the same method can be used for disaccharides and larger oligosaccharides,
the low energy conformational space only is explored and no computational time is wasted to calculate unrealistic high energy conformations,
the required computational cost increases therefore only moderately with the number of atoms of the oligosaccharide,
the data-flow can be easily optimised in such a way that the conformational maps are generated automatically and only minimal human interaction is required.
It was therefore decided that free energy maps derived from MD simulations were a good first set of conformational maps with which to populate the GlycoMaps database. An in-house library of carbohydrate fragments (up to pentasaccharides) derived from structures described in the CARBBANK (9) and built using the SWEET-II program (10) served as input. The MM3 force field as implemented in the TINKER suite (dasher.wustl.edu/tinker/) [for a comparision with the original MM3 implementation see (11)] was used to calculate the trajectories at 1000 K. The length of the MD simulation was 10 ns for disaccharides and 30 ns for larger oligosaccharides. The carbohydrate rings were restrained to a chair conformation. The Conformational Analysis Tools (CAT) software (www.md-simulations.de/CAT/) was used for data processing and analysis.
ACCESSING AND ANALYSING CONFORMATIONAL MAPS
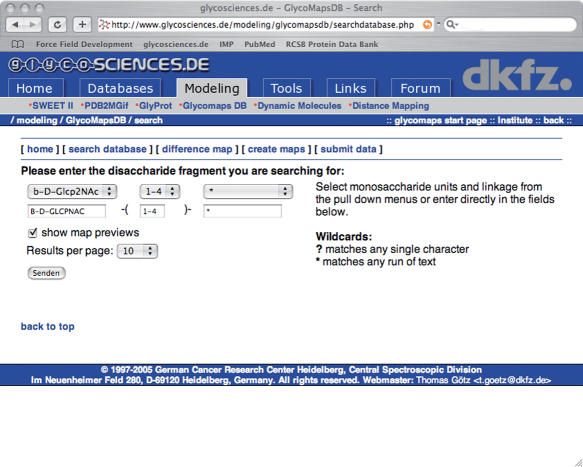
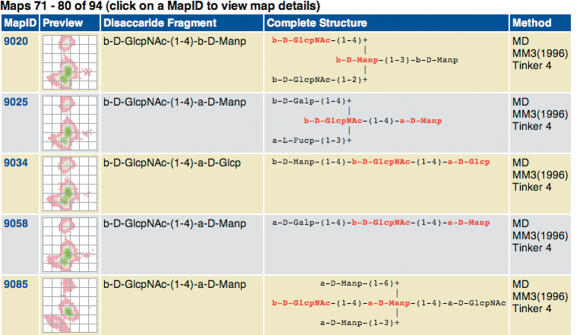
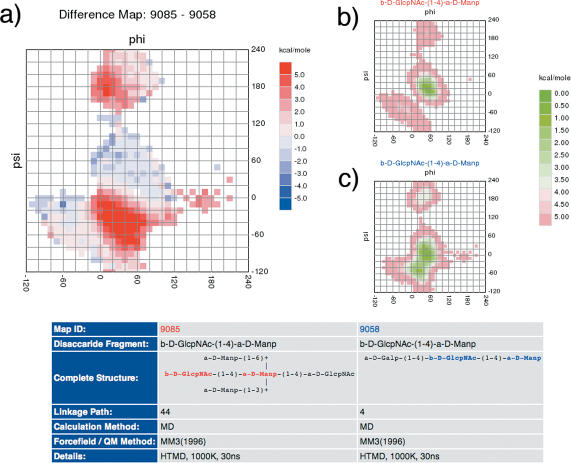
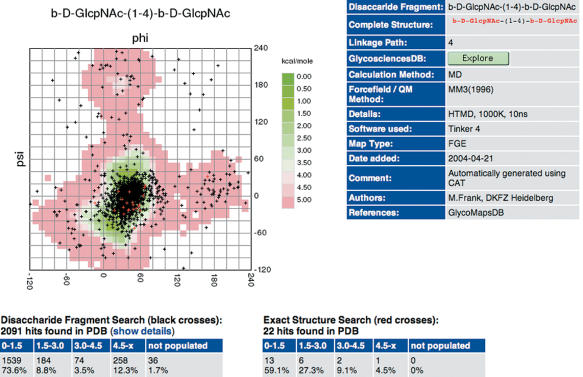
Conformational maps of carbohydrate linkages can be retrieved from the database by entering the disaccharide fragment in IUPAC form into the search database web interface of GlycoMapsDB (Figure 1). Wildcards are supported, which allows searching, e.g. Glcp and Glcp2NAc residues simultaneously. Maps found in the database are displayed as a list, with each entry showing a preview picture and the full structure of the carbohydrate for which the map has been calculated in extended IUPAC form (Figure 2). Difference maps can be calculated e.g. to evaluate the influence of branching on the accessible conformational space of a linkage (Figure 3). Individual maps can be explored in more detail by clicking on the preview picture. A 3D structure of the carbohydrate—generated by Sweet II (10)—can be displayed using JMol (jmol.sourceforge.net). If experimental data for the disaccharide fragment is available in the Protein Data Bank (PDB) (12), a link is displayed, which leads to a page where φ/ψ torsion values retrieved from PDB data [using the GlyTorsion tool (13)] are overlaid onto the calculated conformational map (Figure 4). Some statistical data regarding the fit of the experimental data to the calculated data is also displayed. The PDB structures evaluated can be accessed following the ‘show details’ link. If further information such as literature references or NMR data for the carbohydrate is available in GlycosciencesDB (14) a link to the corresponding entry in that database is displayed.
Figure 1.
The search database interface of the GlycoMapsDB. Monosaccharide residues can be selected from the pull down menus or entered directly into the appropriate fields. Wildcards are supported.
Figure 2.
Example of a search result. The complete carbohydrate structure used for the calculation of the conformational map is displayed in IUPAC extended nomenclature. The disaccharide fragment that defines the glycosidic linkage is highlighted. The method used to calculate the maps is shown as well as a preview picture of the map that serves as an active link to a more detailed display of the database entry.
Figure 3.
Difference maps can be calculated to compare conformational maps. In the example shown the conformational maps of the disaccharide fragment β-D-GlcpNAc-(1-4)-α-D-Manp either as part of a highly branched oligosaccharide (b) or as part of a linear chain (c) are compared. The reduction of accessible conformational space caused by neighbouring residues in the branched oligosaccharide can clearly be seen in the difference map (a, deep red areas represent regions where the neighbouring residue causes a strong energy penalty mainly by steric conflicts).
Figure 4.
Comparison of calculated conformational maps with glycosidic torsion values derived from the PDB using the GlyTorsion tool (13). The PDB database entries can be explored using the ‘show details’ link. If available, literature references and NMR data for the carbohydrate can be retrieved from GlycosciencesDB.
IMPLEMENTATION
GlycoMapsDB is running on a Linux PC with Apache web server software. Interaction with the user is mediated through PHP interfaces. The datasets are stored in a mySQL database. Visualization of carbohydrate structures is performed using the java applet Jmol or the plugin Chime (www.mdlchime.com). Diagrams and plots are generated in scalable vector graphics (SVG) format. For browsers that cannot display SVG files, they are converted to graphics interchange format (GIF) files using ImageMagick. The service is hosted at and maintained by the German Cancer Research Centre in Heidelberg, Germany. The database can be accessed online at www.glycosciences.de/modeling/glycomapsdb/.
DISCUSSION AND OUTLOOK
Currently, the GlycoMapsDB contains ∼2500 conformational maps of carbohydrate fragments originally described in the CARBBANK. Conformational maps for most fragments found in glycoproteins are available in the database. The direct crosslink between calculated maps and PDB data opens a very efficient route to crosscheck the quality of experimental structures as well as the quality of the maps. In general the amount of available high quality experimental data currently available for carbohydrates in the PDB database is rather limited compared to that for proteins and for some linkages there is no experimental data available at all, so there is a clear lack of experimental reference data. In this respect, the conformational maps contained in GlycoMapsDB might help crystallographers to crosscheck their data before submission similar to the Ramachandran plot analysis for proteins. For this purpose, maps from the GlycoMapsDB are also accessed by the carp (Carbohydrate Ramachandran Plot) software (13), where users can upload a structure in PDB file format and retrieve plots comparing the torsions present in the structure with the conformational maps.
GlycoMapsDB indirectly offers an interface for ‘data mining’ in the PDB database, e.g. to find carbohydrate entries with unusual glycosidic torsion values. For β-d-GlcpNAc-(1-4)-β-d-GlcpNAc, a frequent fragment contained in N-glycans, the agreement between experimental and calculated data is remarkably good (Figure 4). More than 80% of the crystal structures have values in low energy areas of the conformational map. But there are also some outliers that are located in ‘not allowed’ areas of the maps. Of special interest are also those structures that have φ or ψ values of ∼180° (anti conformation). The ‘show details’ link would help to find the corresponding entries in the PDB.
In the near future we will provide also conformational maps calculated with force fields other than MM3, so that the influence of different parameter sets can be investigated. An upload feature for maps will be added so that users can upload and compare their own calculated maps with the maps stored in the database. In addition, a functionality that will allow users to calculate maps not already contained in the database is planned.
Acknowledgments
The development of GlycMapsDB as part of the GLYCOSCIENCES.de portal at the DKFZ was supported by a Research Grant from the German Research Foundation (DFG BIB 46 HDdkz 01-01) within the digital library program as well as the president fond of the Helmholtz society. Funding to pay the Open Access publication charges for this article was provided by the DKFZ.
Conflict of interest statement. None declared.
REFERENCES
- 1.Ramachandran G.N., Ramakrishnan C., Sasisekharan V. Aspects of Protein Structure. New York: Academic Press; 1963. p. 121. [Google Scholar]
- 2.Laskowski R.A., MacArthur M.W., Thornton J.M. Validation of protein models derived from experiment. Curr. Opin. Struct. Biol. 1998;8:631–639. doi: 10.1016/s0959-440x(98)80156-5. [DOI] [PubMed] [Google Scholar]
- 3.Abola E.E., Bairoch A., Barker W.C., Beck S., Benson D.A., Berman H., Cameron G., Cantor C., Doubet S., Hubbard T.J.P., et al. Quality control in databanks for molecular biology. Bioessays. 2000;22:1024–1034. doi: 10.1002/1521-1878(200011)22:11<1024::AID-BIES9>3.0.CO;2-W. [DOI] [PubMed] [Google Scholar]
- 4.Mackerell A.D., Jr Empirical force fields for biological macromolecules: overview and issues. J. Comput. Chem. 2004;25:1584–1604. doi: 10.1002/jcc.20082. [DOI] [PubMed] [Google Scholar]
- 5.Allinger N.L., Rahman M., Lii J.H. A molecular mechanics force-field (Mm3) for alcohols and ethers. J. Am. Chem. Soc. 1990;112:8293–8307. [Google Scholar]
- 6.French A.D. Comparisons of rigid and relaxed conformational maps for cellobiose and maltose. Carbohydrate Res. 1989;188:206–211. [Google Scholar]
- 7.Stortz C.A. Disaccharide conformational maps: how adiabatic is an adiabatic map? Carbohydrate Res. 1999;322:77–86. doi: 10.1016/s0008-6215(99)00207-4. [DOI] [PubMed] [Google Scholar]
- 8.Frank M., Bohne-Lang A., Wetter T., Lieth C.W. Rapid generation of a representative ensemble of N-glycan conformations. In Silico Biol. 2002;2:427–439. [PubMed] [Google Scholar]
- 9.Doubet S., Bock K., Smith D., Darvill A., Albersheim P. The complex carbohydrate structure database. Trends Biochem. Sci. 1989;14:475–477. doi: 10.1016/0968-0004(89)90175-8. [DOI] [PubMed] [Google Scholar]
- 10.Bohne A., Lang E., von der Lieth C.W. SWEET—WWW-based rapid 3D construction of oligo- and polysaccharides. Bioinformatics. 1999;15:767–768. doi: 10.1093/bioinformatics/15.9.767. [DOI] [PubMed] [Google Scholar]
- 11.Stortz C.A. Comparative performance of MM3(92) and two TINKER MM3 versions for the modeling of carbohydrates. J. Comput. Chem. 2005;26:471–483. doi: 10.1002/jcc.20185. [DOI] [PubMed] [Google Scholar]
- 12.Berman H.M., Westbrook J., Feng Z., Gilliland G., Bhat T.N., Weissig H., Shindyalov I.N., Bourne P.E. The Protein Data Bank. Nucleic Acids Res. 2000;28:235–242. doi: 10.1093/nar/28.1.235. [DOI] [PMC free article] [PubMed] [Google Scholar]
- 13.Lutteke T., Frank M., von der Lieth C. Carbohydrate Structure Suite (CSS): analysis of carbohydrate 3D structures derived from the PBD. Nucleic Acids Res. 2005;33:D242–D246. doi: 10.1093/nar/gki013. [DOI] [PMC free article] [PubMed] [Google Scholar]
- 14.Lutteke T., Bohne-Lang A., Loss A., Goetz T., Frank M., von der Lieth C.W. GLYCOSCIENCES.de: an Internet portal to support glycomics and glycobiology research. Glycobiology. 2006;16:71R–81R. doi: 10.1093/glycob/cwj049. [DOI] [PubMed] [Google Scholar]


