

Abstract
In addition to allowing identification of putative functional elements as regions having reduced substitution rates, comparison of genome sequences can also provide insights into these elements at the nucleotide level, by indicating the pattern of tolerated substitutions. We created data sets of orthologous alternative and constitutive splice sites in mouse, rat, and human and analyzed the substitutions occurring within them. Our results illuminate differences between alternative and constitutive sites and, in particular, strongly support the idea that alternative sites are under selection to be weak.
Sequence signals in alternatively spliced genes allow the splicing to be regulated in a tissue and cell-type specific manner (Smith and Valcarcel 2000). The “splice site” sequences (those interacting primarily with the spliceosome) and nearby splicing enhancers and silencers recognized primarily by other protein factors are all thought to play important roles in this regulation. Experimental studies of particular cases have shown that alternative splice sites tend to be weak and to depend on exonic and intronic splicing enhancers for their recognition (Inoue et al. 1992; Lavigueur et al. 1993; Caputi et al. 1994; Dye et al. 1998; D’Souza and Schellenberg 2002). Computational studies support the experimental findings on a genome-wide scale: on average, alternative splice sites are lower-scoring than constitutive sites (Stamm et al. 1994, 2000; Clark and Thanaraj 2002; Zavolan et al. 2003; Baek and Green 2005; Zheng et al. 2005) and are accompanied by higher sequence conservation in the flanking intronic and exonic sequences, presumably reflecting purifying selection on regulatory motifs (Sorek and Ast 2003; Sugnet et al. 2004; Baek and Green 2005; Yeo et al. 2005).
Two plausible hypotheses could explain the lower scores in alternative sites. One is that the lower scores are a consequence of selection to keep the sites weaker, perhaps because strong sites are less easily regulated. It has been shown experimentally in several cases that optimization of weak alternative splice sites results in loss of effective regulation by enhancers and silencers (Dirksen et al. 1995; Muro et al. 1998; Zheng et al. 2000). A naturally occurring mutation causing frontotemporal dementia has been linked to strengthening of a weak alternative site (Neumann et al. 2005); the mutation (G → A at donor-site position +3 in the MAPT gene, previously known as tau) increased exon inclusion by destabilizing secondary structure and/or by strengthening pairing with U1 RNA. However, it is unknown whether the results in these particular cases are typical of alternatively spliced genes in general, and a second possible hypothesis is that the lower scores are simply a passive consequence of the presence of intronic and exonic splicing enhancers to assist splicing, which may remove the need for strong sites and allow score-lowering mutations to accumulate in a neutral fashion. The first hypothesis predicts that selection should act to eliminate mutations that increase the strength of the splice site, while the second predicts that selection on site strength may be relatively weak.
Carmel et al. (2004) introduced a comparative genomics approach to analyze mammalian splice donor sites; they detected in particular a compensatory association between exonic and intronic positions in the donor site, confirming the importance of base pairing between U1 snRNA and exonic positions. Because they considered only a pair of species, they could not determine substitution polarity, which is required for more detailed assessment of the mutational changes that have been permitted in evolution. Here we develop a comparative genomics approach to investigate, on evolutionary and genome-wide scales, differences between alternative and constitutive splice sites, exploring in particular the significance of weak splice sites in alternative splicing. Our analyses of substitution patterns within orthologous human–mouse–rat splice sites strongly favor the first hypothesis and provide the first genome-wide support for the idea that regulated alternative splicing requires weak splice sites.
Results and Discussion
Alternative splice sites are low scoring compared to constitutive splice sites from the same transcript
We first used genomic alignments of ESTs and cDNAs to identify alternative and constitutive splicing cases conserved between human and mouse (Methods and Supplemental Table 1). In preliminary analyses (data not shown), we found that alternatively and nonalternatively spliced genes tend to differ in such characteristics as average G + C content, expression level, and tissue of expression. As these characteristics are potentially correlated with mutation rates and strength of selection, it is important to control for gene-to-gene variation when comparing sequence features of alternative and constitutive splice sites. Consequently we constructed a data set of paired sites, each pair consisting of a conserved alternative splice site and a (randomly chosen) conserved constitutive splice site of the same type (donor or acceptor) from the same transcript; we obtained 3077 donor-site pairs, and 4268 acceptor-site pairs. Subsequent analyses are based on these paired sites.
Comparison of log-odds scores (Table 1) shows that alternative sites are on average lower scoring than constitutive sites from the same transcript. This confirms previous analyses (Stamm et al. 1994, 2000; Zavolan et al. 2003; Baek and Green 2005; Zheng et al. 2005) which did not control for gene-to-gene variation and shows additionally that the trends hold for evolutionarily conserved alternative splicing, which is more likely to be functionally significant (Resch et al. 2004; Sorek et al. 2004). We use here splice-site scores based on a method that takes dependencies between adjacent positions into account (Zhang and Marr 1993) as an indicator of strength, as suggested by in vitro splicing studies (Roca et al. 2005).
Table 1.
Comparison of alternative and constitutive splice-site scores
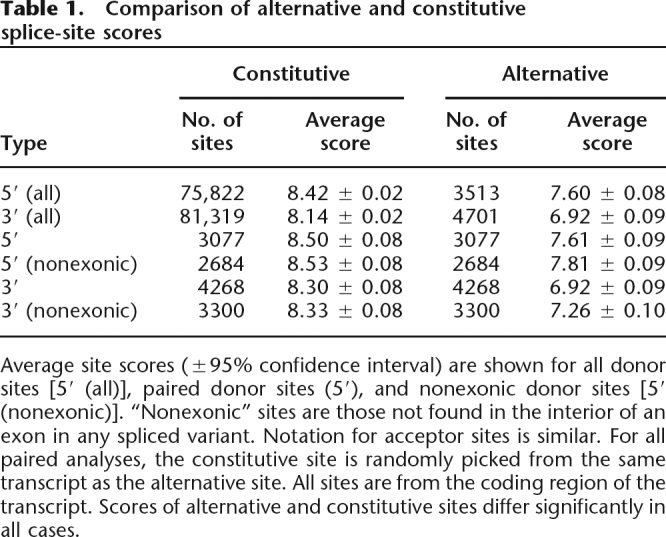
Average site scores (±95% confidence interval) are shown for all donor sites [5′ (all)], paired donor sites (5′), and nonexonic donor sites [5′ (nonexonic)]. “Nonexonic” sites are those not found in the interior of an exon in any spliced variant. Notation for acceptor sites is similar. For all paired analyses, the constitutive site is randomly picked from the same transcript as the alternative site. All sites are from the coding region of the transcript. Scores of alternative and constitutive sites differ significantly in all cases.
Higher conservation of alternative splice-site scores
To determine if there is selection to preserve splice-site strength in alternative sites, we first examined conservation of site strength by computing the (Pearson) correlation coefficient r between mouse and human site scores. Alternative sites show higher correlations: for acceptor sites, constitutive sites have r = 0.52 while alternative sites have r = 0.78; for donor sites, the constitutive site r = 0.49 and the alternative site r = 0.75. Since the intronic and exonic regions surrounding alternative sites are more highly conserved than those surrounding constitutive sites (Sorek and Ast 2003; Sugnet et al. 2004; Yeo et al. 2005), we controlled for overall levels of conservation by creating a new set of site pairs in which each alternative site is paired with a randomly selected constitutive site (not necessarily from the same gene in this case) having the exact same percent identity in the flanking intronic region and belonging to the same G + C bin. This set has 2930 donor and 3532 acceptor pairs. The constitutive acceptor-site r increased to 0.68 while the alternative acceptor-site r decreased to 0.75, and the constitutive donor-site r increased to 0.61, while the alternative donor-site r decreased to 0.72. This shows an influence of overall conservation on the score conservation, but the difference between alternative and constitutive site correlations remains statistically significant (P ≤ 0.00001). This suggests that there is selection to maintain strength of alternative splice sites, independently of other constraints on the sequence. Previous studies have discussed the contribution of regulatory elements to the elevated sequence conservation around alternative sites; our analysis indicates that part of the elevated conservation may instead reflect stronger selection to preserve splice-site strength.
Higher sequence conservation of alternative sites relative to constitutive sites does not in itself distinguish between the two hypotheses mentioned in the introduction: under either hypothesis, one expects there to be selection against mutations which weaken the site to a point where it can no longer be spliced, and because alternative sites are on average weaker than constitutive sites, relatively more mutations in alternative sites should be eliminated, resulting in higher apparent conservation. To distinguish between the two hypotheses, it is therefore necessary to look in more detail at the specific patterns of changes which do occur.
Increased conservation at nonconsensus as well as consensus nucleotides in alternative sites
We then analyzed position-specific conservation patterns (Fig. 1). In general, nonconsensus bases (those used in a minority of splice sites and which tend to weaken the site) are conserved less frequently than consensus bases (those used in a majority of sites) in both constitutive and alternative sites but more frequently in alternative sites than in constitutive sites. In donor sites, nonconsensus nucleotides all show comparable levels of conservation. In acceptor sites (which show overall higher conservation than donor sites), some nonconsensus nucleotides are more highly conserved than consensus nucleotides: for example, at position −3, the rarely used nucleotide G is highly conserved in alternative sites, and A is at least as highly conserved as the consensus bases C and T (Fig. 1). G is present in 26 alternative splice sites, of which 16 are alternative 3′ splicing cases and 10 are exon-skipping cases, and is conserved in all except one case. In the single exception (an exon-skipping case), there is a C in mouse and a G in human, dog, and chimp (rat data not available); the overall percent identity between mouse and human is relatively low (67%, close to the neutral rate) for this site, suggesting that for this gene the alternative splicing or its regulation may be under weaker selection in mouse.
Figure 1.

Mouse–human sequence conservation by splice-site position. cons_N: nucleotide N in human constitutive sites; alt_N: nucleotide N in human alternative sites, N = A, C, G, and T. Error bars represent 95% confidence interval. Consensus nucleotides are indicated in parentheses after each position. G + C content is calculated from the 10-kb region around human splice sites; 44% is the threshold defining low and high. Only paired, “nonexonic” sites (those not found in the interior of an exon in any spliced variant) were used.
Some of the higher conservation of nonconsensus nucleotides within alternative sites may reflect conservation of regulatory elements that overlap sites. For example, a recent study showed an intronic silencer (GGGG) and an exonic silencer (UAGG) to function together in regulating alternative splicing in the human glutamate NMDA R1 receptor gene, GRIN1 (Han et al. 2005). The GGGG motif in this gene overlaps donor-site positions +5 and +6, and the overlap is functionally important since moving the motif away from the splice site reduced exon skipping to background levels. Han et al. (2005) proposed that GGGG might interfere with binding of U1 and U6 snRNAs. They identified other genes with an overlapping GGGG motif and found the motif to be conserved in multiple mouse and human orthologous genes. We found 22 alternative donor sites with GGGG motifs starting at positions +3 to +6 that are conserved in human, mouse, and rat. Eliminating these cases does not significantly affect the estimated conservation rate of G at these positions.
Selection to keep alternative splice sites low scoring
If there is selection to keep alternative sites weak, then we expect changes from a nonconsensus base to another nonconsensus base to be relatively more common than changes to a consensus base, since the latter type of change will tend to make a site stronger. To investigate this we identified substitutions at alternative and constitutive sites in the mouse and rat lineages, using human as an outgroup to polarize the substitutions (Supplemental Table 2) and classified each change according to whether the original and final bases matched the consensus (c) nucleotide or did not (nonconsensus, nc) as c → nc, c → c, nc → nc, or nc → c. At nonconsensus bases, alternative sites show a significantly higher proportion of nc → nc changes than constitutive sites, for both donor and acceptor sites (Table 2): in alternative donor sites 75% of nonconsensus changes are nc → nc, vs. 64% in constitutive donor sites; in acceptor sites the corresponding values are 65% and 50%.
Table 2.
Nonconsensus-to-nonconsensus and nonconsensus-to-consensus changes in mouse and rat lineages
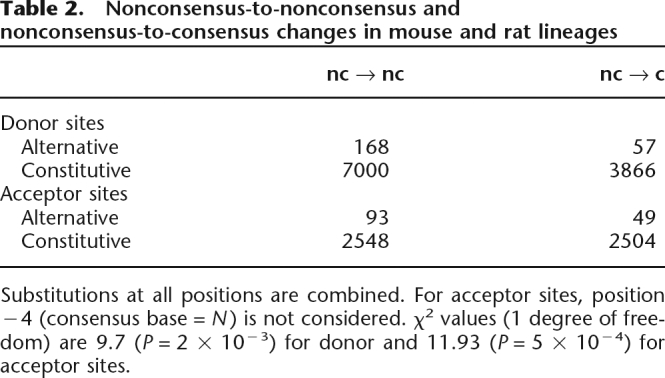
Substitutions at all positions are combined. For acceptor sites, position −4 (consensus base = N) is not considered. χ2 values (1 degree of freedom) are 9.7 (P = 2 × 10⁻³) for donor and 11.93 (P = 5 × 10⁻⁴) for acceptor sites.
At acceptor-site position −3, where the nonconsensus base G is almost always conserved between mouse and human in alternative sites (Fig. 1), we observed 19 cases where G is present in alternative sites; in all 19 it is conserved in human, mouse, and rat. Only four changes involve a nonconsensus nucleotide (which in each case is an nc → c change from A to C or T). It is known that the nonconsensus nucleotides are not equivalent at this position, with the order of preference being C ∼ T > A > G when two closely spaced potential sites are in competition (Smith et al. 1993); this may explain why we see high conservation of each nonconsensus base.
The above analysis ignores the fact that the underlying mutation rate is not the same for all nucleotide changes, with, for example, transitions occurring at a higher rate than transversions and substitutions from S (G or C) to W (A or T) at a higher rate than those from W to S (Gojobori et al. 1982; Li et al. 1984). Mutation rates also depend on G + C content of the surrounding region (Wolfe et al. 1989). We therefore undertook a more refined analysis that takes specific mutation rates into account. Constitutive sites were partitioned by G + C content of the surrounding region in the human genome into four G + C bins, such that bins have equal numbers of sites. For each bin, the substitution rate was calculated for each type of nucleotide change at each site position. Each alternative splice site was also assigned a G + C bin, and observed and expected numbers of changes (with the latter based on the constitutive site rates for the same bin) were computed.
At most positions in donor and acceptor sites, nc → c changes have the least obs/exp ratio (Table 3), indicating strong selection against such changes. However, at position +4 (consensus A) in donor sites, T → G (rather than T → A) is the least-preferred change from T, and G → T (rather than G → A) is the least-preferred change from G. It is known that T at this position can pair with U6 snRNA (Chen et al. 2001), and G with U1 snRNA (Roca et al. 2005), so G and T may not be comparable to nonconsensus bases at other positions.
Table 3.
Observed/expected (relative to constitutive sites) substitution-rate ratios in alternative splice sites in mouse and rat lineages

P, Position within the site. Boldface denotes cases where the nc → c change has the lowest value of all the possible changes involving that nucleotide and the value is statistically significant (P ≤ 0.01). The P-value was computed by simulating changes at alternative splice sites using the rate of change estimated from constitutive sites.
Finally, we investigated the effect of nucleotide changes on the log-odds score of splice sites. We first calculated observed and expected changes (with the latter based on neutrally evolving control regions) in log-odds scores at each splice-site position (see Methods). Fewer than expected changes that alter site score in alternative sites are observed compared to constitutive sites (Fig. 2). A lower obs/exp ratio is observed for negative score changes than for positive score changes for both alternative and constitutive sites, indicating strong selection against mutations that decrease the strength of the site. This trend is observed for all donor- and acceptor-site positions, although the obs/exp ratio differs somewhat by position, with more highly conserved positions showing higher obs/exp ratios for positive score changes and lower obs/exp ratios for negative score changes as compared to the less conserved positions.
Figure 2.

Ratio of observed number of changes to neutral expectation in mouse and rat splice sites, by effect on score. Alternative (ALT) sites show lower obs/exp ratio (higher conservation) than constitutive (CONS) sites, for both positive and negative score changes at all positions.
Sites that are under selection to preserve their relative strength are expected to have fewer mutations that raise or lower their scores by large amounts. To see if constitutive and alternative sites differed in this respect, we determined observed and expected changes (with the latter based on neutrally evolving control regions). The obs/exp ratio decreases with increasing magnitude of negative score changes, indicating that most score-decreasing substitutions that do occur involve small changes in site scores, for both constitutive and alternative sites (Fig. 3). We observe a similar trend for positive score changes for alternative sites but not for constitutive sites. In other words, there appears to be strong selection against mutations that increase alternative sites scores by a large amount. This supports our first hypothesis, i.e., that there is selective pressure for alternative sites to stay weak.
Figure 3.

Observed/neutral expectation substitution ratios for score changes of different magnitudes in rodent lineages. CONS, constitutive sites; ALT, alternative sites.
A potential complication affecting the analysis above is that the strength of a splice site is expected to influence the score changes it can tolerate, with low-scoring sites expected to tolerate relatively more positive changes, and relatively fewer negative changes, compared to high-scoring sites. To control for this, we found a score-matched constitutive site for each alternative site. In all cases, alternative sites show lower obs/exp score change ratios than score-matched constitutive sites, again supporting the hypothesis that they are under stronger selection to preserve their strength (Fig. 4).
Figure 4.

Observed/neutral expectation score change ratios in rodent lineages. “+” indicates changes that increase site score relative to the inferred ancestral site score, and “−” indicates changes that decrease site score in 5′ (donor) and 3′ (acceptor) sites. Alternative (ALT) sites show lower obs/exp ratio (higher conservation) than their score-matched constitutive (CONS) sites, for all types of changes. In this analysis, for each alternative site, a unique constitutive site having as close a score as possible was selected.
In summary, we observed higher correlations between human and mouse alternative site scores as compared to constitutive site scores and higher conservation of both consensus and nonconsensus nucleotides in alternative sites. Higher conservation of nonconsensus nucleotides and preferences for nc → nc changes in most cases strongly suggest that purifying selection acts to keep the site low-scoring, indicating that evolutionarily conserved alternative splice sites are under selection to maintain their strength. This supports the hypothesis that regulated alternative splicing requires relatively weak splice sites.
Methods
Identification of introns and splice sites
We obtained the human and mouse genome sequences (versions hg17 and mm5, May 2004), BLAT (Kent 2002) alignments of human and mouse ESTs and cDNAs to the genome (“chrN_intronEsT.txt” and “chrN_ mrna.txt” alignment files, February 2005 for human and May 2006 for mouse), 2,609,041 human ESTs and 1,764,981 mouse ESTs (corresponding to spliced EST alignments), and 182,754 human cDNAs and 203,641 mouse cDNAs (corresponding to all cDNA alignments) from the University of California, Santa Cruz (UCSC) Genome Bioinformatics Web site (Karolchik et al. 2003). We removed unspliced alignments (i.e., alignments to a single contiguous genomic region), ESTs from RAGE libraries, and all transcripts that had an alignment to a second genomic location having percent identity within 1% of the best alignment.
We then attempted to adjust alignments to yield “GT–AG,” “GC–AG,” and “AT–AC” splice-site boundaries, for each putative intron of size 20 bp or greater, for both possible orientations of the transcript. GT–AG splice sites were further classified as U2 or U12 based on the conserved four intronic bp adjacent to the GT. Introns not adjustable to any of these cases were ignored. Alignments with substitutions, insertions, or deletions within the 5 bp adjacent to the splice sites, or for which more than one positioning of the splice boundaries was possible, were rejected. For transcripts where some but not all introns were adjustable to fit the above criteria, we identified for each transcript orientation a “maximal scoring segment” of adjusted introns, scoring GT–AG introns as +4, GC–AG as +2, AT–AC as +1, and unadjustable introns as −∞. The orientation of the transcript was chosen based on this score, and the portion of the transcript outside this segment was ignored.
ESTs and cDNAs with overlapping internal exons and having the same orientation were considered to be from the same gene and were clustered together; transcripts overlapping only at their terminal exons were not clustered. Singleton ESTs and cDNAs (those not present in a cluster) were discarded. After filtering as above, there were 2,338,528 human ESTs and 122,206 human cDNAs in 24,273 clusters and 1,597,228 mouse ESTs and 124,697 mouse cDNAs in 24,696 clusters that were used in subsequent analyses. We used RefSeq (Pruitt et al. 2005) and Acembly Gene Predictions (J. Thierry-Mieg, D. Thierry-Mieg, M. Potdevin, and M. Sienkiewicz, unpubl.; http://www.ncbi.nih.gov/IEB/Research/Acembly) to find the genes corresponding to each cluster.
We used UCSC axtNet alignments (produced using BLASTZ; Schwartz et al. 2003) of the mouse and human genomes and UCSC multiple alignments (human, hg17; mouse, mm5; rat, rn3) to find orthologous regions. We rejected mouse and human pairwise alignments which were not reciprocal best matches or for which the human–mouse and mouse–human alignments were inconsistent. We required the three-species alignment to be consistent with the UCSC rat–human, mouse–rat, and human–mouse pairwise alignments.
Because the axtNet and multiple alignments are sometimes not complete in the splice-site region and often contain apparently spurious indels, for conservation analyses we used gap-free alignments of splice sites obtained by aligning bases at corresponding positions within the splice-site sequences of the relevant species, as in a previous study (Abril et al. 2005). There can be genuine indels within the site which can create false mismatches. However, indels within functional sites appear to be rare, and since we only consider 4 bp in the donor site and 5 bp in the acceptor site, and (in the three-species analysis) eliminate sites having more than one substitution in any lineage (see below), the impact of indels should be minimal.
Identification and classification of alternative splicing
For each gene, we clustered introns which overlap but differ at one or both ends. Such clusters represent possible alternative splicing cases. Intron-retention alternative splicing does not cluster by this criterion and is ignored in our analyses because of the possibility of misclassification due to incomplete splicing.
Alternative 3′ and alternative 5′ splicing
Clusters of introns having common donor sites and distinct acceptor sites are classified as alternative 3′ splicing if the region between two acceptor sites is present in at least one transcript. The acceptor site closest to the donor site is labeled “proximal” and the other “distal.” Similarly, intron clusters with common acceptor sites are evaluated for alternative 5′ splicing.
Exon skipping
Intron clusters containing three introns where one intron has a donor site in common with a second intron and an acceptor site in common with a third intron are probable cases of exon skipping. Clusters of >3 introns are formed when alternative 5′ and alternative 3′ splicing is coupled with exon skipping or in case of multiple exon skipping. We evaluated 3-intron clusters for the exon-skipping form of alternative splicing, and identified “exon-inclusion” and “exon-exclusion” isoforms. Exon-inclusion transcripts are required to include at least part of the internal exon.
Classification and filtering of splice sites
Each human or mouse splice site was assigned to one of the following four categories:
Alternative: Acceptor sites (proximal and distal) in alternative 3′ splicing, donor sites (proximal and distal) in alternative 5′ splicing, and the splice sites of skipped exons are classified as alternatively spliced.
Pass: If a site is not classified as alternative and there are n transcripts not spliced at that site, where n is >5 and is more than twice the number of transcripts spliced at that site, the site is assigned to the “Pass” category. Since the ends of transcripts may be poorly aligned, only sites in the internal exons of a transcript undergo this check.
Undefined: This category comprises splice sites which are in introns that are clustered but which do not fall into any of the alternative splicing categories defined above. These are likely to be cases of alternative promoters, alternative polyadenylation, or other cases where information is incomplete.
Constitutive: Splice sites not in one of the categories above and which have >5 transcripts confirming the splice are classified as constitutive. Note that our criteria permit there to be a small number of transcripts in which the site is not spliced. In genes with a very large number of supporting ESTs, it is not uncommon for every site to have a few such contradicting transcripts, likely arising from occasional incomplete splicing or incorrect transcript alignment to the genome.
Only sites classified as alternative or constitutive by the above criteria were used in subsequent analyses. We did not consider GC–AG, AT–AC, or U12-type GT–AG introns as there was not enough data for separate analysis.
For an alternative splicing case to be considered conserved between mouse and human, the orthologous mouse splice sites for all splice sites in the human overlapping intron cluster were required to show the same alternative splicing pattern in mouse transcripts. For a constitutive splicing case to be considered conserved, it had to meet the above criteria for both species, except that the >5 transcript criterion was only required for human. We did not seek evidence for constitutive or alternative splicing directly for the rat genome, due to the low number of ESTs and cDNAs available, and instead assumed that splice sites which are alternatively spliced in both human and mouse are likely to be alternatively spliced in rat also.
We classified each splice site as “coding” if it lies in the coding region of any RefSeq or Acembly gene, or as “noncoding” otherwise. An alternative splicing case is considered coding if all the splice sites involved are coding. For consistency we exclude noncoding sites from all analyses. We also usually exclude “exonic sites” (sites lying with the exons of some transcripts, i.e., distal alternative 5′ or 3′ sites), since their sequences are likely to be influenced by coding constraints and may therefore be atypical in their sequence conservation and nucleotide preferences.
In genes with CpG island promoters, the island typically has higher G + C content than the rest of the gene and may extend into (and sometimes across) the first intron (Majewski and Ott 2002). To remove intragene bias due to G + C differences, we excluded first intron donor sites and all splice sites lying within CpG islands. The latter were identified using the “cpgIslandEtxt.txt” file from UCSC, which lists CpG islands in the human genome.
Splice sites used in the human–mouse–rat analyses were required to have an invariant GT or AG in all three species and to have at least one additional position present in all three species at which human agreed with either mouse or rat (or both). The 15-bp exonic region near the site was required to have no insertions or deletions in the multiple alignment.
To control for gene-to-gene differences in composition, expression level, mutation rates, and other factors, such as tissue distribution, we chose pairs of constitutive and alternative splice sites from the same transcript. For each conserved alternative splice site, we randomly picked a conserved constitutive site of the same type (donor or acceptor) from the same gene. A given alternative site was allowed to be used in only one pair, whereas a constitutive site could potentially be used in several pairs (for different alternative sites in the same gene).
Statistical analyses
Sequence conservation was measured in aligned regions of length 30 (including gaps) as M/30, where M is the number of matching base pairs in the mouse–human alignment. For putative neutrally evolving regions, the alignments were required to start with an aligned pair of bases rather than gaps. For splice sites, we consider the 30-bp intronic region adjacent to the site (excluding the invariant GT or AG).
Statistical significance of correlation coefficient differences was assessed using Fisher’s r-to-Z transformation (Cohen and Cohen 1983).
Splice-site log-odds scores were computed using weight-array matrices (Zhang and Marr 1993), which take dinucleotide frequencies into account. Arrays spanning three exonic bases and 20 intronic bases around the splice-site junction were computed using 6154 donor and 8536 acceptor sites (both constitutive and alternative). In the case of donor sites, this window includes U1 and U6 binding sites (which include bases −3 to +6); in the case of acceptor sites, it includes the U2AF35 recognition site (bases −2 to +1; Wu et al. 1999) and much of the polypyrimidine tract (recognized by U2AF65). The set of splice-site pairs was divided into two equal G + C bins corresponding to >44% and ≤44% G + C content (where G + C content of the pair was computed from a 10-kb region centered on each human splice site), and these were used to compute bin-specific foreground dinucleotide frequencies. Each splice site was scored with an array that used bin-specific foreground frequencies and site-specific background dinucleotide frequencies derived from the 10-kb region centered on the site. Base-2 logarithms were used.
Nucleotides with >50% frequency at a position were defined as the “consensus” nucleotides. For this purpose, we examined frequency matrices formed from 6154 human donor and 8536 human acceptor sites (both constitutive and alternative) for the human–mouse paired analyses and human constitutive site frequencies for the three-species analyses. In all cases, the consensus matched that from previous studies.
Three-species analyses
Any difference between mouse and rat is assumed to reflect a nucleotide substitution occurring in the rat lineage if the human and mouse nucleotides agree, or a substitution in the mouse lineage if human and rat agree. Positions at which human differs from both mouse and rat and all splice sites with more than one intronic substitution in a single lineage are not considered.
We observe a higher rate of substitution (on average 14% higher) in the rat lineage as compared to mouse, particularly in alternative sites (Supplemental Table 2). A much higher rate of substitution in rat at positions −3 (37% higher than mouse) and +1 (167% higher than mouse) in alternative acceptor sites involves mainly consensus to consensus changes (70/74) at position −3 and nc → nc changes (13/24 changes) at position +1. Data errors are unlikely to explain these trends because constitutive splice sites (which should be similarly affected by data errors) show only a 5% higher substitution rate in rat; the Rat Genome Sequencing Project Consortium (Gibbs et al. 2004) also found that neutrally evolving regions have only a 5%–10% higher substitution rate in rat. It therefore appears possible that alternative splicing is under weaker selection in rat than mouse.
Observed vs. expected score changes
Putative neutral substitution rates for each type of change were determined from regions in the middle of introns (100 bp at both ends of the intron were excluded). Introns were grouped by G + C content of the aligned region into 4 bins such that each bin has the same number of introns. The nucleotide-specific substitution rate was calculated in each G + C bin as
where #X is the number of positions in the alignment at which X is the inferred ancestral nucleotide, and #X→ Y is the number of X-to-Y substitutions. Each site was assigned a G + C bin based on the 10-kb region surrounding it in the mouse genome. For each site, we calculate observed and expected score changes at each position as follows:
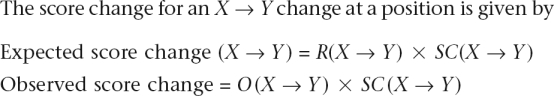 |
where R(X→ Y) is the neutral rate, O(X→ Y) (= 0 or 1) indicates whether an X→ Y change is observed in the site at that position, and SC is the log-odds score change. Observed and expected score changes are then summed over sites in the bin.
We only consider “Substitutions in Mouse” and “Substitutions in Rat” (Supplemental Table 2) for calculating O(X→ Y). In order to calculate log-odds score change for positions where the neighboring base falls in “None” category (Supplemental Table 2), we randomly chose the mouse or rat nucleotide to be the ancestral nucleotide for the neighboring base. We used the 4-bp intronic region adjacent to the donor site GT and the 5-bp intronic region adjacent to the acceptor-site AG for this analysis.
To calculate the number of observed and expected events for a particular magnitude score change, we use R(X→ Y) for expected and O(X→ Y) for observed events.
Data availability
Mouse–human orthologous site pairs and mouse–rat–human orthologous site triples are given as Supplemental Tables 3, 4, and 5. These are also available at http://www.phrap.org/othersoftware.html.
Footnotes
[Supplemental material is available online at www.genome.org.]
Article published online before print. Article and publication date are at http://www.genome.org/cgi/doi/10.1101/gr.6347907
References
- Abril J.F., Castelo R., Guigo R., Castelo R., Guigo R., Guigo R. Comparison of splice sites in mammals and chicken. Genome Res. 2005;15:111–119. doi: 10.1101/gr.3108805. [DOI] [PMC free article] [PubMed] [Google Scholar]
- Baek D., Green P., Green P. Sequence conservation, relative isoform frequencies, and nonsense-mediated decay in evolutionarily conserved alternative splicing. Proc. Natl. Acad. Sci. 2005;102:12813– 12818. doi: 10.1073/pnas.0506139102. [DOI] [PMC free article] [PubMed] [Google Scholar]
- Caputi M., Casari G., Guenzi S., Tagliabue R., Sidoli A., Melo C.A., Baralle F.E., Casari G., Guenzi S., Tagliabue R., Sidoli A., Melo C.A., Baralle F.E., Guenzi S., Tagliabue R., Sidoli A., Melo C.A., Baralle F.E., Tagliabue R., Sidoli A., Melo C.A., Baralle F.E., Sidoli A., Melo C.A., Baralle F.E., Melo C.A., Baralle F.E., Baralle F.E. A novel bipartite splicing enhancer modulates the differential processing of the human fibronectin EDA exon. Nucleic Acids Res. 1994;22:1018–1022. doi: 10.1093/nar/22.6.1018. [DOI] [PMC free article] [PubMed] [Google Scholar]
- Carmel I., Tal S., Vig I., Ast G., Tal S., Vig I., Ast G., Vig I., Ast G., Ast G. Comparative analysis detects dependencies among the 5′ splice-site positions. RNA. 2004;10:828–840. doi: 10.1261/rna.5196404. [DOI] [PMC free article] [PubMed] [Google Scholar]
- Chen J.Y., Stands L., Staley J.P., Jackups R.R., Latus L.J., Chang T.H., Stands L., Staley J.P., Jackups R.R., Latus L.J., Chang T.H., Staley J.P., Jackups R.R., Latus L.J., Chang T.H., Jackups R.R., Latus L.J., Chang T.H., Latus L.J., Chang T.H., Chang T.H. Specific alterations of U1-C protein or U1 small nuclear RNA can eliminate the requirement of Prp28p, an essential DEAD box splicing factor. Mol. Cell. 2001;7:227–232. doi: 10.1016/s1097-2765(01)00170-8. [DOI] [PubMed] [Google Scholar]
- Clark F., Thanaraj T.A., Thanaraj T.A. Categorization and characterization of transcript-confirmed constitutively and alternatively spliced introns and exons from human. Hum. Mol. Genet. 2002;11:451–464. doi: 10.1093/hmg/11.4.451. [DOI] [PubMed] [Google Scholar]
- Cohen J., Cohen P., Cohen P. Applied multiple regression/correlation analysis for the behavioral sciences. Lawrence Erlbaum Associates; Hillsdale, NJ: 1983. [Google Scholar]
- Dirksen W.P., Sun Q., Rottman F.M., Sun Q., Rottman F.M., Rottman F.M. Multiple splicing signals control alternative intron retention of bovine growth hormone pre-mRNA. J. Biol. Chem. 1995;270:5346–5352. doi: 10.1074/jbc.270.10.5346. [DOI] [PubMed] [Google Scholar]
- D’Souza I., Schellenberg G.D., Schellenberg G.D. tau exon 10 expression involves a bipartite intron 10 regulatory sequence and weak 5′ and 3′ splice sites. J. Biol. Chem. 2002;277:26587–26599. doi: 10.1074/jbc.M203794200. [DOI] [PubMed] [Google Scholar]
- Dye B.T., Buvoli M., Mayer S.A., Lin C.H., Patton J.G., Buvoli M., Mayer S.A., Lin C.H., Patton J.G., Mayer S.A., Lin C.H., Patton J.G., Lin C.H., Patton J.G., Patton J.G. Enhancer elements activate the weak 3′ splice site of α-tropomyosin exon 2. RNA. 1998;4:1523–1536. doi: 10.1017/s1355838298980360. [DOI] [PMC free article] [PubMed] [Google Scholar]
- Gibbs R.A., Weinstock G.M., Metzker M.L., Muzny D.M., Sodergren E.J., Scherer S., Scott G., Steffen D., Worley K.C., Burch P.E., Weinstock G.M., Metzker M.L., Muzny D.M., Sodergren E.J., Scherer S., Scott G., Steffen D., Worley K.C., Burch P.E., Metzker M.L., Muzny D.M., Sodergren E.J., Scherer S., Scott G., Steffen D., Worley K.C., Burch P.E., Muzny D.M., Sodergren E.J., Scherer S., Scott G., Steffen D., Worley K.C., Burch P.E., Sodergren E.J., Scherer S., Scott G., Steffen D., Worley K.C., Burch P.E., Scherer S., Scott G., Steffen D., Worley K.C., Burch P.E., Scott G., Steffen D., Worley K.C., Burch P.E., Steffen D., Worley K.C., Burch P.E., Worley K.C., Burch P.E., Burch P.E., et al. Genome sequence of the Brown Norway rat yields insights into mammalian evolution. Nature. 2004;428:493–521. doi: 10.1038/nature02426. [DOI] [PubMed] [Google Scholar]
- Gojobori T., Li W.H., Graur D., Li W.H., Graur D., Graur D. Patterns of nucleotide substitution in pseudogenes and functional genes. J. Mol. Evol. 1982;18:360–369. doi: 10.1007/BF01733904. [DOI] [PubMed] [Google Scholar]
- Han K., Yeo G., An P., Burge C.B., Grabowski P.J., Yeo G., An P., Burge C.B., Grabowski P.J., An P., Burge C.B., Grabowski P.J., Burge C.B., Grabowski P.J., Grabowski P.J.2005. . A combinatorial code for splicing silencing: UAGG and GGGG motifs PLoS Biol. 3e158. [DOI] [PMC free article] [PubMed] [Google Scholar]
- Inoue K., Hoshijima K., Higuchi I., Sakamoto H., Shimura Y., Hoshijima K., Higuchi I., Sakamoto H., Shimura Y., Higuchi I., Sakamoto H., Shimura Y., Sakamoto H., Shimura Y., Shimura Y. Binding of the Drosophila transformer and transformer-2 proteins to the regulatory elements of doublesex primary transcript for sex-specific RNA processing. Proc. Natl. Acad. Sci. 1992;89:8092–8096. doi: 10.1073/pnas.89.17.8092. [DOI] [PMC free article] [PubMed] [Google Scholar]
- Karolchik D., Baertsch R., Diekhans M., Furey T.S., Hinrichs A., Lu Y.T., Roskin K.M., Schwartz M., Sugnet C.W., Thomas D.J., Baertsch R., Diekhans M., Furey T.S., Hinrichs A., Lu Y.T., Roskin K.M., Schwartz M., Sugnet C.W., Thomas D.J., Diekhans M., Furey T.S., Hinrichs A., Lu Y.T., Roskin K.M., Schwartz M., Sugnet C.W., Thomas D.J., Furey T.S., Hinrichs A., Lu Y.T., Roskin K.M., Schwartz M., Sugnet C.W., Thomas D.J., Hinrichs A., Lu Y.T., Roskin K.M., Schwartz M., Sugnet C.W., Thomas D.J., Lu Y.T., Roskin K.M., Schwartz M., Sugnet C.W., Thomas D.J., Roskin K.M., Schwartz M., Sugnet C.W., Thomas D.J., Schwartz M., Sugnet C.W., Thomas D.J., Sugnet C.W., Thomas D.J., Thomas D.J., et al. The UCSC Genome Browser Database. Nucleic Acids Res. 2003;31:51–54. doi: 10.1093/nar/gkg129. [DOI] [PMC free article] [PubMed] [Google Scholar]
- Kent W.J. BLAT—The BLAST-like alignment tool. Genome Res. 2002;12:656–664. doi: 10.1101/gr.229202. [DOI] [PMC free article] [PubMed] [Google Scholar]
- Lavigueur A., La Branche H., Kornblihtt A.R., Chabot B., La Branche H., Kornblihtt A.R., Chabot B., Kornblihtt A.R., Chabot B., Chabot B. A splicing enhancer in the human fibronectin alternate ED1 exon interacts with SR proteins and stimulates U2 snRNP binding. Genes & Dev. 1993;7:2405–2417. doi: 10.1101/gad.7.12a.2405. [DOI] [PubMed] [Google Scholar]
- Li W.H., Wu C.I., Luo C.C., Wu C.I., Luo C.C., Luo C.C. Nonrandomness of point mutation as reflected in nucleotide substitutions in pseudogenes and its evolutionary implications. J. Mol. Evol. 1984;21:58–71. doi: 10.1007/BF02100628. [DOI] [PubMed] [Google Scholar]
- Majewski J., Ott J., Ott J. Distribution and characterization of regulatory elements in the human genome. Genome Res. 2002;12:1827– 1836. doi: 10.1101/gr.606402. [DOI] [PMC free article] [PubMed] [Google Scholar]
- Muro A.F., Iaconcig A., Baralle F.E., Iaconcig A., Baralle F.E., Baralle F.E. Regulation of the fibronectin EDA exon alternative splicing. Cooperative role of the exonic enhancer element and the 5′ splicing site. FEBS Lett. 1998;437:137–141. doi: 10.1016/s0014-5793(98)01201-0. [DOI] [PubMed] [Google Scholar]
- Neumann M., Mittelbronn M., Simon P., Vanmassenhove B., de Silva R., Lees A., Klapp J., Meyermann R., Kretzschmar H.A., Mittelbronn M., Simon P., Vanmassenhove B., de Silva R., Lees A., Klapp J., Meyermann R., Kretzschmar H.A., Simon P., Vanmassenhove B., de Silva R., Lees A., Klapp J., Meyermann R., Kretzschmar H.A., Vanmassenhove B., de Silva R., Lees A., Klapp J., Meyermann R., Kretzschmar H.A., de Silva R., Lees A., Klapp J., Meyermann R., Kretzschmar H.A., Lees A., Klapp J., Meyermann R., Kretzschmar H.A., Klapp J., Meyermann R., Kretzschmar H.A., Meyermann R., Kretzschmar H.A., Kretzschmar H.A. A new family with frontotemporal dementia with intronic 10 + 3 splice site mutation in the tau gene: Neuropathology and molecular effects. Neuropathol. Appl. Neurobiol. 2005;31:362–373. doi: 10.1111/j.1365-2990.2005.00629.x. [DOI] [PubMed] [Google Scholar]
- Pruitt K.D., Tatusova T., Maglott D.R., Tatusova T., Maglott D.R., Maglott D.R. NCBI Reference Sequence (RefSeq): A curated non-redundant sequence database of genomes, transcripts and proteins. Nucleic Acids Res. 2005;33:D501–D504. doi: 10.1093/nar/gki025. [DOI] [PMC free article] [PubMed] [Google Scholar]
- Resch A., Xing Y., Alekseyenko A., Modrek B., Lee C., Xing Y., Alekseyenko A., Modrek B., Lee C., Alekseyenko A., Modrek B., Lee C., Modrek B., Lee C., Lee C. Evidence for a subpopulation of conserved alternative splicing events under selection pressure for protein reading frame preservation. Nucleic Acids Res. 2004;32:1261–1269. doi: 10.1093/nar/gkh284. [DOI] [PMC free article] [PubMed] [Google Scholar]
- Roca X., Sachidanandam R., Krainer A.R., Sachidanandam R., Krainer A.R., Krainer A.R. Determinants of the inherent strength of human 5′ splice sites. RNA. 2005;11:683–698. doi: 10.1261/rna.2040605. [DOI] [PMC free article] [PubMed] [Google Scholar]
- Schwartz S., Kent W.J., Smit A., Zhang Z., Baertsch R., Hardison R.C., Haussler D., Miller W., Kent W.J., Smit A., Zhang Z., Baertsch R., Hardison R.C., Haussler D., Miller W., Smit A., Zhang Z., Baertsch R., Hardison R.C., Haussler D., Miller W., Zhang Z., Baertsch R., Hardison R.C., Haussler D., Miller W., Baertsch R., Hardison R.C., Haussler D., Miller W., Hardison R.C., Haussler D., Miller W., Haussler D., Miller W., Miller W. Human–mouse alignments with BLASTZ. Genome Res. 2003;13:103–107. doi: 10.1101/gr.809403. [DOI] [PMC free article] [PubMed] [Google Scholar]
- Smith C.W., Valcarcel J., Valcarcel J. Alternative pre-mRNA splicing: The logic of combinatorial control. Trends Biochem. Sci. 2000;25:381–388. doi: 10.1016/s0968-0004(00)01604-2. [DOI] [PubMed] [Google Scholar]
- Smith C.W., Chu T.T., Nadal-Ginard B., Chu T.T., Nadal-Ginard B., Nadal-Ginard B. Scanning and competition between AGs are involved in 3′ splice site selection in mammalian introns. Mol. Cell. Biol. 1993;13:4939–4952. doi: 10.1128/mcb.13.8.4939. [DOI] [PMC free article] [PubMed] [Google Scholar]
- Sorek R., Ast G., Ast G. Intronic sequences flanking alternatively spliced exons are conserved between human and mouse. Genome Res. 2003;13:1631–1637. doi: 10.1101/gr.1208803. [DOI] [PMC free article] [PubMed] [Google Scholar]
- Sorek R., Shamir R., Ast G., Shamir R., Ast G., Ast G. How prevalent is functional alternative splicing in the human genome? Trends Genet. 2004;20:68–71. doi: 10.1016/j.tig.2003.12.004. [DOI] [PubMed] [Google Scholar]
- Stamm S., Zhang M.Q., Marr T.G., Helfman D.M., Zhang M.Q., Marr T.G., Helfman D.M., Marr T.G., Helfman D.M., Helfman D.M. A sequence compilation and comparison of exons that are alternatively spliced in neurons. Nucleic Acids Res. 1994;22:1515–1526. doi: 10.1093/nar/22.9.1515. [DOI] [PMC free article] [PubMed] [Google Scholar]
- Stamm S., Zhu J., Nakai K., Stoilov P., Stoss O., Zhang M.Q., Zhu J., Nakai K., Stoilov P., Stoss O., Zhang M.Q., Nakai K., Stoilov P., Stoss O., Zhang M.Q., Stoilov P., Stoss O., Zhang M.Q., Stoss O., Zhang M.Q., Zhang M.Q. An alternative-exon database and its statistical analysis. DNA Cell Biol. 2000;19:739–756. doi: 10.1089/104454900750058107. [DOI] [PubMed] [Google Scholar]
- Sugnet C.W., Kent W.J., Ares M., Haussler D., Kent W.J., Ares M., Haussler D., Ares M., Haussler D., Haussler D. Transcriptome and genome conservation of alternative splicing events in humans and mice. Pac. Symp. Biocomput. 2004;9:66–77. doi: 10.1142/9789812704856_0007. [DOI] [PubMed] [Google Scholar]
- Wolfe K.H., Sharp P.M., Li W.H., Sharp P.M., Li W.H., Li W.H. Mutation rates differ among regions of the mammalian genome. Nature. 1989;337:283– 285. doi: 10.1038/337283a0. [DOI] [PubMed] [Google Scholar]
- Wu S., Romfo C.M., Nilsen T.W., Green M.R., Romfo C.M., Nilsen T.W., Green M.R., Nilsen T.W., Green M.R., Green M.R. Functional recognition of the 3′ splice site AG by the splicing factor U2AF35. Nature. 1999;402:832–835. doi: 10.1038/45590. [DOI] [PubMed] [Google Scholar]
- Yeo G.W., Van Nostrand E., Holste D., Poggio T., Burge C.B., Van Nostrand E., Holste D., Poggio T., Burge C.B., Holste D., Poggio T., Burge C.B., Poggio T., Burge C.B., Burge C.B. Identification and analysis of alternative splicing events conserved in human and mouse. Proc. Natl. Acad. Sci. 2005;102:2850– 2855. doi: 10.1073/pnas.0409742102. [DOI] [PMC free article] [PubMed] [Google Scholar]
- Zavolan M., Kondo S., Schonbach C., Adachi J., Hume D.A., Hayashizaki Y., Gaasterland T., Kondo S., Schonbach C., Adachi J., Hume D.A., Hayashizaki Y., Gaasterland T., Schonbach C., Adachi J., Hume D.A., Hayashizaki Y., Gaasterland T., Adachi J., Hume D.A., Hayashizaki Y., Gaasterland T., Hume D.A., Hayashizaki Y., Gaasterland T., Hayashizaki Y., Gaasterland T., Gaasterland T. Impact of alternative initiation, splicing, and termination on the diversity of the mRNA transcripts encoded by the mouse transcriptome. Genome Res. 2003;13:1290–1300. doi: 10.1101/gr.1017303. [DOI] [PMC free article] [PubMed] [Google Scholar]
- Zhang M.Q., Marr T.G., Marr T.G. A weight array method for splicing signal analysis. Comput. Appl. Biosci. 1993;9:499–509. doi: 10.1093/bioinformatics/9.5.499. [DOI] [PubMed] [Google Scholar]
- Zheng Z.M., Quintero J., Reid E.S., Gocke C., Baker C.C., Quintero J., Reid E.S., Gocke C., Baker C.C., Reid E.S., Gocke C., Baker C.C., Gocke C., Baker C.C., Baker C.C. Optimization of a weak 3′ splice site counteracts the function of a bovine papillomavirus type 1 exonic splicing suppressor in vitro and in vivo. J. Virol. 2000;74:5902–5910. doi: 10.1128/jvi.74.13.5902-5910.2000. [DOI] [PMC free article] [PubMed] [Google Scholar]
- Zheng C.L., Fu X.D., Gribskov M., Fu X.D., Gribskov M., Gribskov M. Characteristics and regulatory elements defining constitutive splicing and different modes of alternative splicing in human and mouse. RNA. 2005;11:1777–1787. doi: 10.1261/rna.2660805. [DOI] [PMC free article] [PubMed] [Google Scholar]
Associated Data
This section collects any data citations, data availability statements, or supplementary materials included in this article.
Data Availability Statement
Mouse–human orthologous site pairs and mouse–rat–human orthologous site triples are given as Supplemental Tables 3, 4, and 5. These are also available at http://www.phrap.org/othersoftware.html.