

Abstract
Introns that interrupt eukaryotic protein-coding sequences are generally thought to be nonfunctional. However, for reasons still poorly understood, positions of many introns are highly conserved in evolution. Previous reconstructions of intron gain and loss events during eukaryotic evolution used a variety of simplified evolutionary models that yielded contradicting conclusions and are not suited to reveal some of the key underlying processes. We combine a comprehensive probabilistic model and an extended data set, including 391 conserved genes from 19 eukaryotes, to uncover previously unnoticed aspects of intron evolution—in particular, to assign intron gain and loss rates to individual genes. The rates of intron gain and loss in a gene show moderate positive correlation. A gene’s intron gain rate shows a highly significant negative correlation with the coding-sequence evolution rate; intron loss rate also significantly, but positively, correlates with the sequence evolution rate. Correlations of the opposite signs, albeit less significant ones, are observed between intron gain and loss rates and gene expression level. It is proposed that intron evolution includes a neutral component, which is manifest in the positive correlation between the gain and loss rates and a selection-driven component as reflected in the links between intron gain and loss and sequence evolution. The increased intron gain and decreased intron loss in evolutionarily conserved genes indicate that intron insertion often might be adaptive, whereas some of the intron losses might be deleterious. This apparent functional importance of introns is likely to be due, at least in part, to their multiple effects on gene expression.
Introns, noncoding sequences interrupting protein-coding genes, are the hallmark of eukaryotic genes organization (Lamond 1999; Rodriguez-Trelles et al. 2006; Roy and Gilbert 2006). The introns are removed and the fragmented coding sequences, exons, are spliced together through the action of the spliceosome, an enormously complex molecular machine that consists of multiple small RNA and protein molecules, and is conserved in all eukaryotes (Jurica and Moore 2003; Collins and Penny 2005).
So far, introns were found in all eukaryotic species with fully sequenced genomes, albeit at a range of densities that spans orders of magnitudes: in large genomes of multicellular eukaryotes, most genes contain multiple introns, whereas many unicellular eukaryotes with compact genomes possess mostly genes containing only one intron or intronless genes (Logsdon 1998; Mourier and Jeffares 2003; Jeffares et al. 2006). Moreover, numerous introns have their genomic position conserved between different taxa, including distantly related ones such as animals and plants; some of these introns persist even in unicellular eukaryotes with extremely intron-poor genes (Fedorov et al. 2002; Rogozin et al. 2003; Russell et al. 2005; Vanacova et al. 2005; Rodriguez-Trelles et al. 2006; Roy and Gilbert 2006). A comprehensive theory to explain all of these observations—intron abundance, vast differences in distribution among species, and high level of position conservation—is still missing. Generally, introns are thought not to have functions (Doolittle and Sapienza 1980; Orgel and Crick 1980; Hickey et al. 1989; Lynch and Conery 2003) although some introns contain functional sequences, such as genes for small RNAs (Ying and Lin 2005), or contribute to coupling of gene transcription, splicing, and mRNA export (Maniatis and Reed 2002). The distribution of intron densities among species has been suggested to reflect differences in effective population size and in mutation rates (Lynch 2002; Lynch and Conery 2003). This population-genetic perspective predicts an inverse correlation between intron gain and loss along lineages, a prediction that was refuted by our observations (see accompanying paper in this issue, Carmel et al. 2007).
Several recent genome-wide studies have attempted a reconstruction of the history of intron gain and loss during the evolution of eukaryotes. These analyses used different approaches and models of evolution—in particular, parsimony and various techniques of statistical inference such as maximum likelihood (ML) (Rogozin et al. 2003, 2005; Qiu et al. 2004; Csuros 2005; Nguyen et al. 2005; Roy and Gilbert 2005a, b). Depending on the method and specific assumptions, these studies yielded evolutionary scenarios that widely differ with respect to the relative contributions of intron loss and intron gain. Some found a considerable excess of losses (Roy and Gilbert 2005a, b), others found exactly the opposite (Qiu et al. 2004; Nguyen et al. 2005), and yet others found many losses and gains but did not determine which of these processes is dominant (Rogozin et al. 2003; Csuros 2005).
The incongruity between these reconstructions stems from several sources (Rogozin et al. 2005; Roy and Gilbert 2006). In brief, Dollo parsimony (Rogozin et al. 2003) tends to underestimate the number of introns in ancestral nodes and to overestimate the number of gains in branches leading to extant species. The technique of Roy and Gilbert, which combines aspects of parsimony and ML (Roy and Gilbert 2005a, b) heavily relies on the assumption that introns located at the same genomic position necessarily have common ancestry, thus overestimating the number of introns in ancestral nodes (Csuros 2005). The evolutionary model developed by Qiu et al. (2004) assumes that, for each gene family, intron gain and loss rates are uniform across the entire phylogenetic tree, an assumption that is clearly not supported by empirical observations. The ML (Csuros 2005; Nguyen et al. 2005) consider only intron-bearing sites for their inference and use different additional procedures to estimate the number of sites that do not harbor introns at all.
Common to all previous studies on intron gain and loss is that they use branch-specific models, meaning that the probability of events (intron gain or loss) to happen along a branch depends only on intrinsic properties of this branch. Importantly, this probability is assumed to be the same for all genes; in practice, this means that all genes are concatenated. Methodologically, there is a strong incentive for using branch-specific models, because it substantially reduces the number of parameters in the model. Insufficient data is a major problem in statistical inference involving a large number of parameters. Specifically, ML estimators are known to improve, in terms of both bias and variance, with the increase of the data set size (Lehman and Casella 1998). The data sets available for analysis of evolution of gene structure are relatively small (Rogozin et al. 2003), such that, to maintain inference reliability, the number of parameters in the models had to be reduced at the expense of losing potentially important information on intron gain and loss rate variations between genes.
The only exception to the approach described above is the model of evolution used by Qiu et al. (2004). They developed a gene-specific model, whereby the probabilities of intron gain or loss in a particular gene along a particular branch of the phylogenetic tree depend solely on the identity of the gene. Such an approach, however, is even less realistic in light of the observed differences in event turnover rates between species and clades.
In reality, the likelihood of the gain or loss of an intron in a given position depends on both the gene and the branch. Thus, we designed a more comprehensive model of evolution, in which both lineage and gene heterogeneity is taken into consideration. In our approach, a specially developed methodology overcomes the problems caused by the multitude of parameters and provides for accurate reconstructions, as shown by extensive simulations (see the accompanying paper, Carmel et al. 2007). In addition, we developed means to decompose the relative contributions of the lineages and the genes to the observed rates of intron gain and loss. Combined with a large data set consisting of 391 sets of orthologous genes from 19 eukaryotic species, this methodology leads to more conclusive inferences on intron gain and loss than achievable previously.
In the accompanying paper (Carmel et al. 2007), we report the more traditional analysis at the lineage level. Here, the results of the analysis at the gene level are reported. We show that gene-specific intron gain rate correlates negatively with the sequence evolution rate and that gene-specific intron loss rate shows the opposite, positive correlation with the sequence evolution rate. Thus, much of intron accumulation in conserved genes might be an adaptive process; conceivably due to the effect of introns on gene expression at several levels.
Results and Discussion
The model of evolution
This model is detailed in the accompanying paper (Carmel et al. 2007). Here, we provide a brief summary, with the emphasis on the aspects of the model that are most pertinent to the analysis of the gene-specific components of intron gain and loss. Let us consider an S-species rooted phylogenetic tree (hence, with N = 2S − 1 nodes), with a known topology and known branch lengths (in time units), Δ1,...,ΔN−1. We adopt the convention that branch t is the one leading into node t, and that the root is indexed by zero. Let qt and qtP stand for the state of node t and its parent node, respectively, where the state can be either zero (absence of an intron) or one (presence of an intron). The transition matrix for gene g along branch t, Tij(g,t) = P(qt = j|qtP = i,g), is given by
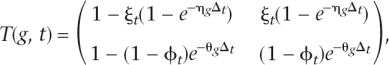 |
where ηg and θg are gene-specific gain and loss rates, respectively, and ξt and ϕt are branch-specific gain and loss coefficients, respectively. Importantly, the form of this transition matrix explicitly states that the probability of each event (gain, loss, retention) depends on both the gene and the branch.
The inference procedure
We developed a methodology, based on an expectation-maximization algorithm, to reconstruct the history of intron-exon evolution (see the accompanying paper, Carmel et al. 2007). This reconstructed history consists of three components: the matrix P of size S − 1 (number of internal nodes) over G (number of genes), with P(t,g) being the inferred number of introns in gene g at internal node t; the matrix A of size 2(S − 1) (number of branches) over G, with A(t,g) being the inferred number of intron gains in gene g along branch t; and the matrix L of size 2(S − 1) over G, with L(t,g) being the inferred number of intron losses in gene g along branch t. In the accompanying paper (Carmel et al. 2007), we used extensive simulations to show that, on average, the relative error in estimating the number of ancestral introns is 1%, the relative error in estimating the number of intron losses is 3%, and the relative error in estimating the number of intron gains is ∼11%. These reconstructions reflect the combined effects of the branches and the genes. Another algorithm was devised to decompose these reconstructions into the separate contributions of the branches and the genes (see Methods). In formal terms, the algorithm uses the reconstructions as the input for the estimation of the branch-specific intron gain and loss coefficients, ξt and ϕt, and the gene-specific intron gain and loss rates, ηg and θg (see Methods).
Here, we investigate the contribution of the gene-specific component of intron gain and loss to the evolution of eukaryotic genes. With respect to parameter estimation, this is a much harder problem than the analysis of the branch-specific component because, in a typical data set, the number of genes (G) vastly exceeds the number of branches [2(S − 1)]. In our data set, G = 391, which is more than 10 times the number of branches [2(S − 1) = 36]. The process of estimating branch parameters can be construed as using data from G different sources (i.e., what happened to each gene along the given branch). Conversely, the process of estimating gene parameters uses only 2(S − 1) different sources (i.e., what happened to each gene along all branches). Since 2(S − 1) is small compared with G, the estimate of the gene-specific parameters is expected to be of lesser accuracy. Based on the simulation results, we found, in the accompanying paper (Carmel et al. 2007), that the mean correlation coefficients between the estimated branch-specific rates and the actual (simulated) ones are 0.97 for loss rate, and 0.90 for gain rate. Using the same set of simulations, the average correlation coefficient of the gene-specific rates are 0.77 for intron loss and 0.75 for intron gain (Supplemental Fig. S1; Supplemental file raw_data.xls). The clusters of orthologous eukaryotic genes (KOGs) (Tatusov et al. 2003; Koonin et al. 2004) with the highest gain rates (top 10%) are listed in Supplemental Table S1, and the KOGs with the highest loss rates are listed in Supplemental Table S2.
Positive correlation between gene-specific rates of intron gain and loss
The results at the gene level lend further credence to the existence of a universal, balanced mode of evolution. In the accompanying paper (Carmel et al. 2007), we proposed that the positive correlation between intron gain and loss rate, which is unexpected from the population-genetic perspective, stems from mechanistic components shared by these two processes. Under this hypothesis, positive correlation between intron gain and loss is also expected at the level of individual genes. Indeed, the correlation coefficient between intron gain rate and intron loss rate was found to be positive (albeit relatively small; R = 0.16) and statistically significant (P = 0.003), even after the correction for multiple comparisons (see Methods) (Fig. 1A).
Figure 1.

Scatter plots of the gene-specific intron gain and loss rates versus other genomic variables. (A) Intron gain rate vs. intron loss rate; (B) intron gain rate vs. gene evolution rate (ER); (C) intron gain rate vs. gene expression level (EL); (D) intron gain rate vs. number of paralogs (NP); (E) intron loss rate vs. gene evolution rate; (F) intron loss rate vs. gene expression level. Units of the variables: gain rate (arbitrary units); loss rate (arbitrary units); ER (average over a KOG of median normalized JTT distances); EL (maximum among paralogs of standardize log-values of expression readings); NP (average number of paralogs across seven eukaryotic species) (for details, see Wolf et al. 2006).
We further checked that the correlation between the gene-specific rates is not an artifact stemming from effects of tree topology. To this end we used the simulated data (see the accompanying paper, Carmel et al. 2007, for details) where the true (simulated) gene-specific rates are known to be uncorrelated. For each simulation we estimated the gene-specific rates and measured the correlation between the estimates. Practically zero correlation was detected between the estimated gene-specific rates, proving that the significant correlation detected with the real data are not artifactual (mean correlation coefficient between estimated rates over 100 simulations was −0.0070, maximum correlation found in the simulations −0.0043, and minimum correlation −0.0131).
A consequence of the positive correlation between gene-specific rates of intron gain and loss is that eight KOGs are common to the lists of the top 10% (39) intron gainers (Supplemental Table S1) and the top 39 intron losers (Supplemental Table S2), which is a significantly greater overlap than expected due to chance (P = 0.044; one-sided binomial exact test). These genes seem to be particularly dynamic, displaying a wide repertoire of intron–exon structures.
Increased intron gain and decreased intron loss in slowly evolving genes
We investigated possible links between intron gain and/or loss and other aspects of gene functions and evolution that do not appear to be linked to introns, at least, at face value. No evidence was found that intron loss or gain rate significantly depended on the biological function of genes (Supplemental Fig. S2; Supplemental Tables S1, S2).
Next, we tested the correlation between intron gain and loss rates and seven quantitative variables, namely, evolution rate of the coding sequence, propensity for gene loss during evolution, number of paralogs, expression level, connectivity in protein–protein interactions, connectivity in genetic interactions, and lethality in knockout experiments. The values of these variables for the analyzed genes were taken from a recent detailed study on unifying measures of gene function and evolution (Wolf et al. 2006). As shown in Table 1, intron gain rate showed significant negative correlation with evolutionary rate (Table 1; Fig. 1B; R = −0.22; P = 1 × 10⁻⁵) and significant positive correlation with expression level (Table 1; Fig. 1C; R = 0.18; P = 3.6 × 10⁻⁴) and with the number of paralogs (Table 1; Fig. 1D; R = 0.15; P = 3.06 × 10⁻³). Intron loss rates showed almost the opposite behavior, with significant positive correlation with evolutionary rate (Table 1; Fig. 1E; R = 0.31; P = 2 × 10⁻⁸) and significant negative correlation with expression level (Table 1; Fig. 1F; R = −0.23; P = 4 × 10⁻⁵).
Table 1.
Correlation between intron gain and loss rates and other genomic variables
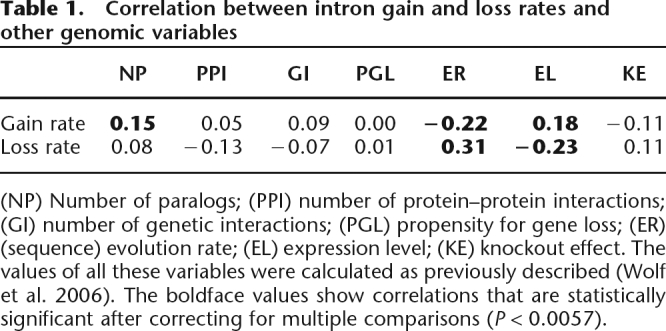
(NP) Number of paralogs; (PPI) number of protein–protein interactions; (GI) number of genetic interactions; (PGL) propensity for gene loss; (ER) (sequence) evolution rate; (EL) expression level; (KE) knockout effect. The values of all these variables were calculated as previously described (Wolf et al. 2006). The boldface values show correlations that are statistically significant after correcting for multiple comparisons (P < 0.0057).
Expression level and evolutionary rate are known to be strongly negatively correlated (Pal et al. 2001; Krylov et al. 2003; Rocha and Danchin 2004; Drummond et al. 2005; Wall et al. 2005; Zhang and He 2005; Wolf et al. 2006). This correlation is seen in the current analysis as well, with a correlation coefficient of R = −0.45 (Supplemental Table S3). Thus, the observed correlations between intron gain and loss rates and evolutionary rate, in principle, might be side effects of the dependence of intron gain rate on expression level, or vice versa. Partial correlation analysis (Table 2) shows that the fundamental correlations that remained significant after the control for the effect of other variables are those between intron loss and gain rates and sequence evolution rate, with the correlation being positive for loss rate and negative for gain rate (Table 1). Thus, slowly evolving conserved genes tend to gain introns at elevated rates and also tend to retain their existing introns. This trend is expected to lead to a net increase in the number of introns. Indeed, in our data set, there is a strong and significant negative correlation between the density of the intron positions in a gene and its sequence evolution rate (R = −0.31; P = 5 × 10⁻¹⁰). This finding refutes the notion that genes with fast evolving coding sequences show a higher turnover of introns than sequences with a slower rate of evolution (Castillo-Davis et al. 2004).
Table 2.
Partial correlation analysis for intron gain and loss rates and other genomic variables
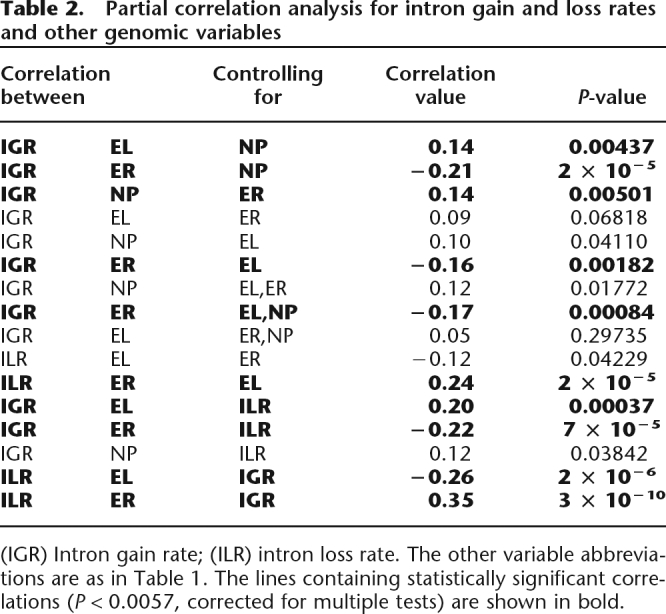
(IGR) Intron gain rate; (ILR) intron loss rate. The other variable abbreviations are as in Table 1. The lines containing statistically significant correlations (P < 0.0057, corrected for multiple tests) are shown in bold.
The correlations between intron gain and loss rates and other genomic variables can be visualized using multiple linear regression (Fig. 2). Although the errors in the regression coefficients considerably increase when the variables are not independent (as in this case), one can get an impression of the relationships between the variables from the figure. Specifically, the central role of the sequence evolution rate is conspicuous.
Figure 2.

Coefficients of the multiple linear regression of gene-specific intron gain rate (light gray), and of gene-specific intron loss rate (dark gray). The bars show the 95% confidence interval, and the line within each bar shows the optimal value.
Despite the positive correlation between them, intron gain and loss rates show opposite correlations with sequence evolution rate and expression level. This suggests, in accord with the notion of the balanced mode of evolution (see the accompanying paper, Carmel et al. 2007), that there is a universal process of intron gain and loss in which gain and loss rates are strongly and positively correlated. This process is likely to be independent of gene properties, such as sequence evolution rate and expression level. On top of this background process, some genes show significant variations in gain and loss rates that do depend on gene properties and are inversely related. This conjecture implies that the positive correlation between intron gain and loss rates (R = 0.16) is the low bound of the correlation that characterizes the universal background process. Indeed, when the correlations of intron gain rate with genomic variables are recomputed after controlling for intron loss rate, or vice versa, the observed trends sharpen (Table 2).
Conclusions
The results of this analysis reveal two major gene-specific trends of intron gain and loss. First, the gain and loss rates are moderately, but significantly and positively, correlated with one another. Second, these rates show a striking pattern of correlations with the rate of evolution of the gene’s coding sequence, such that evolutionarily conserved genes tend to gain more and lose fewer introns than faster evolving genes. These results suggest that evolution of introns consists of a neutral background component and a selection-driven component. The neutral background seems to correspond to the balanced mode of evolution, where intron gain and loss rates are proportional, possibly reflecting mechanistic similarities in the two processes (Sverdlov et al. 2004; see also the accompanying paper, Carmel et al. 2007). The selection-driven component of intron evolution is manifested in the significantly increased gain and significantly decreased loss of introns in evolutionarily conserved genes such that, as the net result, these genes have a considerably greater intron density than faster evolving ones.
It has been repeatedly reported that highly expressed genes evolve slowly (Pal et al. 2001; Krylov et al. 2003; Jordan et al. 2004), and it even has been suggested that gene expression level might be the primary determinant of the sequence evolution rate (Drummond et al. 2005, 2006). However, the present analysis strongly suggests that the correlations of intron gain and loss rates with the coding-sequence evolution rate are more fundamental than those with expression level, and in any case, are not reducible to the latter. Consequently, it appears most unlikely that the observed correlations have a mechanistic explanation (e.g., had the primary correlation been with the expression level, one could surmise that highly expressed genes have more opportunity for intron insertion). Thus, the present findings imply that many introns are sufficiently important for the functions of the respective genes to be subject to readily detectable selection. Introns have been shown to affect the expression of a variety of genes at several levels including mRNA export, stability, and translation efficiency (Bourdon et al. 2001; Rose 2002, 2004; Le Hir et al. 2003; Nott et al. 2003). These complex effects of introns on gene expression might explain why intron insertion, in many cases, seems to be favored by natural selection, whereas loss of introns appears to be deleterious. As shown in the accompanying paper (Carmel et al. 2007), the distribution of intron gains across the evolutionary tree of eukaryotes is highly non-uniform, such that gains apparently occurred primarily during major evolutionary transitions, such as the origin of the animals. Conceivably, accumulation of introns in these transitional epochs contributed to the evolution of new networks of expression regulation.
Thus, the results described here indicate that the notion that introns, in general, have no function and are retained passively owing to relaxed purifying selection in small populations (Lynch 2002, 2006; Lynch and Conery 2003), is far from being a complete picture of intron evolution. On the contrary, both positive and purifying selection appear to be major contributors to the evolution of introns.
Methods
The data set
The steps taken to compile the data set are detailed in the accompanying paper (Carmel et al. 2007). In brief, we identified 391 sets of orthologous genes from 19 eukaryotes for which we could define regions of highly reliable alignment. The species include nine metazoans (Caenorhabditis elegans, Strongylocentrotus purpuratus, Ciona intestinalis, Danio rerio, Gallus gallus, Homo sapiens, rodents (Mus musculus and Rattus norvegicus combined), Drosophila melanogaster and Anopheles gambiae); five fungi (Cryptococcus neoformans, Schizosaccharomyces pombe, Saccharomyces cerevisiae, Aspergillus fumigatus, and Neurospora crassa); two plants (Arabidopsis thaliana and Oryza sativa); two apicomplexans (Theileria parva and Plasmodium falciparum); and the amoebozoan Dictyostelium discoideum. We adopted the traditional tree topology with the root in between apicomplexa and the common ancestor of multicellular eukaryotes (Supplemental Fig. S3), and we assumed monophyletic coelomates (the grouping together of arthropods and deuterostomia, to the exclusion of nematodes). The results, however, are practically insensitive to variations in the topology, as shown in the accompanying paper (Carmel et al. 2007). Intron positions were projected onto the alignments to form a binary presence/absence map (Rogozin et al. 2003). The data is available from ftp://ftp.ncbi.nih.gov/pub/koonin/carmel_introns/, see file final_data.zip.
Decomposing intron gains
For a gain in branch t to happen, the site in the parent node should be in state 0. If we denote by L(g) the length of the alignment of gene g, then the number of such sites is L(g) − P(tP,g) + 1⁄2L(t,g), where tP is the parent node of t. The last term (in most cases negligible) accounts for sites that hosted an intron at the beginning but lost it somewhere along the branch. Therefore, the gain probability per site of gene g along branch t is just
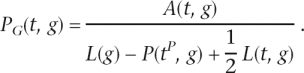 |
Under the adopted model of evolution, this probability is given by
This last equation means that PG(t,g) is approximated by a multiplication of a column-vector (ξtΔt) and a row-vector ηg, which is, by definition, a rank-1 matrix. A well-known result (Golub and Van Loan 1983) is that the best rank-1 approximation of a matrix (in the Frobenius norm sense, that is, the square root of the sum of squares of all elements in the matrix) is achieved by using the first right and left eigenvectors of its singular value decomposition (SVD). Therefore, if ut and vg are the first left and right eigenvectors, respectively, of the SVD of PG, then, up to a normalization factor
 |
The accuracy of these estimations was tested using an exhaustive simulation study (for details see the accompanying paper, Carmel et al. 2007) and was measured as the correlation coefficient between the estimated parameters and the actual (simulated) ones. In the accompanying paper (Carmel et al. 2007), the ensuing branch-specific intron gain rates were shown to have a correlation coefficient of 0.90. The gene-specific gain rates have a correlation coefficient of 0.75 (Supplemental Fig. S1).
Decomposing intron losses
Since it is more convenient to refer to retention than loss, let R(t,g) = P(tP,g) − L(t,g) be the number of introns retained on branch t for gene g. The retention probability per site is
 |
Under the adopted model of evolution, this probability is given by
where, for convenience, we introduced the notation ρt = 1 − ϕt. Analogously to what we have done for gains, we find by iterative algorithm the vectors ρt and ϕt that best approximate PR(t,g) in the Frobenius-norm sense.
There is, however, a major difference between gains and losses. While the number of sites available for gains, L(g) − P(tP,g) + 1⁄2L(t,g), is always much greater than zero, this is not so for losses. Whenever P(tp,g) is zero (no intron at the beginning of the branch), L(t,p) must be zero too (no losses are possible along this branch), resulting in PR(t,g) being undefined, and therefore uninformative for the estimation of θg (gene-specific loss rate). Of course, P(tp,g) being zero is unlikely for concatenated genes, but highly likely at the level of individual genes. We can formalize it by defining the information content (IC) of a gene as the fraction of informative branches. A gene lacking an intron throughout the entire evolution will have IC equal to zero, while a gene that contains at least one intron in all internal nodes of the tree has IC equal to one. Clearly, no inference can be made about the loss rate of a gene with IC zero. Furthermore, inference on genes with positive, but low IC is also dubious as it relies on a small number of branches, thus lacking statistical power. In our data, 148 genes (37.9%) have IC = 1, and nine genes (2.3%) have IC = 0 (Supplemental Fig. S4).
The immediate consequence of this phenomenon is that loss rates cannot be estimated for all genes. Obviously, this is the case for the nine intronless genes. But, more generally, we would like to have a threshold T, such that only genes with IC > T will be taken into the analysis. As we increase T, we increase the reliability of the inferred loss rates, but we reduce the number of genes analyzed. We have picked a threshold value of T = 0.8, hardly compromising on accuracy, while managing to compute loss rate to ∼80% of the genes (Supplemental Fig. S5). With this threshold, the gene-specific loss rates have a correlation coefficient of 0.77 (Supplemental Fig. S1).
Statistical analysis
Correlations of intron gain and loss rates are tested among themselves, against seven genomic variables, and are also tested for functional enrichment. This makes nine comparisons. Despite the fact that testing for functional enrichment is not a test on correlation, we adopted a conservative approach by setting the significance level per each comparison on the value 1 − (1 − 0.05)1/9 = 0.0057, to make it compatible with an overall significance level of 0.05.
Acknowledgments
This work was supported by the Intramural Research Program of the National Library of Medicine at the National Institutes of Health/DHHS.
Footnotes
[Supplemental material is available online at www.genome.org.]
Article published online before print. Article and publication date are at http://www.genome.org/cgi/doi/10.1101/gr.5978207
References
- Bourdon V., Harvey A., Lonsdale D.M., Harvey A., Lonsdale D.M., Lonsdale D.M. Introns and their positions affect the translational activity of mRNA in plant cells. EMBO Rep. 2001;2:394–398. doi: 10.1093/embo-reports/kve090. [DOI] [PMC free article] [PubMed] [Google Scholar]
- Carmel L., Wolf Y.I., Rogozin I.B., Koonin E.V., Wolf Y.I., Rogozin I.B., Koonin E.V., Rogozin I.B., Koonin E.V., Koonin E.V. Three distinct modes of intron dynamics in the evolution of eukaryotes. Genome Res. 2007 doi: 10.1101/gr.6438607. (this issue) [DOI] [PMC free article] [PubMed] [Google Scholar]
- Castillo-Davis C.I., Bedford T.B., Hartl D.L., Bedford T.B., Hartl D.L., Hartl D.L. Accelerated rates of intron gain/loss and protein evolution in duplicate genes in human and mouse malaria parasites. Mol. Biol. Evol. 2004;21:1422–1427. doi: 10.1093/molbev/msh143. [DOI] [PubMed] [Google Scholar]
- Collins L., Penny D., Penny D. Complex spliceosomal organization ancestral to extant eukaryotes. Mol. Biol. Evol. 2005;22:1053–1066. doi: 10.1093/molbev/msi091. [DOI] [PubMed] [Google Scholar]
- Csuros M. Likely scenarios of intron evolution. Comparative Genomics. Lecture Notes in Computer Science. 2005;3678:47–60. [Google Scholar]
- Doolittle W.F., Sapienza C., Sapienza C. Selfish genes, the phenotype paradigm and genome evolution. Nature. 1980;284:601–603. doi: 10.1038/284601a0. [DOI] [PubMed] [Google Scholar]
- Drummond D.A., Bloom J.D., Adami C., Wilke C.O., Arnold F.H., Bloom J.D., Adami C., Wilke C.O., Arnold F.H., Adami C., Wilke C.O., Arnold F.H., Wilke C.O., Arnold F.H., Arnold F.H. Why highly expressed proteins evolve slowly. Proc. Natl. Acad. Sci. 2005;102:14338–14343. doi: 10.1073/pnas.0504070102. [DOI] [PMC free article] [PubMed] [Google Scholar]
- Drummond D.A., Raval A., Wilke C.O., Raval A., Wilke C.O., Wilke C.O. A single determinant dominates the rate of yeast protein evolution. Mol. Biol. Evol. 2006;23:327–337. doi: 10.1093/molbev/msj038. [DOI] [PubMed] [Google Scholar]
- Fedorov A., Merican A.F., Gilbert W., Merican A.F., Gilbert W., Gilbert W. Large-scale comparison of intron positions among animal, plant, and fungal genes. Proc. Natl. Acad. Sci. 2002;99:16128–16133. doi: 10.1073/pnas.242624899. [DOI] [PMC free article] [PubMed] [Google Scholar]
- Golub G.H., Van Loan G.F., Van Loan G.F. Matrix theory. Johns Hopkins University Press; Baltimore, MD: 1983. [Google Scholar]
- Hickey D.A., Benkel B.F., Abukashawa S.M., Benkel B.F., Abukashawa S.M., Abukashawa S.M. A general model for the evolution of nuclear pre-mRNA introns. J. Theor. Biol. 1989;137:41–53. doi: 10.1016/s0022-5193(89)80148-1. [DOI] [PubMed] [Google Scholar]
- Jeffares D.C., Mourier T., Penny D., Mourier T., Penny D., Penny D. The biology of intron gain and loss. Trends Genet. 2006;22:16–22. doi: 10.1016/j.tig.2005.10.006. [DOI] [PubMed] [Google Scholar]
- Jordan I.K., Marino-Ramirez L., Wolf Y.I., Koonin E.V., Marino-Ramirez L., Wolf Y.I., Koonin E.V., Wolf Y.I., Koonin E.V., Koonin E.V. Conservation and coevolution in the scale-free human gene coexpression network. Mol. Biol. Evol. 2004;21:2058–2070. doi: 10.1093/molbev/msh222. [DOI] [PubMed] [Google Scholar]
- Jurica M.S., Moore M.J., Moore M.J. Pre-mRNA splicing: Awash in a sea of proteins. Mol. Cell. 2003;12:5–14. doi: 10.1016/s1097-2765(03)00270-3. [DOI] [PubMed] [Google Scholar]
- Koonin E.V., Fedorova N.D., Jackson J.D., Jacobs A.R., Krylov D.M., Makarova K.S., Mazumder R., Mekhedov S.L., Nikolskaya A.N., Rao B.S., Fedorova N.D., Jackson J.D., Jacobs A.R., Krylov D.M., Makarova K.S., Mazumder R., Mekhedov S.L., Nikolskaya A.N., Rao B.S., Jackson J.D., Jacobs A.R., Krylov D.M., Makarova K.S., Mazumder R., Mekhedov S.L., Nikolskaya A.N., Rao B.S., Jacobs A.R., Krylov D.M., Makarova K.S., Mazumder R., Mekhedov S.L., Nikolskaya A.N., Rao B.S., Krylov D.M., Makarova K.S., Mazumder R., Mekhedov S.L., Nikolskaya A.N., Rao B.S., Makarova K.S., Mazumder R., Mekhedov S.L., Nikolskaya A.N., Rao B.S., Mazumder R., Mekhedov S.L., Nikolskaya A.N., Rao B.S., Mekhedov S.L., Nikolskaya A.N., Rao B.S., Nikolskaya A.N., Rao B.S., Rao B.S., et al. A comprehensive evolutionary classification of proteins encoded in complete eukaryotic genomes. Genome Biol. 2004;5:R7. doi: 10.1186/gb-2004-5-2-r7. [DOI] [PMC free article] [PubMed] [Google Scholar]
- Krylov D.M., Wolf Y.I., Rogozin I.B., Koonin E.V., Wolf Y.I., Rogozin I.B., Koonin E.V., Rogozin I.B., Koonin E.V., Koonin E.V. Gene loss, protein sequence divergence, gene dispensability, expression level, and interactivity are correlated in eukaryotic evolution. Genome Res. 2003;13:2229–2235. doi: 10.1101/gr.1589103. [DOI] [PMC free article] [PubMed] [Google Scholar]
- Lamond A.I. RNA splicing. Running rings around RNA. Nature. 1999;397:655–656. doi: 10.1038/17697. [DOI] [PubMed] [Google Scholar]
- Le Hir H., Nott A., Moore M.J., Nott A., Moore M.J., Moore M.J. How introns influence and enhance eukaryotic gene expression. Trends Biochem. Sci. 2003;28:215–220. doi: 10.1016/S0968-0004(03)00052-5. [DOI] [PubMed] [Google Scholar]
- Lehman E.L., Casella G., Casella G. Theory of point estimation. Springer; New York: 1998. [Google Scholar]
- Logsdon J.M., Jr. The recent origins of spliceosomal introns revisited. Curr. Opin. Genet. Dev. 1998;8:637–648. doi: 10.1016/s0959-437x(98)80031-2. [DOI] [PubMed] [Google Scholar]
- Lynch M. Intron evolution as a population-genetic process. Proc. Natl. Acad. Sci. 2002;99:6118–6123. doi: 10.1073/pnas.092595699. [DOI] [PMC free article] [PubMed] [Google Scholar]
- Lynch M. The origins of eukaryotic gene structure. Mol. Biol. Evol. 2006;23:450–468. doi: 10.1093/molbev/msj050. [DOI] [PubMed] [Google Scholar]
- Lynch M., Conery J.S., Conery J.S. The origins of genome complexity. Science. 2003;302:1401–1404. doi: 10.1126/science.1089370. [DOI] [PubMed] [Google Scholar]
- Maniatis T., Reed R., Reed R. An extensive network of coupling among gene expression machines. Nature. 2002;416:499–506. doi: 10.1038/416499a. [DOI] [PubMed] [Google Scholar]
- Mourier T., Jeffares D.C., Jeffares D.C. Eukaryotic intron loss. Science. 2003;300:1393. doi: 10.1126/science.1080559. [DOI] [PubMed] [Google Scholar]
- Nguyen H.D., Yoshihama M., Kenmochi N., Yoshihama M., Kenmochi N., Kenmochi N. New maximum likelihood estimators for eukaryotic intron evolution. PLoS Comput. Biol. 2005;1:e79. doi: 10.1371/journal.pcbi.0010079. [DOI] [PMC free article] [PubMed] [Google Scholar]
- Nott A., Meislin S.H., Moore M.J., Meislin S.H., Moore M.J., Moore M.J. A quantitative analysis of intron effects on mammalian gene expression. RNA. 2003;9:607–617. doi: 10.1261/rna.5250403. [DOI] [PMC free article] [PubMed] [Google Scholar]
- Orgel L.E., Crick F.H., Crick F.H. Selfish DNA: The ultimate parasite. Nature. 1980;284:604–607. doi: 10.1038/284604a0. [DOI] [PubMed] [Google Scholar]
- Pal C., Papp B., Hurst L.D., Papp B., Hurst L.D., Hurst L.D. Highly expressed genes in yeast evolve slowly. Genetics. 2001;158:927–931. doi: 10.1093/genetics/158.2.927. [DOI] [PMC free article] [PubMed] [Google Scholar]
- Qiu W.G., Schisler N., Stoltzfus A., Schisler N., Stoltzfus A., Stoltzfus A. The evolutionary gain of spliceosomal introns: Sequence and phase preferences. Mol. Biol. Evol. 2004;21:1252–1263. doi: 10.1093/molbev/msh120. [DOI] [PubMed] [Google Scholar]
- Rocha E.P., Danchin A., Danchin A. An analysis of determinants of amino acids substitution rates in bacterial proteins. Mol. Biol. Evol. 2004;21:108–116. doi: 10.1093/molbev/msh004. [DOI] [PubMed] [Google Scholar]
- Rodriguez-Trelles F., Tarro R., Ayala F.J., Tarro R., Ayala F.J., Ayala F.J. Origin and evolution of spliceosomal introns. Annu. Rev. Genet. 2006 doi: 10.1146/annurev.genet.40.110405.0990625. [DOI] [PubMed] [Google Scholar]
- Rogozin I.B., Wolf Y.I., Sorokin A.V., Mirkin B.G., Koonin E.V., Wolf Y.I., Sorokin A.V., Mirkin B.G., Koonin E.V., Sorokin A.V., Mirkin B.G., Koonin E.V., Mirkin B.G., Koonin E.V., Koonin E.V. Remarkable interkingdom conservation of intron positions and massive, lineage-specific intron loss and gain in eukaryotic evolution. Curr. Biol. 2003;13:1512–1517. doi: 10.1016/s0960-9822(03)00558-x. [DOI] [PubMed] [Google Scholar]
- Rogozin I.B., Sverdlov A.V., Babenko V.N., Koonin E.V., Sverdlov A.V., Babenko V.N., Koonin E.V., Babenko V.N., Koonin E.V., Koonin E.V. Analysis of evolution of exon-intron structure of eukaryotic genes. Brief. Bioinform. 2005;6:118–134. doi: 10.1093/bib/6.2.118. [DOI] [PubMed] [Google Scholar]
- Rose A.B. Requirements for intron-mediated enhancement of gene expression in Arabidopsis. RNA. 2002;8:1444–1453. doi: 10.1017/s1355838202020551. [DOI] [PMC free article] [PubMed] [Google Scholar]
- Rose A.B. The effect of intron location on intron-mediated enhancement of gene expression in Arabidopsis. Plant J. 2004;40:744–751. doi: 10.1111/j.1365-313X.2004.02247.x. [DOI] [PubMed] [Google Scholar]
- Roy S.W., Gilbert W., Gilbert W. Complex early genes. Proc. Natl. Acad. Sci. 2005a;102:1986–1991. doi: 10.1073/pnas.0408355101. [DOI] [PMC free article] [PubMed] [Google Scholar]
- Roy S.W., Gilbert W., Gilbert W. Rates of intron loss and gain: Implications for early eukaryotic evolution. Proc. Natl. Acad. Sci. 2005b;102:5773–5778. doi: 10.1073/pnas.0500383102. [DOI] [PMC free article] [PubMed] [Google Scholar]
- Roy S.W., Gilbert W., Gilbert W. The evolution of spliceosomal introns: Patterns, puzzles and progress. Nat. Rev. Genet. 2006;7:211–221. doi: 10.1038/nrg1807. [DOI] [PubMed] [Google Scholar]
- Russell A.G., Shutt T.E., Watkins R.F., Gray M.W., Shutt T.E., Watkins R.F., Gray M.W., Watkins R.F., Gray M.W., Gray M.W. An ancient spliceosomal intron in the ribosomal protein L7a gene (Rpl7a) of Giardia lamblia. BMC Evol. Biol. 2005;5:45. doi: 10.1186/1471-2148-5-45. [DOI] [PMC free article] [PubMed] [Google Scholar]
- Sverdlov A.V., Babenko V.N., Rogozin I.B., Koonin E.V., Babenko V.N., Rogozin I.B., Koonin E.V., Rogozin I.B., Koonin E.V., Koonin E.V. Preferential loss and gain of introns in 3′ portions of genes suggests a reverse-transcription mechanism of intron insertion. Gene. 2004;338:85–91. doi: 10.1016/j.gene.2004.05.027. [DOI] [PubMed] [Google Scholar]
- Tatusov R.L., Fedorova N.D., Jackson J.D., Jacobs A.R., Kiryutin B., Koonin E.V., Krylov D.M., Mazumder R., Mekhedov S.L., Nikolskaya A.N., Fedorova N.D., Jackson J.D., Jacobs A.R., Kiryutin B., Koonin E.V., Krylov D.M., Mazumder R., Mekhedov S.L., Nikolskaya A.N., Jackson J.D., Jacobs A.R., Kiryutin B., Koonin E.V., Krylov D.M., Mazumder R., Mekhedov S.L., Nikolskaya A.N., Jacobs A.R., Kiryutin B., Koonin E.V., Krylov D.M., Mazumder R., Mekhedov S.L., Nikolskaya A.N., Kiryutin B., Koonin E.V., Krylov D.M., Mazumder R., Mekhedov S.L., Nikolskaya A.N., Koonin E.V., Krylov D.M., Mazumder R., Mekhedov S.L., Nikolskaya A.N., Krylov D.M., Mazumder R., Mekhedov S.L., Nikolskaya A.N., Mazumder R., Mekhedov S.L., Nikolskaya A.N., Mekhedov S.L., Nikolskaya A.N., Nikolskaya A.N., et al. The COG database: An updated version includes eukaryotes. BMC Bioinformatics. 2003;4:41. doi: 10.1186/1471-2105-4-41. [DOI] [PMC free article] [PubMed] [Google Scholar]
- Vanacova S., Yan W., Carlton J.M., Johnson P.J., Yan W., Carlton J.M., Johnson P.J., Carlton J.M., Johnson P.J., Johnson P.J. Spliceosomal introns in the deep-branching eukaryote Trichomonas vaginalis. Proc. Natl. Acad. Sci. 2005;102:4430–4435. doi: 10.1073/pnas.0407500102. [DOI] [PMC free article] [PubMed] [Google Scholar]
- Wall D.P., Hirsh A.E., Fraser H.B., Kumm J., Giaever G., Eisen M.B., Feldman M.W., Hirsh A.E., Fraser H.B., Kumm J., Giaever G., Eisen M.B., Feldman M.W., Fraser H.B., Kumm J., Giaever G., Eisen M.B., Feldman M.W., Kumm J., Giaever G., Eisen M.B., Feldman M.W., Giaever G., Eisen M.B., Feldman M.W., Eisen M.B., Feldman M.W., Feldman M.W. Functional genomic analysis of the rates of protein evolution. Proc. Natl. Acad. Sci. 2005;102:5483–5488. doi: 10.1073/pnas.0501761102. [DOI] [PMC free article] [PubMed] [Google Scholar]
- Wolf Y.I., Carmel L., Koonin E.V., Carmel L., Koonin E.V., Koonin E.V. Unifying measures of gene function and evolution. Proc. Biol. Sci. 2006;273:1507–1515. doi: 10.1098/rspb.2006.3472. [DOI] [PMC free article] [PubMed] [Google Scholar]
- Ying S.Y., Lin S.L., Lin S.L. Intronic microRNAs. Biochem. Biophys. Res. Commun. 2005;326:515–520. doi: 10.1016/j.bbrc.2004.10.215. [DOI] [PubMed] [Google Scholar]
- Zhang J., He X., He X. Significant impact of protein dispensability on the instantaneous rate of protein evolution. Mol. Biol. Evol. 2005;22:1147–1155. doi: 10.1093/molbev/msi101. [DOI] [PubMed] [Google Scholar]