Abstract
As part of a large epidemiologic study of lung cancer, 55,000 subjects, we have conducted a nation-wide survey of particulate exposures in the US trucking industry. The goal is to differentiate the risks from various types of particulate exposures, such as traffic emissions and general air pollution. We hypothesize that exposures defined by job and work site characteristics can be linked with subjects using their personal job histories.
This report covers exposures at 36 randomly sited large truck freight terminals in the US. Measurements were made of PM2.5, elemental carbon (EC), and organic carbon (OC) upwind of the terminal (background) and in work areas, and by personal samples. Significant differences in exposure intensity, dg/m3, were found for work locations and jobs relative to background levels (GM[GSD]) at terminal sites: PM2.5 9.8[2.34], EC 0.5[3.24], and OC 5.0[1.76]. Using EC as a marker for diesel particles, work locations varied significantly: office 0.3[3.7], dock area 0.7[2.89] and shop area 1.5[3.52]), as did job titles (non-smokers): clerk 0.1[9.98], dockworker 0.8[2.13], and mechanic 2.0[3.82]. Cigarette smoking contributed substantially to personal exposures, approximately doubling PM2.5 and OC, but having less of an effect on EC.
Large differences were seen across the terminal sites due to differences in local regional air pollution levels from traffic and other sources. We conclude that it will be possible to estimate current exposures of the cohort using an exposure assignment matrix based on job title, work location, and terminal site. This distribution overlaps substantially with the general public’s exposure to these sources.
Introduction
An extensive set of studies have shown a small but consistent increased risk of lung cancer in groups with occupational exposure to diesel exhaust 1, 2 and diesel is widely cited as a probable human carcinogen 3-8. Although epidemiologic studies illuminating the increased cancer risks are numerous, none of these studies have included detailed exposure assessments, and for this reason the dose-response relationship is very uncertain 9. There are a limited number of detailed exposure assessments from industries with diesel exposures10-12 with which to draw conclusions about the exposures of effected workers. As a result, although there is a consistent increased risk of lung cancer, the amount of exposure associated with this increase is unclear.
Our research group is conducting a National Cancer Institute funded cohort study of lung cancer in the US trucking industry, where diesel and other vehicle emission exposures are common. The cohort contains approximately 55,000 people who were working in four large trucking companies in 1985, whose mortality experience will be determined up to 2000. The four companies providing workers and the International Brotherhood of Teamsters are active participants in the study. Our plan is to make semi-personal estimates of historical exposures using each subject’s personal job history kept by the company that employs him. The job history identifies the sequence of job titles and terminal locations where the subject has worked. These characteristics plus data from company records on each freight terminal’s size and location, and data on age and type of trucks in the fleet can be used to assign exposures.
The goal of our exposure assessment is to determine the levels of occupational exposure to diesel exhaust and other common environmental particulate pollutants, so that we can conduct a quantitative assessment of the risk per unit of exposure to diesel and other airborne particles in our epidemiology study. We present here our evaluation strategy, measurement methods, and initial descriptive findings on exposures to PM2.5, elemental carbon, and total organic compounds for our five-year study.
Description of the unionized less-than-truckload industry
The less-than-truckload sector of the US trucking industry primarily ships pallet-sized packages from individual vendors. This distinguishes them from their counterparts who ship entire truckloads or small parcels. Figure 1 presents a diagram of a generic truck freight terminal. The center of a freight terminal is a warehouse building where freight is moved from one trailer to another. The trailers are backed up to a raised platform, the “dock”, which has a series of doors along each side. A large terminal may have hundreds of doors and have a dock that is hundreds of meters long. Most large terminals have two types of trucking operations, local “pickup and delivery” (P&D) and long haul (LH) moving freight between terminals, usually several hundred miles distant. The P&D drivers pick-up from and deliver freight to local customers.
Figure 1.
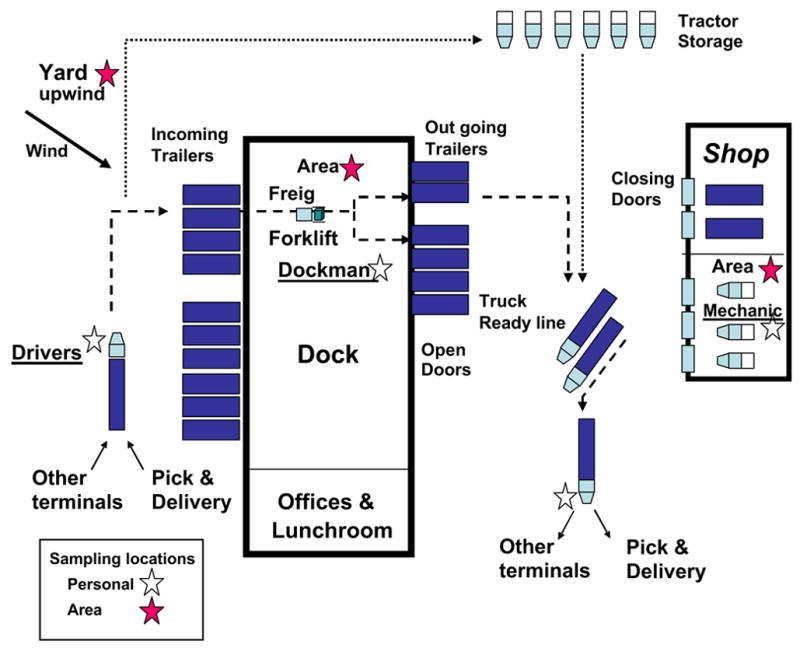
Diagram of a truck freight terminal showing job titles and work locations.
Freight dock operations are 24 hr/day, 7 days a week at large terminals. Freight is moved between trailers by dockworkers driving small liquid propane powered forklifts that have two metal “forks” on a lifting rack on the front of the motorized unit. Odd sized, large bulky materials like semi-rigid plastic swimming pools are moved manually. When a truck arrives at a terminal, it is checked-in and released by the driver. A hostler separates the tractor from the trailer, and takes the tractor to be inspected, refueled, and parked in the ready line. He then moves the trailer to one of the doors at the dock using a special purpose diesel vehicle (Yard Tug), or stores it in the incoming trailer area to be moved later. Tractors and trailers that have been damaged or need to be serviced are taken to the shop to be repaired by a mechanic. Those terminals without shops contract out their repair and maintenance needs.
In summary, the following job groups work at large terminals (over 100 employees): LH drivers, P&D drivers, dockworkers, hostlers, mechanics, combination workers, and clerks. Combination workers do either dock work or P&D driving on a given day as needed. The jobs have relatively homogeneous task activities as defined by union work rules. Table 1 shows the numbers of subjects in each group working in 2002, with the largest groups consisting of the drivers and dock workers. Since we cannot estimate each subject’s personal exposure, the objective of the exposure assessment is to characterize the particulate exposures of each individual job group as a function of the terminal and tractor characteristics and other influential factors. We will then use each subject’s job history to assign average exposures across time and calculate dose metrics, such as cumulative exposure (duration times average concentration), to determine the impact of diesel and other particle exposures on their cancer risk.
Table 1.
Description of Major Epidemiologic Job Groups in 2002
| Job Title Group | Duties | Work Location | Number in 2002 |
|---|---|---|---|
| Long haul driver | Operate heavy duty tractor-trailer trucks between cities | Highway truck cab | 12,771 |
| Pick-up/Delivery (P&D) | Drive tractors and smaller single-bodied trucks either within cities or rural areas; pick-up and deliver cargo between terminal docks and consumers | In and out of truck cab | 4,941 |
| Dock worker | Load and unload cargo, may operate forklifts | Loading dock | 10,533 |
| P&D/Dock “Combo” worker | Combination job: perform activities of either P&D driver or dock worker as needed | As noted above | 12,151 |
| Mechanic | Repair and maintain tractors; job may include fueling | Truck repair shop | 1,849 |
| Hostler | Drive “yard tug” (small, specialized tractor units that do not comply with emissions standards), moving trailers to and from the freight dock | Terminal yard | 2,585 |
| Clerks | Cashiers, dock clerks, dispatchers, customer service representatives, and others not regularly near vehicles | Offices, occasionally dock | 1,879 |
Materials and Methods
Study design
In the mid-1990s, a small pilot study using the same measurement methods reported in this paper, was conducted to evaluate personal PM2.5, EC and OC exposures in four small (<50 employees) truck terminals in northern New England and a large terminal (>100 employees) in Atlanta to determine if exposures varied by work location, job title, terminal size, and site (urban vs. rural)13. Based on those pilot data, we hypothesized that there would be significant differences in both composition and concentration (intensity) of exposures by job, terminal characteristics, and location. We are looking for important group differences in exposure to particulate matter that could be useful for an epidemiologic study of lung cancer. Three types of particulate matter are being measured: mass of particles less than 2.5 microns in diameter (PM2.5), and elemental carbon (EC) and organic compounds (OC). Composition is also defined by the relative amounts of EC in total carbon (TC) (EC+OC).
A person’s exposure is the result of a relatively complex interaction of contaminants from three primary sources: (1) local air pollution background, along with regional and weather impacts; (2) work area exposures from freight handling activities in the terminal, repair activities in the shop, and vehicular traffic for drivers; and (3) job specific activities and smoking status. We are assessing the impacts of all of these factors. We also are attempting to distinguish between diesel emissions and those from other vehicles, as well as other combustion sources using a source apportionment analysis.
A total of thirty-six large terminals (>100 employees) were selected for sampling based on the regional distribution across the US. When there was more than one terminal in a region, one was selected at random, such as in southern California. A field team visited each large terminal for 5 days of 24 hr/day measurements. Box samplers (described below) were placed for area sampling in the offices, freight dock, or shop. Locations identified as central to the ongoing operations were chosen, such as a foreman’s desk in the center of the dock or repair area. Local background pollution was measured by placing samplers in the yard, upwind of the terminal. Terminal workers were invited to volunteer for personal sampling, during which they wore particle samplers for PM2.5 and EC and OC (in PM1) in a special harness.
Dockworkers and drivers work 8–12 hr shifts. Mechanics and clerks work 8 hr shifts. Usually P&D drivers work during the day and LH drivers work at night. Drivers were asked to perform their normal driving activities with a sampling box mounted in the cab to measure their micro-environment (see Figure 2). All workers who volunteered for personal sampling gave informed consent and completed a short questionnaire about their work and smoking activities. The sampling protocol was approved by the Harvard School of Public Health, Human Subject Committee.
Figure 2.
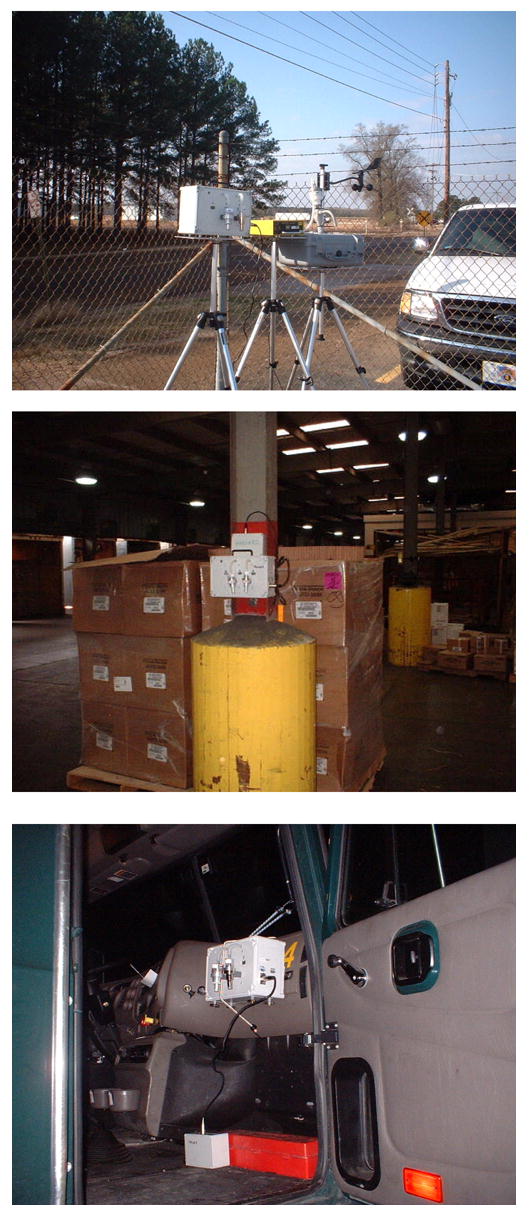
Pictures of box samplers in typical settings
Sampling methods
PM2.5
PM2.5 was measured by a method that gives results consistent with the EPA PQ200 Federal Reference Method14, 15. Particles were collected on a 37 mm Teflon filter, 0.2 dm diameter pore size, after passing through a precision machined cyclone separator (GK2.05 SH (KTL), BGI, Inc., Waltham, MA) to remove particles greater than 2.5 dm aerodynamic diameter. Mass collected on the filter was determined by gravimetric analysis using an analytical balance (Mettler Micro-Gravimetric No. M5; Mettler Instruments Corporation, Hightstown, NJ). The filters were pre-weighted after humidity equilibrium (temperature within 20–23°C and relative humidity 40±5% for at least 48 h) in a chamber. At the end of sampling, the filter was taken back to the laboratory and reweighed after humidity equilibrium to determine weight gain.
EC and OC
EC and OC were determined by the NIOSH 5040 method 16. PM1 was collected on a 22 mm Quartz tissue filter, preceded by a precision machined cyclone separator (SCC1.062 Triplex, BGI, Inc., Waltham, MA) to remove particles greater than 1.0 dm aerodynamic diameter. PM1 was chosen for this measurement because we were interested in a marker of fresh diesel and other vehicle emissions before they had agglomerated into the accumulative mode of atmospheric aerosols. Measurements made during a feasibility study showed that the PM1 mass is normally 90–98% of the PM2.5 mass in the terminal work locations and vehicle cabs. An artifact was found in OC data from area and personal samples collected where there was cigarette smoking. In those settings, the OC content frequently exceeded the PM2.5. It is known that quartz fiber filters will adsorb polar hydrocarbon vapors from the air stream and cigarette smoke has a high concentration of polar vapors 17, 18.
The particle collectors, their pumps, and a real time monitor for temperature and humidity (HOBO, Onset Computer Corp, Bourne, MA) were all mounted in a box housing connected to an external battery. This system (“box sampler”) was used for area and truck cab sampling, as shown in Figure 2.
Background Data on Sampling Sites
In addition to the collection of samples, extensive data were collected for each terminal, its operations, and on the repair shop if one was present. This included the dimensions of the dock, yard, and shop, the number of doors on the dock and shop, ventilation in the shop, the number of forklifts, P&D tractors, and LH tractors assigned to the terminal, workforce numbers on Dockmen, Drivers, and Mechanics, and finally terminal operations including the number of P&D and LH trucks sent/returning during the survey.
Local weather data were also collected for each sampling session, approximately every 12 hours during the five-day site visit. Weather data included observed precipitation, wind speed and direction, temperature and relative humidity from on-site hourly measurements. In addition, we obtained climatologic data from National Oceanographic and Atmospheric Administration (NOAA) databases, which included precipitation and atmospheric stability measures. EPA data from the local Air Quality System (AQS) monitoring stations within a 50 km radius of each terminal were also collected to provide a surrogate marker of ambient air pollution levels. These background data are being used separately to construct an overall predictive model of particle exposure at the terminal locations, and only the summary statistics are provided here (Table 2).
Table 2.
Summary Statistics of Model Explanatory Variables
| Mean | Stand. Dev. | Min | Max | |
|---|---|---|---|---|
| Terminal Characteristics | ||||
| Dimensions (acres) | ||||
| Dock area | 1.9 | 0.6 | 0.7 | 3.4 |
| Yard area | 24.2 | 11.5 | 8.0 | 55.7 |
| Shop area | 0.4 | 0.5 | 0 | 1.6 |
| # of Dock doors | 147.9 | 45.1 | 60 | 260 |
| Equipment | ||||
| Forklifts | 36.4 | 17.0 | 11 | 73 |
| LH tractors | 52.8 | 68.7 | 0 | 230 |
| P&D tractors | 38.6 | 21.7 | 0 | 95 |
| Employees | ||||
| Dock workers | 94.4 | 68.9 | 11 | 388 |
| LH drivers | 115.7 | 109.8 | 0 | 386 |
| P&D drivers | 40.8 | 20.7 | 4 | 79 |
| Mechanics | 16.2 | 16.7 | 0 | 64 |
| Hostlers | 23.0 | 14.9 | 2 | 49 |
| Office workers | 34.3 | 34.4 | 0 | 103 |
| Hostler tractors | 5.8 | 4.9 | 0 | 27 |
| Total employees | 212.7 | 231.8 | 3 | 919 |
| Other Location Data | ||||
| AIRS AQS PM2.5 (μg/m3) | 12.1 | 5.5 | 5.7 | 23.8 |
| Wind speed (km/hr) | 13.6 | 6.0 | 5.6 | 38.2 |
| Temperature (C 0) | 14.0 | 9.6 | −8.7 | 37.1 |
| Precipitation (centimeters) | 0.1 | 0.6 | 0 | 7.4 |
| Relative humidity | 69.6 | 16.8 | 15.4 | 100 |
| Barometric pressure | 29.2 | 1.2 | 24.1 | 30.4 |
Statistical methods
The data were analyzed to examine the exposures in our cohort of trucking industry employees. All statistical tests performed on the data have used Intercooled Stata Version 8.2 (StataCorp, College Station, TX). Summary statistics are provided in Tables 3-6 and boxplots in Figures 4-5 for PM2.5, EC, OC, and the EC/TC ratio by trip, job title, location, and smoking status.
Table 3.
EC Summary Statistics by Location and Job
| Arithmetic | Geometric | ||||
|---|---|---|---|---|---|
| N | Mean | SD | Mean | SD | |
| Work Area | |||||
| Office | 112 | 0.51 | 0.54 | 0.31 | 3.72 |
| Yard Upwind (background) | 607 | 0.80 | 0.89 | 0.52 | 3.24 |
| Dock | 697 | 0.96 | 0.78 | 0.73 | 2.89 |
| Shop | 214 | 2.96 | 4.00 | 1.54 | 3.52 |
| Non-smokers | |||||
| On-site Workers | |||||
| Clerk | 15 | 0.43 | 0.52 | 0.09 | 9.98 |
| Dockworker | 342 | 0.99 | 0.71 | 0.76 | 2.13 |
| Mechanic | 101 | 4.45 | 9.34 | 2.00 | 3.82 |
| Hostler | 69 | 1.19 | 0.71 | 0.88 | 3.04 |
| Off-site Drivers | |||||
| P&D | 366 | 1.41 | 1.06 | 1.09 | 2.48 |
| LH | 173 | 1.32 | 0.70 | 1.12 | 1.91 |
| Smokers | |||||
| On-site Workers | |||||
| Clerk | 2 | 1.27 | 0.66 | 1.19 | 1.70 |
| Dockworker | 101 | 1.19 | 0.78 | 0.98 | 1.93 |
| Mechanic | 28 | 3.29 | 2.64 | 2.41 | 2.27 |
| Hostler | 21 | 2.22 | 1.49 | 1.74 | 2.21 |
| Off-site Drivers | |||||
| P&D | 112 | 2.37 | 4.61 | 1.33 | 3.84 |
| LH | 78 | 1.67 | 0.88 | 1.37 | 2.40 |
Values in μg/m3
Table 6.
Percentage of EC in Total Carbon by Location
| Arithmetic | Geometric | ||||
|---|---|---|---|---|---|
| N | Mean | SD | Mean | SD | |
| Work Area | |||||
| Office | 112 | 4% | 0.04 | 3% | 3.10 |
| Yard Upwind (background) | 607 | 11% | 0.06 | 9% | 2.49 |
| Dock | 697 | 10% | 0.06 | 8% | 2.21 |
| Shop | 214 | 15% | 0.10 | 12% | 2.13 |
| Non-smokers | |||||
| On-site Workers | |||||
| Clerk | 15 | 3% | 0.03 | 1% | 10.19 |
| Dockworker | 342 | 6% | 0.04 | 5% | 1.96 |
| Mechanic | 101 | 14% | 0.13 | 10% | 2.71 |
| Hostler | 69 | 7% | 0.04 | 5% | 2.09 |
| Off-site Drivers | |||||
| P&D | 338 | 10% | 0.07 | 8% | 2.13 |
| LH | 117 | 7% | 0.04 | 7% | 1.82 |
Values in μg/m3
Figure 4.
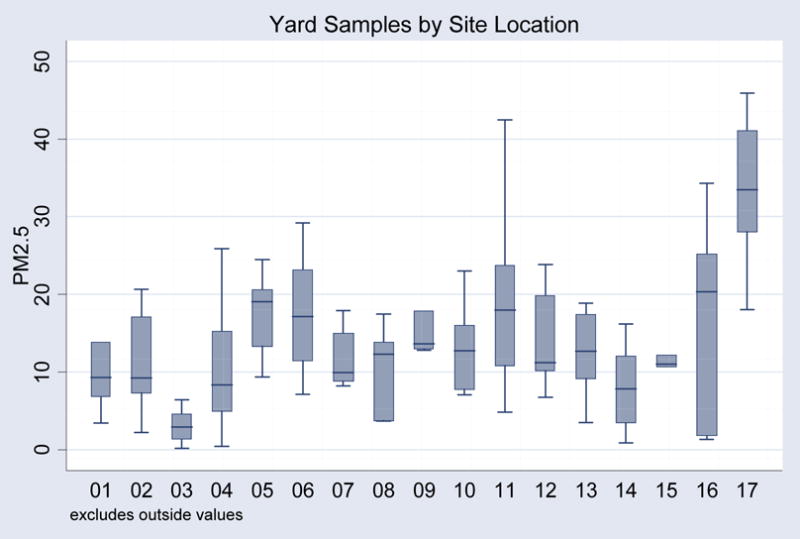
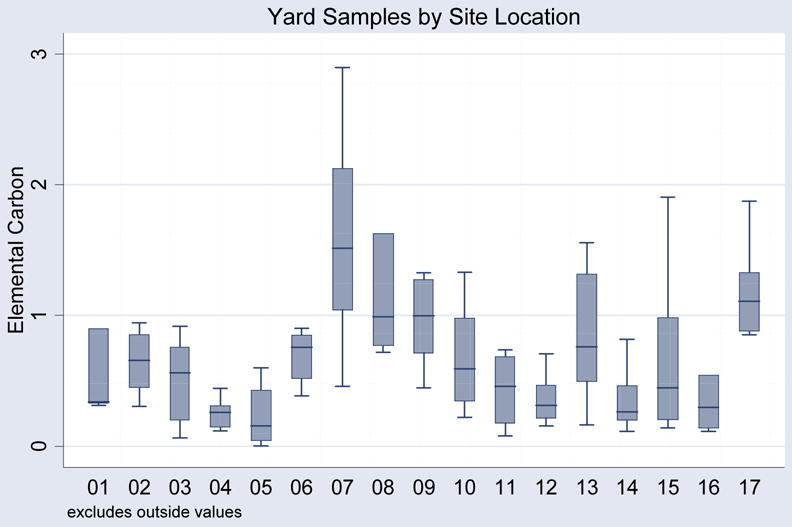
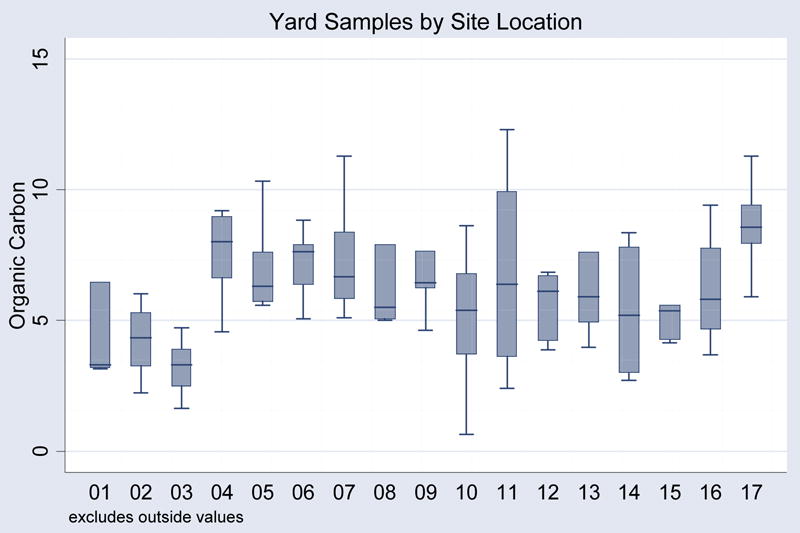
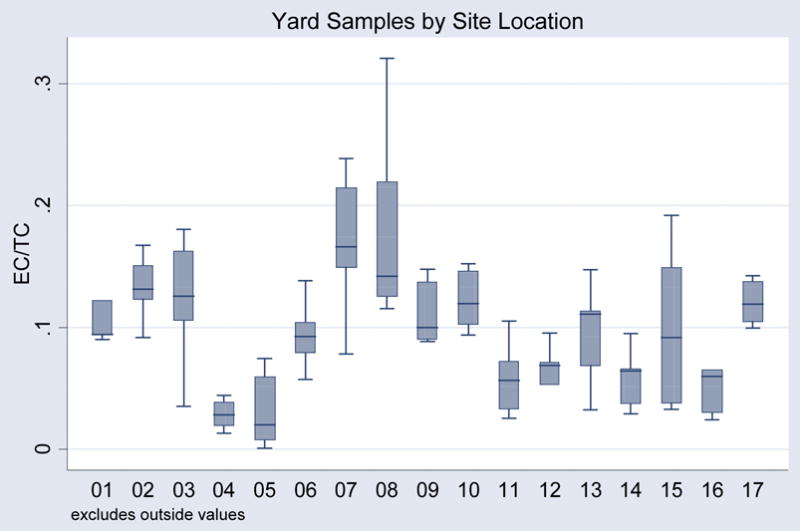
Figure 4A. Background Concentration Levels for PM 2.5
Figure 4B. Background Concentration Levels for EC
Figure 4C. Background Concentration Levels for OC
Figure 4D. Background Concentration Levels for EC/TC
Figure 5.
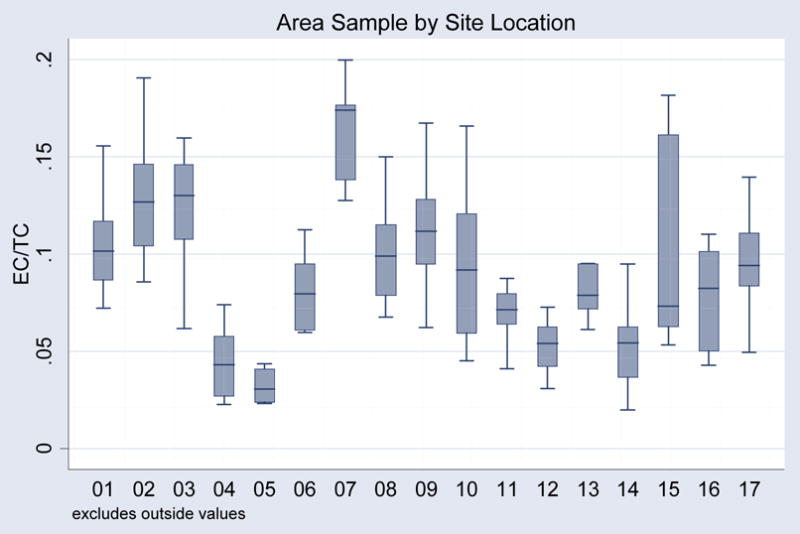
EC Fraction of Total Carbon for the Dock
All distributions, both personal and fixed location samples, were approximately lognormal – highly skewed toward large values. Log transformed data were an approximate fit to the ideal lognormal distribution, and these results can be viewed in Figure 3A and 3B. However, the distributions for broad groups tend to be over represented in the center. This is likely the result of these distributions being the sum of a variety of different individual distributions including different time points, terminals, locations and jobs. Due to the approximately lognormal distribution of particle concentrations, the geometric mean and standard deviation are presented along with the arithmetic calculations in all data summary tables. The discussion in the text refers to the geometric means unless otherwise noted, since these values are more representative of the central tendency in the exposure measurements.
Figure 3.
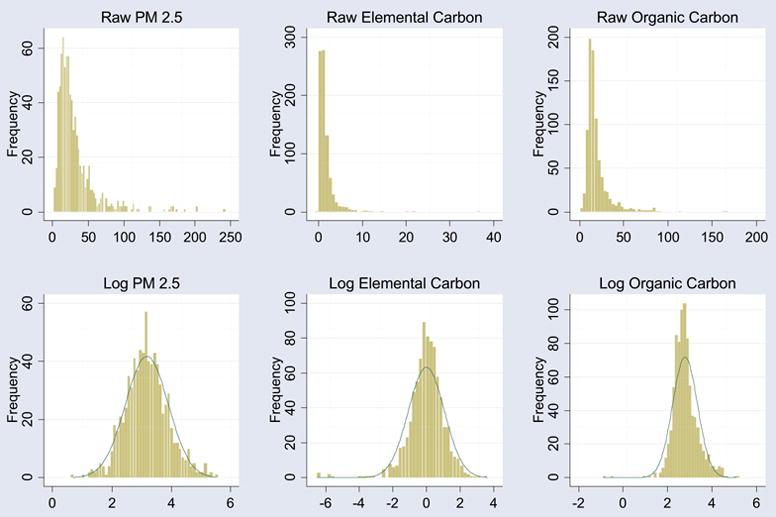
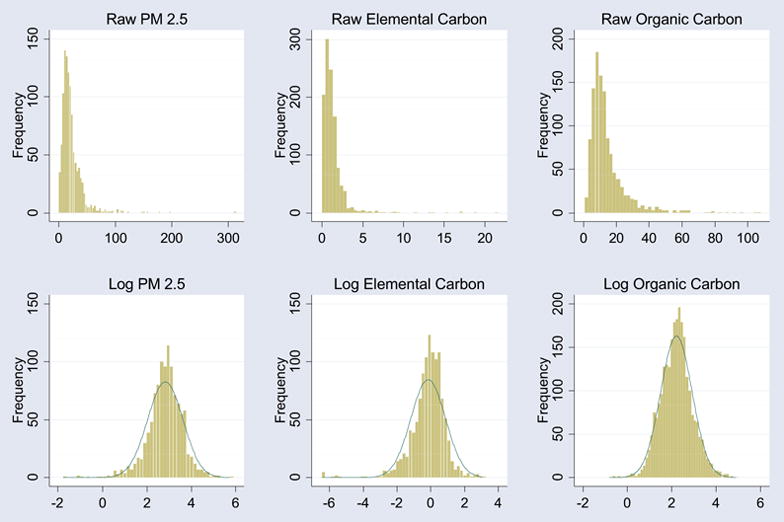
Figure 3A. Personal Sample Histograms (in μg/m3)
Figure 3B. Area Sample Histograms (in μg/m3)
The data were heteroskedastic (unequal variance) across subgroups, violating a basic assumption of the ANOVA model. This was easily seen by a graphical review of the boxplots (widely varying interquartile ranges), and was further reinforced by Bartlett’s test for equal variance. Since the data were both lognormal and heteroskedastic, nonparametric tests were used to compare the group distributions. In particular, the Wilcoxon rank sum (Mann-Whitney) test was used along with its multiple-group generalization, the Kruskal-Wallis test, for all of the comparisons summarized below (i.e., two group comparisons use the Mann-Whitney test, while multiple group comparisons use the Kruskal-Wallis test). Nonparametric spearman correlation coefficients were used to determine significant relationships between sample variables. Finally, although the measurements were taken over a consecutive 5-day period, the data are not highly correlated across time and autocorrelation does not present a problem in the current analysis.
Results
Terminal Site Background Levels
Background measurements were made in an upwind location in the yard for each terminal sampled. Proper placement of these samplers was a challenge. A small recording anemometer and wind vane were set up next to the yard sampler, and we attempted to place the sampler upwind of the terminal within about 45° of the prevailing wind. However, this was not always possible because of a lack of suitable sites. Further, as expected, the wind direction is rarely stable, and in several cases it was necessary to move the sampler to another location when a major weather system moved through the area. It was not feasible to move the upwind sampler during frequent minor wind shifts, ±45°. Many times at night when the wind speed dropped to light breezes, the wind direction wandered across the full range of the compass.
Figure 4A–4D shows box and whisker plots of background levels for PM2.5, EC, OC and EC per unit of total carbon (EC/TC) observed in the yard for the first 17 terminals visited during the study. The later trips showed similar variability and are excluded from the figures to facilitate visualization of the trends. There was significant variability (p<0.01) across the terminal sites, reflecting differences in settings (neighborhood sources and air pollution) and work activities at these terminals.
Terminal Site Work Locations Levels
The main indoor work locations that were evaluated with fixed location monitors included the dock, shop, and office areas (see Figure 1). Work location levels were compared to the upwind background concentrations to define the relative contributions of local sources and activities. There were statistically significant differences in particle concentrations across work locations (p<0.01), and summary statistics are provided in Tables 3-6. The relative ranking of exposures was usually office < yard < dock < shop for all three contaminants, and generally EC < OC < PM2.5. The office location had the lowest exposure levels (with the exception of OC), on average 60% less than those detected outside in the yard. The office particulate often had more OC than PM2.5, which is likely an artifact of cigarette smoke.
Dock area concentrations of all air components were 40–55% higher than upwind background values. These dock values represent a combination of background contaminants entering the dock, emissions from forklifts driven on the dock, and diesel emissions from truck tractors operating in the yard. Overall the correlation observed between the dock and upwind yard levels during the same shift were high: r = 0.73 for PM2.5, r = 0.86 for EC and r = 0.58 for OC.
Overall the geometric means of the EC/TC ratios across work locations (Table 6) show similarities for the upwind and dock areas, containing about 8% EC in TC. This is true even though the EC, TC, and PM2.5 are about a third higher in the dock area relative to the upwind background measurements. There were large differences in composition across the terminal sites reflected in variation in the EC/TC ratios for the dock (Figure 5). Significant differences in the ratios of EC/TC across sites were found (p<0.01), which ranged from 3% to 12% for these area samples. The matched background and dock EC/TC ratios were highly correlated, and a large fraction of the variance in the dock values was explained by the background levels (r=0.75).
The shop facilities, when present, were located in separate buildings. Engines are rarely operated while the tractor is indoors, but frequent movement of tractors into and out of the shop can release substantial emissions into the confined space of the shops. Shop area levels were the highest observed in the terminal, between 33–111% higher than the dock (Tables 3-5), and were more variable than the dock concentrations. Shops reporting the presence of local exhaust ventilation had somewhat lower average exposure levels, but the difference was not significant. The EC/TC ratio was significantly higher in the shop area (p<0.01), averaging 12%, which is consistent with brief, low rpm diesel emissions.
Table 5.
PM2.5 Summary Statistics by Location and Job
| Arithmetic | Geometric | ||||
|---|---|---|---|---|---|
| N | Mean | SD | Mean | SD | |
| Work Area | |||||
| Office | 111 | 8.45 | 12.36 | 6.01 | 2.42 |
| Yard Upwind (background) | 612 | 12.71 | 9.27 | 9.75 | 2.34 |
| Dock | 692 | 16.84 | 17.96 | 14.42 | 1.88 |
| Shop | 211 | 27.60 | 27.47 | 19.32 | 2.36 |
| Non-smokers | |||||
| On-site Workers | |||||
| Clerk | 12 | 7.19 | 5.23 | 5.96 | 1.86 |
| Dockworker | 307 | 21.84 | 13.86 | 18.73 | 1.75 |
| Mechanic | 97 | 40.82 | 37.26 | 31.07 | 2.04 |
| Hostler | 68 | 27.09 | 19.30 | 22.02 | 1.91 |
| Off-site Drivers | |||||
| P&D | 348 | 19.14 | 11.49 | 16.20 | 1.82 |
| LH | 160 | 25.39 | 19.07 | 19.26 | 2.30 |
| Smokers | |||||
| On-site Workers | |||||
| Clerk | 1 | 71.52 | - | - | - |
| Dockworker | 97 | 43.89 | 34.81 | 34.60 | 1.98 |
| Mechanic | 29 | 51.36 | 36.32 | 41.65 | 1.93 |
| Hostler | 21 | 95.48 | 117.90 | 59.51 | 2.59 |
| Off-site Drivers | |||||
| P&D | 105 | 55.83 | 78.01 | 36.52 | 2.36 |
| LH | 76 | 140.59 | 682.27 | 32.81 | 3.23 |
Values in μg/m3
Terminal Site Personal Levels
The four primary job groups with distinct work areas monitored by personal sampling jackets were clerks, dockworkers, hostlers, and mechanics (see Tables 3-6). All of the personal exposures for non-smokers in the terminal locations were higher than the relevant area measurements, and they followed the same sequence seen for the work areas: clerks < dockworkers = hostlers < mechanics, and EC < OC < PM2.5, except for the clerks. These differences were all statistically significant (p<0.01).
The relative amount of EC in TC was generally less in the personal samples compared to samples from the work areas (Table 6). There was a relatively high correlation between the average personal exposures and the matched area measurement by work location, especially for EC (dock r = 0.79, shop r = 0.81).
Cigarette smoking by freight terminal workers had a substantial effect on the personal levels of PM2.5 and OC (see Table 7). The average levels of both of these contaminants were approximately 75% higher for smoking dockworkers and 40% higher for mechanics. This effect increased to nearly three fold for the smoking hostlers, who spend a large fraction of their time in the cab of a yard tug where there is no restriction on their smoking activities. The EC levels were only somewhat higher for smoking dockworkers and mechanics, about 20–30%, which is consistent with the low content of EC measured in cigarette smoke.
Table 7.
Smoker to Non-smoker Ratios by Job
| EC | OC | PM 2.5 | |
|---|---|---|---|
| Clerk: GM ratio (S/NS) | 13.22 | 2.02 | - |
| Dockwoker: GM ratio (S/NS) | 1.29 | 1.73 | 1.85 |
| Mechanic: GM ratio (S/NS) | 1.21 | 1.44 | 1.34 |
| Hostler: GM ratio (S/NS) | 1.98 | 2.95 | 2.70 |
| LH: GM ratio (S/NS) | 1.22 | 1.70 | 1.70 |
| P&D: GM ratio (S/NS) | 1.22 | 1.95 | 2.25 |
Values in μg/m3
Comparison of Personal Exposures for Driver Jobs
The two main types of drivers included pick-up and delivery (P&D) and long haul (LH) (Tables 3-6) and their exposures were measured by area sampling boxes placed in the cab of their vehicles during their work shift. There were no significant differences for smoking drivers across the two groups, while there were significant differences (p<0.01) between non-smoking P&D and LH exposures for PM2.5 and OC. Comparing drivers to the onsite work groups for non-smokers, hostlers and mechanics had higher PM2.5, OC was similar across all of the worker groups, and only mechanics had higher EC exposures. Cigarette smoking also significantly increased driver’s PM2.5 and OC levels. Both were nearly two fold higher in smokers compared to nonsmokers. Similar to the terminal jobs, the EC was only slightly elevated, but still statistically significant (p<0.01).
Discussion
The purpose of this study is to define the differences in exposure to PM2.5, EC and OC that could be useful for examining contributions to risk in our epidemiologic study of lung cancer. Based on pilot data, we hypothesized broad differences in exposures by terminal site, work location, and job title. Since these features are easily determined for each subject based on his company work history, we are looking for systematic exposure differences linked with characteristics of terminal site and job title. We are also concerned with the effect of cigarette smoking both as a personal exposure modifier and as a systematic factor across work locations, jobs, and terminal sites.
One of the key attributes of a freight terminal is its surrounding area. A variety of settings was sampled, including rural, suburban, and industrial areas, which produced a wide range of background levels (Figures 4A–4C). These differences across sites were statistically significant (p < 0.01). This variation is important epidemiologically for distinguishing occupational exposure effects from those of background air pollution. In addition to differences in average exposure levels, significant differences in exposure composition were also seen across terminal sites. This was shown by the variation in the ratio of EC/TC (Figure 4D). Areas with higher ratios may reflect differences in the amounts of local diesel vehicle traffic around the terminal.
Our measured background levels of PM2.5, EC, and OC were much lower than those observed in other studies of urban areas with high levels of pollution. Lena and coworkers (2002) found that both PM2.5 and EC were correlated with density of truck traffic through an urban neighborhood in the Bronx in New York City, but EC had a higher correlation, r = 0.92, versus 0.72 for PM2.5 19. The nearby urban control site away from the road had an average EC of 2.6 μg/m3, whereas EC averaged 7.3 μg/m3 along the truck routes. Lena and coworkers (2002) also presented a summary of other studies of urban and suburban locations in the US and two German sites, which had maximum daily averages ranging from 1.2 to 16 μg/m3 for EC. Thus, although the freight terminals we studied were near road and highways, they were generally not in high pollution urban areas. Instead, they tended to be in suburban areas outside the city centers, where the background levels were lower.
The next research question was to define the levels and variation in PM2.5, EC, and OC across work locations within the truck terminals (Tables 3-5). Large significant differences were found for the concentrations of all three contaminants across the major work areas: shop, dock, and office. The dock levels were approximately 45% higher than the background upwind values, which was most likely due to forklift emissions on the dock (often 5–10 units operating simultaneously) and truck tractors driving in the yard. Although there are door openings for trailers on all of the freight docks, closures are rare allowing outdoor contaminants to enter. So while individual propane powered forklifts operating on the dock produce only a small amount of particulate exhaust, it is released into a semi-confined environment, and when there are more than two or three forklifts operating, they can produce elevated levels of particulate contaminants.
Although the magnitude of exposures was higher in the dock versus the upwind background, the EC/TC ratios for the two locations were very similar, 8–9%, and significantly correlated, indicating similar sources of air contaminants (Table 6). Even so, a large fraction of the variance in dock concentrations was not explained by the upwind variation, so there was a clear independent occupational exposure component in the study results. High background exposures can occur with low occupational exposures and visa versa, which is critical to distinguish the independent effects of both. The EC/TC ratio for the shop showed much more EC, 12%, than the other two areas. The primary engine operating pattern in the shop is characterized by brief accelerations to move the tractors in and out of the shop, and black smoke (high levels of EC) is frequently observed when tractors enter, possibly accounting for this difference. The EC/TC ratios were generally much less than those of pure diesel exhaust, ~50–60%, and somewhat lower than gasoline engine exhaust, 19–31% for catalyst equipped cars, which indicates dilution with emissions from other sources20, 21.
The office had clearly different conditions than the dock or shop areas. The offices were separate from the dock area and were generally air-conditioned/heated with no opening windows. For that reason, little of the outdoor or work area pollutants entered the office space. Many offices showed clear evidence of contamination by cigarette smoke, as indicated by low levels of EC and relatively high levels of OC. The OC values in the office frequently exceeded the PM2.5, which was not seen in the dock or shop areas. This is due to an artifact in sampling cigarette smoke with a quartz fiber filter, which adsorbs semi-volatile hydrocarbon vapors 17, 18.
A third research question was to determine how much of a terminal workers’ personal exposure was derived from the background and how much from his personal work activities in and around the terminal. This question needed to be answered in the context of cigarette smoking because smoking contaminants are another important factor in some of the personal samples. For this reason, we avoided sampling smokers when possible.
Our goal was to characterize the exposures to occupational and environmental particulate, which are indicated clearly with the nonsmoker samples. The nonsmoking hostlers, dockworkers, and mechanics had significantly elevated exposures relative to the levels in the yard and their respective work area samples (Tables 3-5). The large variation across terminal sites found in the upwind background samples was also apparent in the average personal measurements compared across sites.
One puzzling finding was lower EC/TC ratios for the personal samples of the dockworkers and mechanics relative to the work area samples (Table 6). The dockworkers and hostler samples also had less EC per TC than the upwind background samples, which indicates exposure to sources of emissions that were low in EC and relatively high in OC. Idling diesel engines produce low amounts of EC and high OC, and the EC/TC ratio can be as low as 4%. Also the forklift trucks produce very little EC and OC. Analysis of available high volume source apportionment samples will help us resolve this question (reported elsewhere).
The nonsmoking pickup and delivery (P&D) and long haul (LH) drivers had very similar PM2.5, EC, and OC exposures. They had an EC/TC ratio of 6–7%, which was similar to the dockworkers and hostlers, but very low relative to both car and heavy duty truck emissions. Geometric mean (GM[GSD]) measurement of in-vehicle concentrations of black carbon (BC) were 1.3[4.5] μg/m3 in Los Angeles on urban arterial roads and 4.4[2.6] on freeways, and in Sacramento BC was 0.56[3.5] μg/m3 on urban arterial roads and 3.8[2.4] on freeways 22. P&D drivers had a small but significantly higher EC exposure than other drivers, which was overall comparable with the BC exposures on Sacramento freeways. This would also affect the exposures assigned to the workers in the combination job (both drive and work on the dock). Driver exposures were generally higher than the background levels at the terminal where they were assigned, but driver values were not well correlated with local background levels near the terminal where they were based. This is consistent with the fact that the drivers spend little time at the terminal and the broad area they travel, approximately a 50 km radius around the terminal, is not just the local area.
Contrasting samples from smoking and nonsmoking workers showed the strong, statistically significant influence of cigarette smoke (Table 7). Hostlers showed a much bigger smoking effect on PM2.5 and OC than the other terminal jobs, probably because hostlers are free to smoke while working and the cab of the Yard Tug is smaller than a regular truck cab. Drivers had exposure increases from cigarette particles similar to the dockworkers. These exposure data indicate substantial secondhand smoke (SHS) exposures in addition to the mainstream smoke they inhale.
These results are being analyzed in the context of a formal statistical model describing occupational exposures as a function of background, work area, and personal exposures. This work has provided further evidence that exposures to particulates at terminal locations are dependent on many important factors, including work area and background concentrations, weather conditions, terminal characteristics, ventilation, local sources, and regional characteristics. The final step will be to develop a historical exposure assignment matrix for the epidemiologic study. We will use the statistical model we are developing for current exposures, modified with historical exposure factors, as the basis for back extrapolating past exposures.
Conclusions
We are performing this exposure assessment for an epidemiologic study that needs to clearly differentiate particle exposures from different sources and link them with characteristics identifiable for each of the 55,000 subjects in our cohort from the trucking industry. These characteristics can be determined from personal work histories and company terminal and equipment data, such as job title, terminal size and location, age and type of trucks in the fleet. This report on measurements from 36 regionally sited truck freight terminals has shown significant differences across terminal sites, work locations, and job titles.
It has also shown that cigarette smoking contributes to personal exposures, but does not alter the gradient of exposures across jobs. Large differences were seen across the terminal sites because of differences in local regional air pollution emissions and terminal specific activities. Aside from large, nearby industrial sources, there was little evidence that specific upwind sources were important. We conclude that we will be able to estimate current exposures of the cohort with an exposure assignment matrix based on job title, work location, and terminal site that will identify a wide range of exposures, which overlaps substantially with the general public’s exposure to these sources.
Table 4.
OC Summary Statistics by Location and Job
| Arithmetic | Geometric | ||||
|---|---|---|---|---|---|
| N | Mean | SD | Mean | SD | |
| Work Area | |||||
| Office | 112 | 11.88 | 8.42 | 11.29 | 1.63 |
| Yard Upwind (background) | 607 | 5.85 | 6.22 | 5.01 | 1.76 |
| Dock | 697 | 8.15 | 4.18 | 7.77 | 1.65 |
| Shop | 214 | 13.02 | 9.58 | 10.37 | 2.00 |
| Non-smokers | |||||
| On-site Workers | |||||
| Clerk | 15 | 16.52 | 4.38 | 15.97 | 1.31 |
| Dockworker | 342 | 14.98 | 6.89 | 13.89 | 1.45 |
| Mechanic | 101 | 19.43 | 13.94 | 16.89 | 1.64 |
| Hostler | 69 | 16.87 | 7.10 | 14.89 | 1.86 |
| Off-site Drivers | |||||
| P&D | 366 | 13.59 | 6.30 | 12.40 | 1.54 |
| LH | 160 | 25.39 | 19.07 | 19.26 | 2.30 |
| Smokers | |||||
| On-site Workers | |||||
| Clerk | 2 | 34.52 | 17.44 | 32.25 | 1.70 |
| Dockworker | 101 | 29.87 | 23.95 | 24.02 | 1.87 |
| Mechanic | 28 | 28.42 | 16.69 | 24.35 | 1.78 |
| Hostler | 21 | 58.91 | 61.26 | 43.92 | 2.03 |
| Off-site Drivers | |||||
| P&D | 112 | 33.53 | 35.41 | 24.24 | 2.14 |
| LH | 76 | 140.59 | 682.27 | 32.81 | 3.23 |
Values in μg/m3
Acknowledgments
This work was supported by NIH/NCI R01 CA90792 and HEI 4705-RFA03-1/04-1. We wish to gratefully acknowledge the contributions of the participating companies and workers represented by the International Brotherhood of Teamsters.
Abbreviations
- AQS
Air Quality System
- EC
Elemental Carbon
- EPA
Environmental Protection Agency
- GM
Geometric Mean
- GSD
Geometric Standard Deviation
- LH
Long-Haul
- NOAA
National Oceanographic and Atmospheric Administration
- OC
Organic Carbon
- P&D
Pick-up and Delivery
- PM1
PM less than 1 microns
- PM2.5
PM less than 2.5 microns
- SHS
Secondhand Smoke
- TC
Total Carbon
References
- 1.Bhatia R, Lopipero P, Smith AH. Epidemiology. 1998;9:84–91. [PubMed] [Google Scholar]
- 2.Lipsett M, Campleman S. Am J Public Health. 1999;89:1009–1017. doi: 10.2105/ajph.89.7.1009. [DOI] [PMC free article] [PubMed] [Google Scholar]
- 3.Office of Research and Development. HEALTH ASSESSMENT DOCUMENT FOR DIESEL ENGINE EXHAUST. USEPA EPA/600/8-90/057F, National Center for Environmental Assessment, U.S. Environmental Protection Agency; Washington, DC: 2002. [Google Scholar]
- 4.Office of Environmental Health Hazard Assessment. Health Risk Assessment for Diesel Exhaust. California Environmental Protection Agency; Sacramento, CA: 1998. [Google Scholar]
- 5.Diesel Working Group. Diesel exhaust: A critical analysis of emissions, exposure, and health effects. Special Report, Health Effects Institute; Cambridge, MA: 1995. [Google Scholar]
- 6.IARC. Diesel and gasoline engine exhausts and some nitroarenes. Vol. 46. IARC; Lyon: 1989. Monographs on the Evaluation of Carcinogenic Risks to Humans. [PMC free article] [PubMed] [Google Scholar]
- 7.World Health Organization. Diesel fuel and exhaust emissions. World Health Organization; Geneva, Switzerland: 1996. [Google Scholar]
- 8.NIOSH. Carcinogenic effects of exposure to diesel exhaust. Current Intelligence Bulletin 50, U.S. Department of Health and Human Services; 1988. [Google Scholar]
- 9.Stayner L, Bailer AJ, Smith R, Gilbert S, Rice F, Kuempel E. Ann N Y Acad Sci. 1999;895:212–222. doi: 10.1111/j.1749-6632.1999.tb08087.x. [DOI] [PubMed] [Google Scholar]
- 10.Zaebst DD, Clapp DE, Blade LM, Marlow DA, Steenland K, Hornung RW, Scheutzle D, Butler J. Am Ind Hyg Assoc J. 1991;52:529–541. doi: 10.1080/15298669191365162. [DOI] [PubMed] [Google Scholar]
- 11.Groves J, Cain JR. Ann Occup Hyg. 2000;44:435–447. [PubMed] [Google Scholar]
- 12.Sauvain JJ, Vu Duc T, Guillemin M. Int Arch Occup Environ Health. 2003;76:443–455. doi: 10.1007/s00420-003-0439-4. [DOI] [PubMed] [Google Scholar]
- 13.Garshick E, Smith TJ, Laden F. Research Directions for Improve Estimates of Human Exposure and Risk from Diesel Exhaust. Editon. Diesel Epidemiology Working Group, Health Effects Institute; Boston, MA: 2002. [Google Scholar]
- 14.Yanosky J, MacIntosh D. J Air and Waste Management Assoc. 2001;52:878–884. doi: 10.1080/10473289.2001.10464320. [DOI] [PubMed] [Google Scholar]
- 15.Tainio M, Tuomisto JT, Hanninen O, Aarnio P, Koistinen KJ, Jantunen MJ, Pekkanen J. Risk Anal. 2005;25:151–160. doi: 10.1111/j.0272-4332.2005.00574.x. [DOI] [PubMed] [Google Scholar]
- 16.Cassinelli ME, O'Connor PF, editors. NIOSH. NIOSH Manual of Analytical Methods. Editon edn. NIOSH; 1998. [Google Scholar]
- 17.Olson DA, Norris GA. Atmospheric Environment. 2005;39:5437–5445. [Google Scholar]
- 18.Turpin BJ, Huntzicker JJ, Hering SV. Atmospheric Environment. 1994;28:3061–3071. [Google Scholar]
- 19.Lena TS, Ocheing V, Carter M, Holguin-Veras J, Kinney PL. Environ Health Perspect. 2002;110:1009–1015. doi: 10.1289/ehp.021101009. [DOI] [PMC free article] [PubMed] [Google Scholar]
- 20.Schauer JJ. J Expo Anal Environ Epidemiol. 2003;13:443–453. doi: 10.1038/sj.jea.7500298. [DOI] [PubMed] [Google Scholar]
- 21.Schauer JJ, Kleeman MJ, Cass GR, Simoneit BR. Environ Sci Technol. 2002;36:1169–1180. doi: 10.1021/es0108077. [DOI] [PubMed] [Google Scholar]
- 22.Fruin SA, Winer AM, Rodes CE. Atmospheric Environment. 2004;38:4123–4133. [Google Scholar]


