Abstract
Rationale: Allergically inflamed mice exhibit airway hyperresponsiveness to inhaled methacholine, which computer simulations of lung impedance suggest is due to enhanced lung derecruitment and which we sought to verify in the present study.
Methods: BALB/c mice were sensitized and challenged with ovalbumin to induce allergic inflammation; the control mice were sensitized but received no challenge. The mice were then challenged with inhaled methacholine and respiratory system impedance tracked for the following 10 minutes. Respiratory elastance (H) was estimated from each impedance measurement. One group of mice was ventilated with 100% O2 during this procedure and another group was ventilated with air. After the procedure, the mice were killed and ventilated with pure N2, after which the trachea was tied off and the lungs were imaged with micro-computed tomography (micro-CT).
Results: H was significantly higher in allergic mice than in control animals after methacholine challenge. The ratio of H at the end of the measurement period between allergic and nonallergic mice ventilated with O2 was 1.36, indicating substantial derecruitment in the allergic animals. The ratio between lung volumes determined by micro-CT in the control and the allergic mice was also 1.36, indicative of a corresponding volume loss due to absorption atelectasis. Micro-CT images and histograms of Hounsfield units from the lungs also showed increased volume loss in the allergic mice compared with control animals after methacholine challenge.
Conclusions: These results support the conclusion that airway closure is a major component of hyperresponsiveness in allergically inflamed mice.
Keywords: asthma, micro-computed tomography, input impedance, lung derecruitment, lung volume
AT A GLANCE COMMENTARY
Scientific Knowledge on the Subject
Airway hyperresponsiveness in mouse models of asthma has traditionally been attributed to contraction of airway smooth muscle. Recent studies suggest, however, that airway closure may play a more significant role.
What This Study Adds to the Field
Using the forced oscillation technique and micro-computed tomography, we now show that airway hyperresponsiveness in allergic mice can be largely explained by airway closure.
Different mechanisms can lead to airway hyperresponsiveness (AHR) in animal models, not all of which have equal relevance to human asthma. It is therefore crucial to elucidate the mechanistic basis of AHR in any given animal model of asthma to understand its relationship to the human condition. We recently reported that the response of acutely allergically inflamed BALB/c mice to challenge with methacholine aerosol is likely due entirely to enhanced closure of peripheral airways secondary to increased airway mucosal thickness and secretions (1). This stands in marked contrast to the widely held view that AHR in asthma is the result of exaggerated shortening of airway smooth muscle. However, our interpretation that methacholine inhalation caused enhanced airway closure in these mice was derived on the basis of simulation results obtained with a computational model of the mouse lung, and thus remains inferential. Further verification is needed to place the role of lung derecruitment in animal models of AHR on a firm footing, especially in view of the continuing controversy about which mechanisms are most responsible for AHR in human asthma (2–5).
The goal of the present study was to obtain experimental verification of the role of small airway closure in the allergically inflamed BALB/c mouse. Our approach was to exploit the phenomenon of absorption atelectasis. Specifically, we hypothesized that if derecruitment of lung units occurs during bronchoconstriction via closure of small airways, then prior ventilation of the lung with pure oxygen should lead to post-challenge collapse of the derecruited units due to absorption of the trapped oxygen by the capillary blood. In the present study, we used micro-computed tomography (micro-CT) to quantify the degree of absorption atelectasis induced by bronchial challenge in allergically inflamed versus control BALB/c mice ventilated with both air and pure oxygen. Some of the results of these studies have been previously reported in the form of an abstract (6).
METHODS
The techniques and methods outlined below are described in greater detail in the online supplement.
Animal Preparation
Female BALB/c mice, 6 to 8 weeks old, were sensitized on Days 0 and 14 with intraperitoneal injections of ovalbumin (Ova) and then exposed to inhalational challenges with Ova or control saline as previously described (Days 21, 22, and 23) (7). On Day 25, the mice were anesthetized and connected to a small animal ventilator (FlexiVent; SCIREQ Scientific Respiratory Equipment, Inc., Montreal, PQ, Canada) and paralyzed with pancuronium as previously described (8). The depth of anesthesia was monitored by electrocardiogram (ECG).
Experimental Groups
We studied four groups of mice (n = 5/group). The first group was challenged with inhaled Ova and ventilated with 100% O2 (Inflamed-O2). The second group was exposed to control saline inhalation and ventilated with 100% O2 (Control-O2). The third group was similar to the Inflamed-O2 group but was ventilated with room air (Inflamed-Air). The fourth group was similar to the Control-O2 group but was ventilated with room air (Control-Air). The theory of absorption atelectasis is explained in Figure E1 in the online supplement.
Experimental Protocol
After 1 minute of regular ventilation at a positive end-expiratory pressure (PEEP) of 3 cm H2O, a standard lung volume history was established by delivering two deep sighs to a pressure limit of 25 cm H2O. Next, two baseline measurements of respiratory system input impedance (Zrs) were obtained. This was followed by an inhalation of either aerosolized methacholine (12.5 mg/ml) or control saline for 40 seconds, achieved by directing the inspiratory flow from the ventilator through the aerosolization chamber of an ultrasonic nebulizer. Zrs was then measured every 10 seconds for 3 minutes, and thereafter every minute for 7 minutes. At the end of the experiment, the mouse was given an overdose of sodium pentobarbital and immediately ventilated with 100% N2 for approximately 3 minutes. When death had been confirmed by ECG, the trachea was tied off after exhalation against a PEEP of 3 cm H2O and the cannula was removed. We then waited 45 to 60 minutes for the mouse to stiffen to prevent motion artifacts during subsequent imaging by micro-CT. The lungs were then removed and scored histologically for degree of inflammation.
Determination of Input Impedance
Measurements of Zrs were fit with the constant-phase model of impedance (9). One of the parameters of this model, H, provides a measure of the elastance of the respiratory system, RN measures the resistance of the conducting airways, and G represents tissue resistance.
Micro-CT
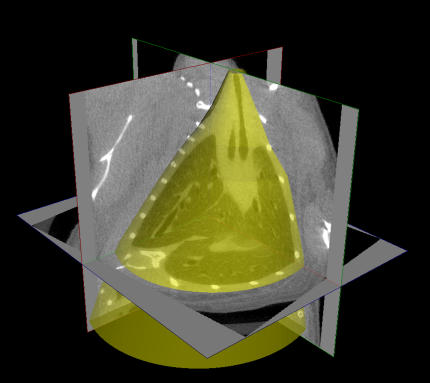
Lung volume (Vtg) was calculated by defining a region of interest encapsulating the entire lung within the three-dimensional micro-CT image of the mouse (Figure 1), and then summing the total volume occupied by gas in all the voxels within this region. Maximum intensity projections (MIPs) of intensity-inverted images were constructed to allow visualization of ventilated airways and lung regions. Hounsfield unit (HU) histograms were generated for the voxels contained within the region of interest, and the HU values at the peaks of the histograms (HUmax) were identified.
Figure 1.
The generation of regions of interest (ROIs) from micro-computed tomography images. Two-dimensional ROIs (2D ROIs) were created on approximately 10 cross-sectional images selected from a range of slices between the middle of the trachea and the base of the lungs. The 2D ROIs were defined by freehand contours drawn to closely surround the lungs and trachea so that all extrathoracic gas (e.g., bowel gas immediately below the diaphragm and ambient air outside the body) was excluded. 2D ROIs were then automatically created for all cross-sections by linear interpolation between the manually drawn contours, and 3D ROIs (in yellow) were subsequently generated by stacking each set of 2D regions. Frequency histograms of Hounsfield units were calculated for the voxels contained within each 3D ROI.
Statistics
Data are presented as means ± SEM. H data were compared using two-way analysis of variance. HUmax values and Vtg were compared between the two groups of mice using Student's t test. Wilcoxon's rank sum test was used to compare histologic scores. Origin 7.5 (OriginLab Corp, Northampton, MA) and Minitab (Minitab, Inc., State College, PA) were used for the analysis, and statistical significance was taken at p < 0.05.
RESULTS
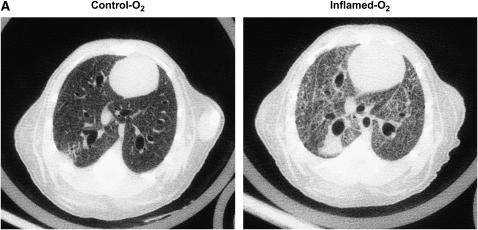
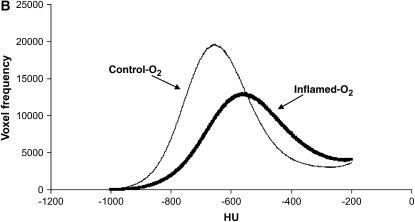
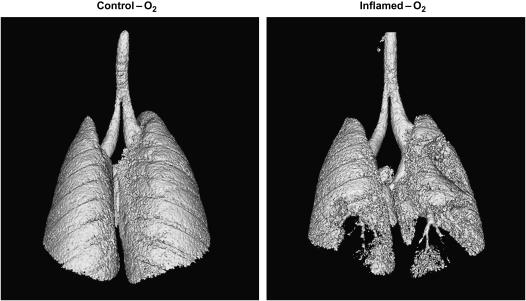
Figure 2A shows a representative micro-CT image of the lungs in one animal from the Control-O2 group and in another animal from the Inflamed-O2 group. The Control-O2 image reveals large and small airways with adjacent blood vessels. Interlobar pleural septae are visible as well as dark-gray lung parenchyma with fine reticulations and reticunodular opacities. In the Inflamed-O2 image, on the other hand, large areas appear to be atelectatic and the lungs are generally denser than the Control-O2 lungs. The differences in lung densities are also apparent in the HU histograms (Figure 2B) where the histogram for the Inflamed-O2 lung is shifted right and HUmax is significantly higher (p < 0.01) compared with the Control-O2 lung.
Figure 2.
(A) Representative micro-computed tomography images from a Control-O2 mouse (left panel) and an Inflamed-O2 mouse (right panel). (B) Mean frequency histogram of voxels having a particular Hounsfield unit (HU). HUmax from the inflamed mice (thick line) was significantly greater than that of the control animals (thin line) (p = 0.0038).
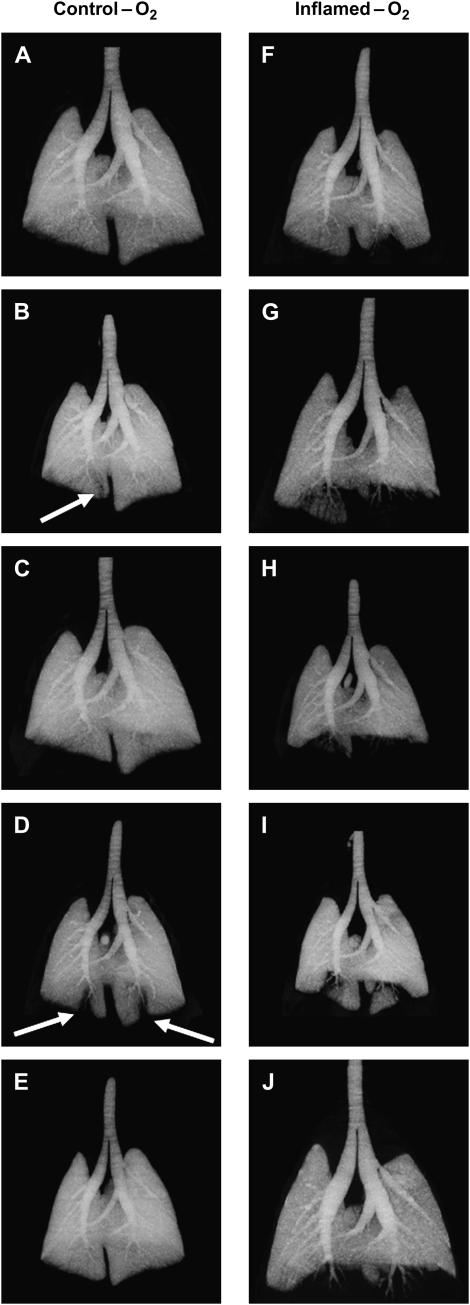
Figure 3 shows MIP images from each animal in the Control-O2 and Inflamed-O2 groups. Dark patches indicate regions of high X-ray density, whereas light patches are less dense and represent gas-filled regions. The control lung images are generally uniform, with only two mice showing minor areas of peripheral attenuation indicative of closure (see arrows in Figures 3B and 3D). By contrast, the inflamed lungs all show significant patches of attenuation in the periphery, typically in the lower dorsal (i.e., dependent) lung regions (Figures 3F–3J). These differences are also visible in the representative iso-surface renderings shown in Figure 4, where the lungs, viewed from the dorsal side, appear smooth and gas filled in the Control-O2 mouse, whereas in the Inflamed-O2 mouse the lack of gas in peripheral regions exposes airways that otherwise would be obscured by gas-filled parenchyma.
Figure 3.
Maximum intensity projection images from Control-O2 mice (left panel) and Inflamed-O2 mice (right panel). Arrows show areas of atelectasis in Control-O2 mice.
Figure 4.
Representative iso-surface renderings of lungs from a Control-O2 mouse (A) and an Inflamed-O2 mouse (B). The lungs are visualized from the dorsal side.
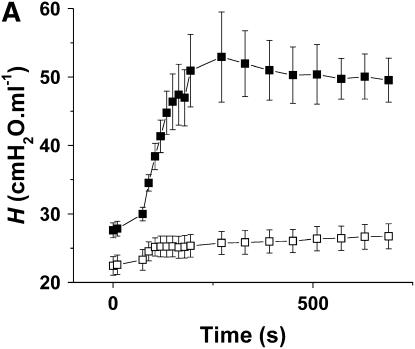
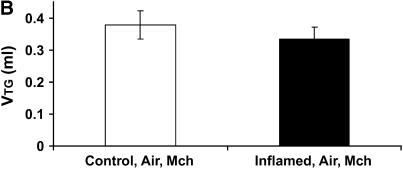
Figure 5A shows the time courses of H for the Control-Air and Inflamed-Air groups. After methacholine inhalation, the Inflamed-Air animals exhibited a rapid increase in H up to a plateau at about 3 minutes, significantly different (p < 0.001) from the Control-Air group. RN and G also responded significantly more (p < 0.001) in the Inflamed-air group compared with the Control-Air group (Figures E2 and E3). The ratio of H at the last time point between the Inflamed-Air group and the Control-Air group was 1.88. Figure 5B shows the corresponding Vtg. The ratio of Vtg between the Control-Air group and the Inflamed-Air group was 1.13, but this was not significantly different from 1.0.
Figure 5.
(A) Mean values of repiratory elastance (H) versus time for the Inflamed-Air mice (n = 5, solid symbols) and Control-Air mice (n = 5, open symbols). H that reflects tissue stiffness was determined from measurements of respiratory input impedance (Zrs). Two consecutive deep inflations (pressure limit, 25 cm H2O) were delivered before the first two measurements of H. Methacholine was then delivered as 20 slow deep breaths over 40 seconds. H was significantly elevated in the Inflamed-Air mice versus Control-Air mice (p < 0.001). (B) Lung volume (Vtg) values were determined post mortem from micro-computed tomography scans. There was no significant difference between Vtg measured in Inflamed-Air mice and Control-Air mice challenged with methacholine. Error bars indicate SEM. All measurements were obtained at positive end-expiratory pressure of 3 cm H2O.
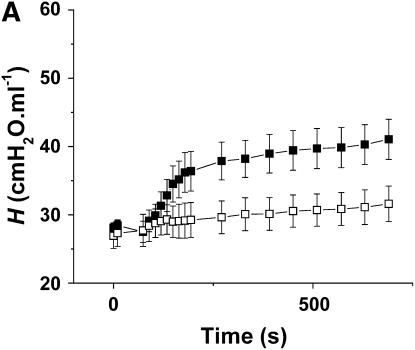
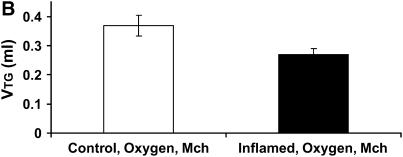
Figure 6A shows the time courses of H in the Control-O2 and Inflamed-O2 groups. Similar to the air-ventilated mice in Figure 5, the Inflamed-O2 animals exhibited a rapid increase in H after methacholine inhalation, reaching a plateau at about 3 minutes that was significantly different (p < 0.001) from the Control-O2 group. RN and G also increased significantly more (p < 0.05) in the Inflamed-O2 group than in the Control-Air group (Figures E2 and E3). The ratio of H, obtained at the last time point, between the Inflamed-O2 group and the Control-O2 group was 1.36 (p < 0.05). Figure 6B shows the corresponding Vtg. In contrast to the air-ventilated mice, Vtg was significantly different between the Control-O2 group and the Inflamed-O2 group (p < 0.05), with a ratio of 1.36 that was identical to the ratio of H between the two groups at the last time point.
Figure 6.
(A) Mean values of H versus time for the Inflamed-O2 mice (n = 5, solid symbols) and Control-O2 mice (n = 5, open symbols). H was significantly elevated in the Inflamed-O2 mice over the Control-O2 mice (p < 0.001). (B) Vtg was determined post mortem from micro-computed tomography scans. Inflamed-O2 mice challenged with methacholine had significantly lower lung volumes (p < 0.05) than Control-O2 mice. Error bars indicate SEM. All measurements were obtained at a positive end-expiratory pressure of 3 cm H2O.
The inflammatory status of the animals was confirmed within the control and inflamed groups by histologic scoring of lung slices stained with hematoxylin–eosin. The mean scores were Control-Air 1.08 (± 0.35) versus Control-O2 1.00 (± 0.32) (not significant), and Inflamed-Air 2.00 (± 0.18) versus Inflamed-O2 2.28 (± 0.17) (not significant). The Inflamed animals received significantly higher scores than the Control animals (p < 0.01).
DISCUSSION
We performed the present study to test our hypothesis that the exaggerated response to inhaled methacholine in allergic mice can be explained by accentuated airway closure (1). To achieve this goal, we took advantage of the phenomenon of absorption atelectasis, which occurs when O2 is trapped behind a closed airway and becomes absorbed by the pulmonary capillary blood, resulting in collapse of the subtended lung region. The gas in the remaining lung can then be visualized by micro-CT and quantified to provide a measure of the volume of open lung. In support of this notion, the images we obtained post-bronchoconstriction in Inflamed-O2 mice clearly show large regions of the lungs to be devoid of gas. In particular, the basal regions of the images in Figures 3F–3J and Figure 4B have a patchy appearance. The inflamed lungs also had a significant increase in mean density compared with control lungs (Figure 2B). Furthermore, H changed in inverse proportion to Vtg in the O2 groups (Figure 6A), which is precisely what we would predict if the change in H were due entirely to alveolar collapse (1). By contrast, Vtg did not change significantly in the mice ventilated with air despite a large elevation in H (Figure 5A). This indicates that, although air was still trapped behind closed airways in air-ventilated animals, it was not absorbed to nearly the same degree as when the lungs were filled with O2. These results thus support, both qualitatively and quantitatively, our previously advanced hypothesis (1) that AHR in inflamed BALB/c mice can be attributed to an increased propensity for closure of small airways in the lung.
Airway closure during bronchoconstriction in our mice was not, however, an entirely random event. The micro-CT MIP images in Figure 3 and the iso-surface rendering in Figure 4B show the dominant anatomic location of closure in our allergic mouse model of AHR to be at the dorsal base of the lung. This region was also the dependent part of the lung because the animals were studied supine, which raises the possibility that gravity could have played a role in our observations. Certainly, humans with asthma during bronchoconstriction exhibit poorer ventilation in dependent lung regions (10, 11). On the other hand, it is perhaps doubtful that gravity could have a significant effect in a lung as small as that of the mouse. Another possible explanation for the location of closure relates to deposition of inhaled bronchial agonist. The airways of the mouse are extremely heterogeneous and are dominated by large central airways that track far into the base of each lung, as can be seen in Figures 3 and 4B. This might favor deposition of methacholine into the basal regions, eliciting a stronger degree of local bronchoconstriction and thereby leading to more closure than in other lung regions. In support of this idea is the fact that the areas of atelectasis in the control mice (Figures 3B and 3D) were also located in the dorsal base of the lungs. On the other hand, we have previously found that closure occurs preferentially in the base of the lung in unconstricted mice ventilated with pure O2 at a PEEP of 2 cm H2O (6), suggesting that the base is the preferred location for closure regardless of whether methacholine is inhaled or not. Also, similar closure patterns have been noted in challenged excised rat lungs that were not studied in the supine position (12), further suggesting that the pattern of methacholine aerosol delivery did not play a significant role in the geographic pattern of closure we found in the present study.
The results of the present study are thus consistent with the conclusions of our previous study (1) that AHR in allergically inflamed mice results from a physically thickened mucosa. For purely geometric reasons, this allows for excessive narrowing of the airway lumen, with some airways proceeding to full closure even when the degree of airway smooth muscle shortening is normal. Closure is also likely exacerbated in allergic inflammation by disruption of surfactant function, possibly due to fibrin deposition (13), which would increase the propensity for liquid bridges to form across the lumen of small airways (14).
The supportive evidence arising from the present study is based on the supposition that the O2 we delivered to the lungs of the mice acted only in the manner we intended. That is, we assumed that the only effect of the O2 was to be passively absorbed by the pulmonary capillary blood, causing collapse of lung regions isolated behind points of airway closure. We cannot discount the possibility, however, that the rapid absorption of O2 may have affected the pattern of airway closure in some way, perhaps by quickly closing some airways which might then have hindered the closure of other nearby airways via the forces of airway–parenchymal intercependence. Also, we must bear in mind that pure O2 is biologically active and has been associated with damaging effects in the lung. For example, hyperoxia over an extended period of time has been shown to cause inflammatory changes and to possibly increase airway smooth muscle force in vitro in newborn rats (15). On the other hand, H has been shown not to change in mice over 24 hours of hyperoxia (16), and short-term hyperoxia does not seem to affect the bronchial response to methacholine in humans (17, 18). This would seem to suggest that there were no significant biological effects arising from the short time (∼ 10 min) that the animals in the present study were exposed to hyperoxia.
Nevertheless, pure O2 did exert a curious and unexpected influence on our results. Figures 5A and 6A show that the degree of airway closure elicited in the allergically inflamed mice was greater when the animals were ventilated with air than when their lungs were filled with pure O2. It is difficult to imagine that this could reflect differences in methacholine delivery due to differences in the physical properties of the carrier gas, because air is only about 6% denser than pure O2. The differences in the H response seen in Figures 5A and 6A were therefore likely due to a biological effect. One such possibility is that O2 could have altered responsiveness through its effects on perfusion (19), as it has been suggested (20) that the major clearance mechanism of an inhaled agonist is removal by the local circulation. Thus, if O2 reduced the degree of hypoxemia expected to occur with bronchoconstriction, this could have prevented the reduction in pulmonary blood flow that would normally occur (21). This would, in turn, have increased the clearance of methacholine and so reduced its accumulation around the airway smooth muscle over the 40-second delivery period we used in the present study. O2 may also have caused the release of a pharmacodynamically active substance such as NO, which is a well-known smooth muscle relaxant factor (22). For example, it has been shown in sheep that ventilating the lungs with pure O2 leads to release of NO, possibly from the epithelium, in quantities large enough to affect smooth muscle contractility in the adjoining pulmonary vasculature (23). In any case, the differences in responsiveness we found when ventilating with pure O2 versus air mean that we cannot compare values of H and Vtg between the groups ventilated with the different gases.
Our finding of the preeminent role of airway closure as one mechanism for AHR in allergic mice raises the question of how relevant airway closure is to the AHR of human asthma. In fact, there is substantial evidence to support the importance of closure in humans. Positron emission tomography has revealed that bronchoconstricted patients with asthma have large ventilation defects in their lungs that, in some cases, receive less than 0.5% of the mean lung ventilation (24). Single-photon emission CT with inhaled Technegas has shown that, even though airway closure appears to be a normal feature in a healthy lung, the pattern by which closure occurs is altered in subjects with asthma (11). It has also recently been shown that humans with asthma challenged with methacholine have clusters of underventilated alveoli adjacent to normally ventilated areas, and that this pattern can be understood in terms of self-organized clusters of small airway closures (10). Similarly, a correlation has been reported between the amount of air trapped in the lungs and the reversibility of small airway constriction (25), again suggesting that it is the small airways that close during bronchoconstriction in human lungs. Thus, there is strong evidence to suggest that enhanced airway closure is a significant feature of the allergically inflamed lung in mice and humans alike. From a therapeutic point of view, the potential for pure O2 to lead to absorption atelectasis suggests that O2 administration to individuals in status asthmaticus, a common practice in the emergency room, might worsen existing lung collapse. On the other hand, patients presenting in acute distress have presumably already experienced their major bronchoconstrictive episode so, provided further bronchospasm and airway closure is not forthcoming, filling the accessible portions of the lung with O2 may not be problematic.
We must consider the methodologic limitations of our study. One key point is that the impedance parameter H gives a functional measure of the stiffness of the lung, yet we used it to infer the extent of lung derecruitment. This is only valid if the intrinsic mechanical properties of the tissues do not change significantly with the interventions we applied. We cannot rule this out, particularly because the tissue distortion induced by narrowing of airways has been shown in other species to cause a change in intrinsic tissue stiffness (26, 27). On the other hand, these effects appear to be minimal in the rat (28). The lack of bronchial circulation in mice and rats may explain why intrinsic tissue stiffness after intravenous methacholine does not increase in these species but does increase in dogs. Another important point is that micro-CT images can only show the presence or absence of gas within a given lung region, so we cannot discriminate between alveolar flooding and atelectasis on the basis of the micro-CT images alone. However, alveolar flooding should not lead to absorption atelectasis after O2 ventilation because there would be no open alveolar space for O2 to collect for subsequent absorption by the capillary blood, yet Figures 5 and 6 clearly indicate that absorption atelectasis took place in the Inflamed-O2 mice. Furthermore, the methacholine-induced increase in H was fully reversible with a deep inflation, which again would not be expected if alveolar flooding played a significant role in the lung derecruitment (1).
We also assumed that we could obtain an accurate measure of Vtg by integrating the air in the voxels within the lung fields of the micro-CT images. We have previously shown that lung volumes obtained with an independent plethysmographic technique in vivo correlate well with Vtg obtained by micro-CT (29). Nevertheless, a fundamental requirement for CT imaging of any kind is that the subject remains still throughout the scan, which in our study took about 80 minutes. We achieved this by killing the animals and then waiting for 45 to 60 minutes for them to stiffen before being placed in the micro-CT scanner. This introduced a substantial time delay between the in vivo assessment of H and the post mortem measurement of Vtg. We attempted to prevent changes taking place in Vtg between these two measurements by filling the lungs with an inert gas, N2, to prevent further absorption of gas by any blood remaining in the lungs after death. Even so, we cannot be sure that Vtg at the time of H measurement was the same as that when it was measured by micro-CT, even though our results make this look like a reasonable assumption.
In summary, we used micro-CT and the phenomenon of absorption atelectasis to produce visible evidence of airway closure after bronchoconstriction in mice. In allergically inflamed mice, the amount of lung derecruited through airway closure corresponded closely to the elevation in lung stiffness measured using the forced oscillation technique. These findings provide independent support for the hypothesis that AHR in allergically inflamed BALB/c mice reflects an accentuated degree of closure of small airways. Finally, an interesting corollary of these find- ings is that they cause us to question our use of the term AHR itself. For many, AHR implies an abnormality in the active response of the airways. Our results show, however, that if we want AHR to mean an abnormal response in lung function to bronchial challenge in general, we will have to broaden its range of applicability to include alterations related to virtually any alteration in the biophysical properties of the lung.
Supplementary Material
Supported by NIH grants R01 HL67273 and NCRR-COBRE P20 RR15557.
This article has an online supplement, which is accessible from this issue's table of contents at www.atsjournals.org
Originally Published in Press as DOI: 10.1164/rccm.200610-1410OC on January 25, 2007
Conflict of Interest Statement: None of the authors has a financial relationship with a commercial entity that has an interest in the subject of this manuscript.
References
- 1.Wagers S, Lundblad LKA, Ekman M, Irvin CG, Bates JHT. The allergic mouse model of asthma: normal smooth muscle in an abnormal lung? J Appl Physiol 2004;96:2019–2027. [DOI] [PubMed] [Google Scholar]
- 2.Pare PD. Airway hyperresponsiveness in asthma: geometry is not everything! Am J Respir Crit Care Med 2003;168:913–914. [DOI] [PubMed] [Google Scholar]
- 3.Fredberg JJ. Bronchospasm and its biophysical basis in airway smooth muscle. Respir Res 2004;5:2. [DOI] [PMC free article] [PubMed] [Google Scholar]
- 4.Brusasco V, Pellegrino R. Complexity of factors modulating airway narrowing in vivo: relevance to assessment of airway hyperresponsiveness. J Appl Physiol 2003;95:1305–1313. [DOI] [PubMed] [Google Scholar]
- 5.Niimi A, Matsumoto H, Takemura M, Ueda T, Chin K, Mishima M. Relationship of airway wall thickness to airway sensitivity and airway reactivity in asthma. Am J Respir Crit Care Med 2003;168:983–988. [DOI] [PubMed] [Google Scholar]
- 6.Lundblad LKA, Thompson-Figueroa J, Allen G, Irvin C, Bates JHT. Airway closure in allergic mice during bronchoconstriction visualized with micro-CT [abstract]. Proc Am Thorac Soc 2006;3:A789. [Google Scholar]
- 7.Wagers S, Lundblad L, Moriya HT, Bates JH, Irvin CG. Nonlinearity of respiratory mechanics during bronchoconstriction in mice with airway inflammation. J Appl Physiol 2002;92:1802–1807. [DOI] [PubMed] [Google Scholar]
- 8.Lundblad KAL, Thompson-Figueroa J, Leclair T, Irvin CG, Bates JHT. Thoracic gas volume measurements in paralyzed mice. Ann Biomed Eng 2004;32:1420–1427. [DOI] [PubMed] [Google Scholar]
- 9.Hantos Z, Daroczy B, Suki B, Nagy S, Fredberg JJ. Input impedance and peripheral inhomogeneity of dog lungs. J Appl Physiol 1992;72: 168–178. [DOI] [PubMed] [Google Scholar]
- 10.Harris RS, Winkler T, Tgavalekos N, Musch G, Vidal Melo MF, Schroeder T, Chang Y, Venegas JG. Regional pulmonary perfusion, inflation and ventilation defects in bronchoconstricted asthmatics. Am J Respir Crit Care Med 2006;174:245–253. [DOI] [PMC free article] [PubMed] [Google Scholar]
- 11.King GG, Eberl S, Salome CM, Young IH, Woolcock AJ. Differences in airway closure between normal and asthmatic subjects measured with single-photon emission computed tomography and Technegas. Am J Respir Crit Care Med 1998;158:1900–1906. [DOI] [PubMed] [Google Scholar]
- 12.Morgan JJ, Franz GN, Frazer DG. Regional differences in gas trapping (airway closure) between apex and base of excised rat lungs. Respir Physiol 1984;55:309–316. [DOI] [PubMed] [Google Scholar]
- 13.Wagers SS, Norton RJ, Rinaldi LM, Bates JHT, Sobel BE, Irvin CG. Extravascular fibrin, plasminogen activator, plasminogen activator inhibitors, and airway hyperresponsiveness. J Clin Invest 2004;114:104–111. [DOI] [PMC free article] [PubMed] [Google Scholar]
- 14.Hohlfeld JM, Ahlf K, Enhorning G, Balke K, Erpenbeck VJ, Petschallies J, Hoymann HG, Fabel H, Krug N. Dysfunction of pulmonary surfactant in asthmatics after segmental allergen challenge. Am J Respir Crit Care Med 1999;159:1803–1809. [DOI] [PubMed] [Google Scholar]
- 15.Belik J, Jankov RP, Pan J, Tanswell AK. Chronic O2 exposure enhances vascular and airway smooth muscle contraction in the newborn but not adult rat. J Appl Physiol 2003;94:2303–2312. [DOI] [PubMed] [Google Scholar]
- 16.Petak F, Habre W, Donati YR, Hantos Z, Barazzone-Argiroffo C. Hyperoxia-induced changes in mouse lung mechanics: forced oscillations vs. barometric plethysmography. J Appl Physiol 2001;90:2221–2230. [DOI] [PubMed] [Google Scholar]
- 17.Beckett WS, Wong ND. Effect of normobaric hyperoxia on airways of normal subjects. J Appl Physiol 1988;64:1683–1687. [DOI] [PubMed] [Google Scholar]
- 18.Wollner A, Ben-Dov I, Bar-Yishay E. Effect of hyperoxia on bronchial response to inhaled methacholine. Allergy 1991;46:35–39. [DOI] [PubMed] [Google Scholar]
- 19.Mann CM, Domino KB, Walther SM, Glenny RW, Polissar NL, Hlastala MP. Redistribution of pulmonary blood flow during unilateral hypoxia in prone and supine dogs. J Appl Physiol 1998;84:2010–2019. [DOI] [PubMed] [Google Scholar]
- 20.Lauzon AM, Bates JH. Kinetics of respiratory system elastance after airway challenge in dogs. J Appl Physiol 2000;89:2023–2029. [DOI] [PubMed] [Google Scholar]
- 21.Domino KB, Hlastala MP, Eisenstein BL, Cheney FW. Effect of regional alveolar hypoxia on gas exchange in dogs. J Appl Physiol 1989;67:730–735. [DOI] [PubMed] [Google Scholar]
- 22.Ricciardolo FLM. Multiple roles of nitric oxide in the airways. Thorax 2003;58:175–182. [DOI] [PMC free article] [PubMed] [Google Scholar]
- 23.Lakshminrusimha S, Morin FC III, Steinhorn RH, Gugino SF, Ryan RM, Kumar VH, Russell JA. Ovine bronchial-derived relaxing factor: changes with development and hyperoxic ventilation. J Appl Physiol 2006;101:135–139. [DOI] [PMC free article] [PubMed] [Google Scholar]
- 24.Venegas JG, Winkler T, Musch G, Vidal Melo MF, Layfield D, Tgavalekos N, Fischman AJ, Callahan RJ, Bellani G, Scott Harris R. Self-organized patchiness in asthma as a prelude to catastrophic shifts. Nature 2005;434:777–782. [DOI] [PubMed] [Google Scholar]
- 25.Laurent F, Latrabe V, Raherison C, Marthan R, Tunon-de-Lara JM. Functional significance of air trapping detected in moderate asthma. Eur Radiol 2000;10:1404–1410. [DOI] [PubMed] [Google Scholar]
- 26.Bates JH, Lauzon AM, Dechman GS, Maksym GN, Schuessler TF. Temporal dynamics of pulmonary response to intravenous histamine in dogs: effects of dose and lung volume. J Appl Physiol 1994;76:616–626. [DOI] [PubMed] [Google Scholar]
- 27.Mitzner W, Blosser S, Yager D, Wagner E. Effect of bronchial smooth muscle contraction on lung compliance. J Appl Physiol 1992;72:158–167. [DOI] [PubMed] [Google Scholar]
- 28.Bates JH, Schuessler TF, Dolman C, Eidelman DH. Temporal dynamics of acute isovolume bronchoconstriction in the rat. J Appl Physiol 1997; 82:55–62. [DOI] [PubMed] [Google Scholar]
- 29.Lundblad LK, Thompson-Figueroa J, Leclair T, Sullivan MJ, Poynter ME, Irvin CG, Bates JH. Tumor necrosis factor-α overexpression in lung disease: a single cause behind a complex phenotype. Am J Respir Crit Care Med 2005;171:1363–1370. [DOI] [PMC free article] [PubMed] [Google Scholar]
Associated Data
This section collects any data citations, data availability statements, or supplementary materials included in this article.


