Abstract
Recently, a family of polyketide inhibitors of F0F1-ATPase, including apoptolidin, ossamycin, and oligomycin, were shown to be among the top 0.1% most cell line selective cytotoxic agents of 37,000 molecules tested against the 60 human cancer cell lines of the National Cancer Institute. Many cancer cells maintain a high level of anaerobic carbon metabolism even in the presence of oxygen, a phenomenon that is historically known as the Warburg effect. A mechanism-based strategy to sensitize such cells to this class of potent small molecule cytotoxic agents is presented. These natural products inhibit oxidative phosphorylation by targeting the mitochondrial F0F1 ATP synthase. Evaluation of gene expression profiles in a panel of leukemias revealed a strong correlation between the expression level of the gene encoding subunit 6 of the mitochondrial F0F1 ATP synthase (known to be the binding site of members of this class of macrolides) and their sensitivity to these natural products. Within the same set of leukemia cell lines, comparably strong drug–gene correlations were also observed for the genes encoding two key enzymes involved in central carbon metabolism, pyruvate kinase, and aspartate aminotransferase. We propose a simple model in which the mitochondrial apoptotic pathway is activated in response to a shift in balance between aerobic and anaerobic ATP biosynthesis. Inhibitors of both lactate formation and carbon flux through the Embden–Meyerhof pathway significantly sensitized apoptolidin-resistant tumors to this drug. Nine different cell lines derived from human leukemias and melanomas, and colon, renal, central nervous system, and ovarian tumors are also sensitized to killing by apoptolidin.
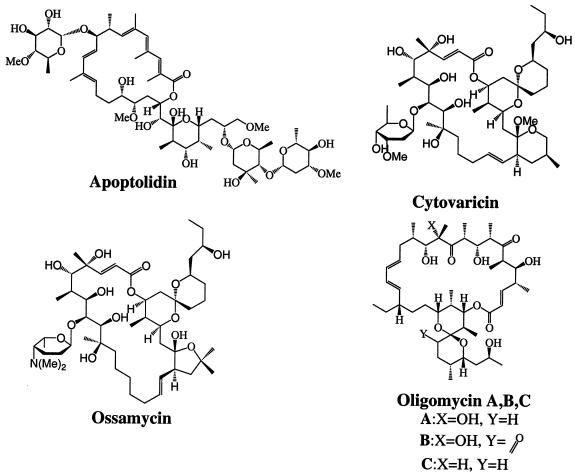
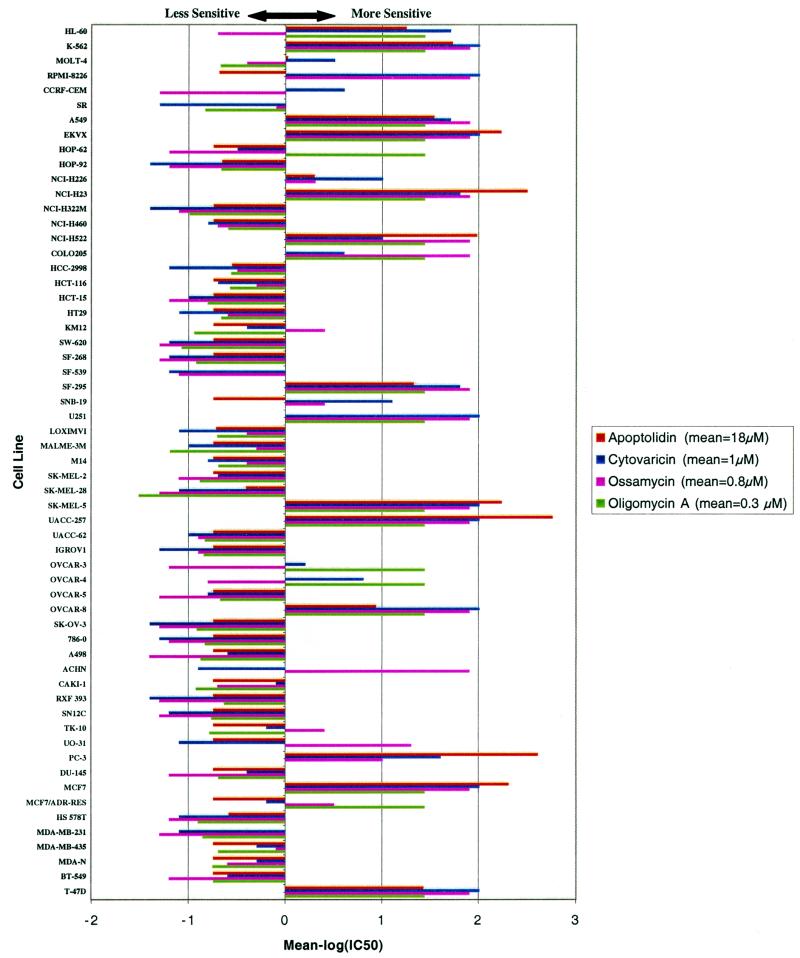
Drugs that can selectively sensitize cancer cells to apoptosis induction are likely to play a vital role in cancer therapy. Recently, the discovery of a polyketide natural product, apoptolidin (Fig. 1), that selectively sensitizes E1A-transformed, but not ras- or myc-transformed, cells to apoptosis, was reported (1, 2). In the course of our studies on the molecular target of this natural product, we found that apoptolidin is a potent inhibitor of the mitochondrial ATPase (3). Although the antifungal activities of other macrolide inhibitors of the same enzyme [e.g., oligomycin, cytovaricin, and ossamycin (Fig. 1)] are well documented, their potential relevance as reagents to modulate apoptotic pathways is only now being recognized (4), and their unusual selectivity toward certain cell types is not widely appreciated (Fig. 2). An extremely powerful method to test selectivity of an anticancer drug to various types of cancer is the sensitivity pattern among the NCI-60 (5, 6). The polyketide inhibitors of F0F1-ATPase, including apoptolidin, ossamycin, and oligomycin, were shown to be among the top 0.1% most cell line selective cytotoxic agents of 37,000 molecules tested against the human cell lines of the NCI-60 (3). By comparison of the pattern of sensitivity of a molecule to the approximately 70,000 molecules previously examined, one can often discover molecules of known mechanisms of action that show high correlation to the compound, suggesting a similar mechanism of action (7). A recent report describing the expression profiles for approximately 10,000 genes in the NCI-60 cell lines (8, 9) raised the possibility of discovering correlations between gene expression in the cell lines shown in Fig. 2 and their sensitivities to this family of natural products.
Figure 1.
Structure of apoptolidin, cytovaricin, oligomycin, and ossamycin.
Figure 2.
Sensitivity profile for F0F1-ATPase inhibitors shown in Fig. 1 against the 60 human cancer cell lines of the National Cancer Institute (NCI-60). A powerful method to test the selectivity of an anticancer drug to various types of cancer is the sensitivity pattern among the NCI-60 (5, 6). By comparison of the pattern of sensitivity of a molecule to the approximately 70,000 molecules previously examined, one can often discover molecules of known mechanism of action that show high correlation to the compound, suggesting a similar mechanism of action (7). The mean IC50 values for apoptolidin, cytovaricin, oligomycin A, and ossamycin were 18 μM, 1 μM, 0.27 μM, and 0.8 μM, respectively. HL-50, K-562, MOLT-4, RPMI-8226, CCRF-CEM, and SR are tumor cell lines derived from human leukemias. A549, EKVX, HOP-62, HOP-92, NCI-H226, NCI-H23, NCI-H322 M, NCI-H460, and NCI-H522 are derived from lung cancers. COLO205, HCC-2998, HCT-116, HCT-15, HT29, KM12, and SW-620 are derived from colon cancers. SF-268, SF-539, SF-295, SNB-19, and U251 are derived from central nervous system cancers. LOXIMVI, MALME-3 M, M14, SK-MEL-2, SK-MEL-28, SK-MEL-5, UACC-257, and UACC-62 are derived from melanomas. IGROV1, OVCAR-3, OVCAR-4, OVCAR-5, OVCAR-8, and SK-OV-3 are derived from ovarian cancers. 786-0, A498, ACHN, CAKI-1, RXF 393, SN12C, TK-10, UO-31, and PC-3 are derived from renal cancers. DU-145 is derived from a prostate cancer. MCF7, HS 578T, MDA-MB-231, MDA-MB-435, MDA-N, BT-549, and T-47D are derived from breast cancers. MCF7/ADR-RES is a multidrug-resistant derivative of MCF7.
Materials and Methods
Cells.
HCT-116, HT-29, IGR-OV-1, M14, RPMI-8226, SN12C, 786-0, and SF-539 cells were obtained from Katherine D. Gill of the National Cancer Institute (Bethesda). Jurkat clone E6-1 was obtained from the American Type Culture Collection. Cell lines were grown in RPMI medium 1640 (Life Technologies, Rockville, MD) supplemented with 10% (vol/vol) FCS (Life Technologies), 2 mM glutamine, 100 units/ml penicillin, and 50 units/ml streptomycin at 37°C, 5% CO2 in air in a humidified incubator.
Drug Additions.
Apoptolidin was isolated from the producing organism as described in ref. 2. Oligomycin A, B, C, oxamate, and 2-deoxyglucose were obtained from Sigma. Concentrated stock solutions of apoptolidin and oligomycin were prepared in PBS with less than 1% DMSO in the final drug dilution.
Fluorescence-Activated Cell Sorter Assay for Annexin V and Propidium Iodide.
Cells were planted at 20,000 cells per well in 200 μl and allowed to adhere for 12 h. Next, cells were treated with drugs for various times and then washed. Cells were stained with 5 μl per test Annexin V-FITC (Becton Dickinson) for 15 min and washed three times. Next, the cells were stained with 1 μg/ml propidium iodide and washed two times. Cells were analyzed on the FACScan (Becton Dickinson), and the percentage of Annexin V and propidium iodide positive cells was quantified by using flowjo software for the Macintosh (Tree Star, San Carlos, CA).
Western Blotting.
For analysis of HIF-1α gene expression levels, total cellular protein was isolated by lysing cells for 1 min at 98°C in a buffer of 2% (wt/vol) SDS, 50 mM Tris⋅HCl (pH 6.8), 5% (vol/vol) glycerol, 5% (vol/vol) 2-mercaptoethanol, and 0.001% bromophenol blue (pH 6.8). Protein concentration was determined by the Lowry method (Bio-Rad). Equal amounts of protein were subjected to SDS/15% PAGE and electroblotted to a nitrocellulose membrane. The membrane was blocked for 1 h in blocking buffer [PBS/Tween 20/10% (vol/vol) milk] and then incubated for 4 h with 1:250 mouse anti-human HIF-1α antibody (clone 54, PharMingen). Membrane was then washed two times for 15 min each in blocking buffer followed by two more washes for 15 min each in PBS/Tween. Membrane was then stained with 1:1,000 sheep anti-mouse Ig (Amersham Pharmacia) directly conjugated to horseradish peroxidase for 1 h in blocking buffer and washed two times with blocking buffer and then two times with PBS/Tween. Bands were visualized by using chemiluminescence with the enhanced chemiluminescence kit from Amersham Pharmacia.
Results
A global comparison of the IC50 values for cytovaricin, ossamycin, oligomycin, or apoptolidin and the gene expression profiles in the entire panel of cell lines failed to reveal any statistically significant pairwise correlations (tools available at http://discover.nci.nih.gov/nature2000/ were used for this analysis). However, intriguing correlations were observed within some subsets of cell lines of different cell types. Notably, among leukemia cell lines (n = 6), the expression levels of the gene encoding the F0 subunit 6 of the mitochondrial ATP synthase correlated well with potency of cytovaricin toward these cell lines (Table 1). (Cytovaricin was chosen because of its superior dynamic range for data analysis and the fact that data against six leukemia cell lines were available.) Previous work has established that the precise target of antifungal agents such as oligomycin and ossamycin in yeast is at the interface of F0 subunits 6 and 9 (10–12). Together with the general observation that leukemia cells are particularly sensitive to these macrolides (for an example, see Fig. 2), this statistically significant correlation led us to focus further analysis on expression profiles only within the leukemia cell subset of the NCI-60. Remarkably, this focused search led to the emergence of strong positive correlations between cytovaricin sensitivity and the expression levels of two key enzymes in central carbon metabolism: pyruvate kinase (liver isozyme) and aspartate aminotransferase (Table 1). Furthermore, strong negative correlations were observed between hypoxia-inducible factor 1α (HIF-1α) gene expression and cytovaricin sensitivity among the leukemia cell subset.
Table 1.
Correlation of gene expression data to cytovaricin sensitivity
| Gene | Correlation to cytovaricin sensitivity | Bootstrap interval (95% percentile) | Bootstrap P value |
|---|---|---|---|
| Pyruvate kinase (liver isozyme) | 0.977 | 0.801, 0.998 | 2/1,000 |
| Aspartate aminotransferase 2 (mitochondrial) | 0.971 | 0.844, 1 | 9/1,000 |
| ATP synthase F0 subunit 6 | 0.988 | 0.956, 1 | 0/1,000 |
| Hypoxia-inducible factor 1α | −0.97 | −1, −0.94 | 2/1,000 |
In addition to the genes documented here, 28 other genes had correlation coefficient values greater than 0.97 to cytovaricin sensitivity. Of these, 21 genes were expressed sequence tags of unknown function. The remaining genes included α-syntrophin (AA026753), human mitogen-induced nuclear orphan receptor (W42606), G9 gene encoding sialidase (AA045288), CDW52 antigen (W79743), wingless-type MMTV integration site (H02859), atopy-related autoantigen (AA031269), and the KIAA0207 gene product (W94015).
Pyruvate kinase is positioned at a key branch-point in glucose metabolism. Because the liver isozyme is most sensitive to feedback regulation (13, 14), its high expression level suggests that the cell controls carbon flux at this point in the Embden–Meyerhof pathway, rather than allowing carbon overflow into lactate. Therefore, the expression level of this isozyme would be expected to correlate directly with the aerobic status of the cell. Likewise, aspartate aminotransferase, a key enzyme in the aspartate–malate shuttle that converts NADH into ATP with high efficiency, has been shown to be critical in the mitochondrial activity of cancer cells (15–17). Again, its high expression level might be expected to correlate with a strong dependence on mitochondrial activity for carbon metabolism. HIF-1α is a transcription factor that regulates the transcription of key glycolytic enzymes including aldolase, lactate dehydrogenase, pyruvate kinase (muscle isozyme), enolase, and phosphofructokinase, which collectively mediate increased glycolytic generation of ATP and other intracellular metabolic adaptations to hypoxia important for tumor progression to the lethal phenotype (18, 19). Taken together, these observations led us to formulate a simple model in which apoptosis was induced in response to these macrolides by a specific signal that responds to a shift in balance between aerobic and anaerobic ATP biosynthesis. This metabolism-driven model might explain why untransformed cells (which presumably have low ATP requirements that can be met by basal mitochondrial activity) are resistant to apoptolidin (2), whereas certain tumors, such as leukemias (which presumably have a high ATP demand that depends on maximal mitochondrial activity), are sensitive to apoptolidin. This model also suggests that tumor cells that principally depend on anaerobic fermentation for meeting their high ATP demand would be resistant toward apoptolidin.
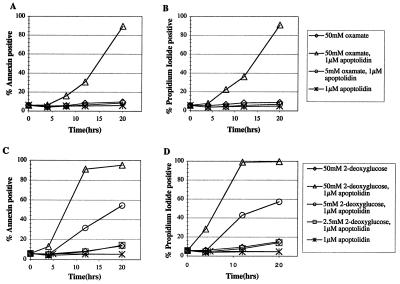
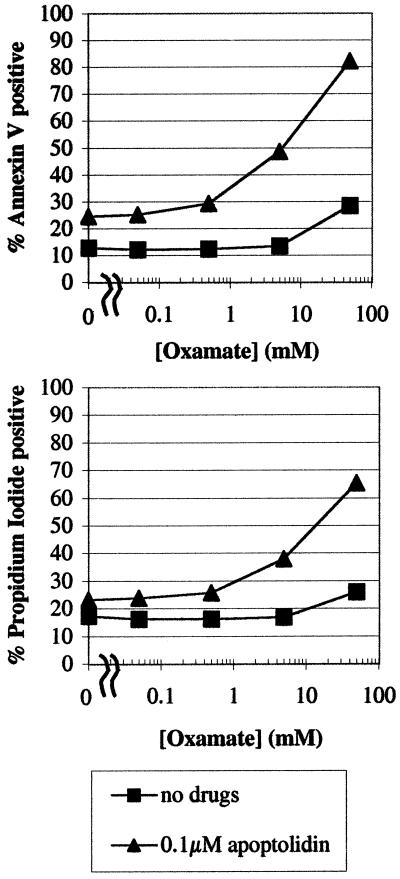
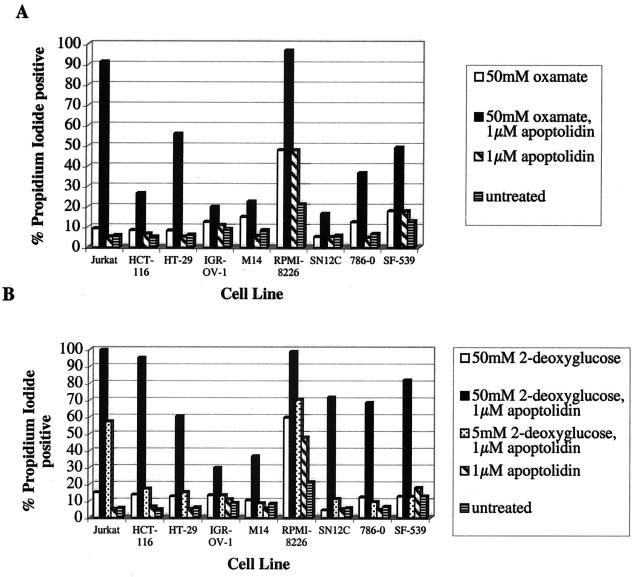
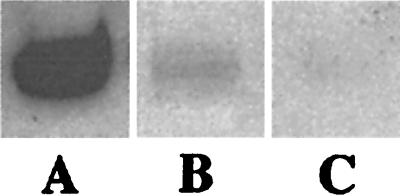
To test these hypotheses, two pharmacological approaches were designed. First, the implications of cotreating cells with apoptolidin and oxamate were investigated. Oxamate, an inhibitor of lactate dehydrogenase, would be expected to attenuate lactate formation, thereby channeling carbon flux from the Embden–Meyerhof pathway into the mitochondria. Second, the effect of cotreating cells with apoptolidin and 2-deoxyglucose was studied. 2-Deoxyglucose inhibits carbon flux through the Embden–Meyerhof pathway as a result of the formation of a dead-end metabolite via a hexokinase-catalyzed reaction. Both these strategies might be expected to shift the balance from anaerobic toward aerobic ATP biosynthesis. Jurkat cells were initially used for these studies, because they are prolific producers of lactate (data not shown) and are ordinarily resistant to apoptolidin. Cells were strongly sensitized toward this macrolide in the presence of either oxamate or 2-deoxyglucose (Fig. 3). Oxamate also has a demonstrable effect on LYas, a mouse lymphoma cell line that is ordinarily sensitive to apoptolidin (3, 20). Whereas cell death is induced in only 25% of the cells at 7 h after treatment in the presence of 0.1 μM apoptolidin alone; cotreatment with increasing concentrations of oxamate resulted in increased induction of the cells to apoptosis after a 7-h treatment (Fig. 4). The generality of this chemosensitization effect was confirmed on nine different cell lines that are ordinarily resistant or partially resistant to apoptolidin, including cell lines derived from human leukemias and melanomas, as well as colon, renal, central nervous system, and ovarian tumors (Fig. 5). To elaborate the importance of HIF-1α protein, we determined that treatment with 50 mM of 2-deoxyglucose or oxamate dramatically reduced the amount of HIF-1α protein expression in SN12C cells treated for 20 h (Fig. 6).
Figure 3.
Sensitization of Jurkat cells with oxamate (A and B) and 2-deoxyglucose (C and D).
Figure 4.
Titration of oxamate with fixed apoptolidin concentrations in the mouse lymphoma cell line LYas for 7 h.
Figure 5.
Sensitization of eight resistant NCI-60 cell lines with oxamate (A) and 2-deoxyglucose (B). Designations of cell lines are identical to those used in Fig. 2.
Figure 6.
Western blot of HIF-1α protein expression in SN12C cells treated for 20 h (10 μg of total protein in each lane). A, untreated; B, 50 mM oxamate; C, 50 mM 2-deoxyglucose.
Discussion
Many cancer cells maintain a high level of anaerobic carbon metabolism even in the presence of oxygen, a phenomenon that is historically known as the Warburg effect (21, 22). From our results, we conclude that macrolide inhibitors of the mitochondrial F0F1-ATP synthase selectively kill metabolically active tumor cells that do not exhibit the Warburg effect. Furthermore, tumor cells that exhibit the Warburg effect can be sensitized toward this class of cytotoxic agents on treatment with nontoxic molecules such as oxamate and 2-deoxyglucose. The lactate dehydrogenase inhibitor oxamate would be expected to attenuate lactate formation, thereby channeling carbon flux from the Embden–Meyerhof pathway into the mitochondria. The Embden–Meyerhof pathway inhibitor 2-deoxyglucose would also be expected to increase cellular dependence on mitochondrially derived aerobic energy. Thus, these polyketides might offer tools for the study of cancer biology and possibly for cancer therapy.
In conclusion, we note that, although the precise mechanism for induction of apoptosis by this strategy remains to be established, we have shown that it involves the well characterized mitochondrial apoptotic pathway (23). Evidence for this comes from recent observations that BCL-2 overexpression as well as caspase-9 inhibitors antagonize the cytotoxic activity of apoptolidin (3), and that oligomycin inhibits the staurosporine- or Bax-induced release of cytochrome C from intact mitochondria (4, 24). Further biological investigations with this class of selective cytotoxic agents might reveal new insights into the mechanisms of programmed cell death.
Acknowledgments
We thank Dr. Haruo Seto for providing us with Nocardiopsis sp., the producing strain of apoptolidin, and the National Cancer Institute for assaying the natural products described here against the NCI-60 cell line panel. This work was supported by National Institutes of Health Grants CA 66736 (to C.K.) and CA 42509 (to L.A.H.). D.W.V. was supported by an immunology training grant (AI-0729015).
Abbreviation
- NCI-60
the 60 human cancer cell lines of the National Cancer Institute
References
- 1.Hayakawa Y, Kim J W, Adachi H, Shinya K, Fujita K, Seto H. J Am Chem Soc. 1998;120:3524–3525. [Google Scholar]
- 2.Kim J W, Adachi H, Shin-ya K, Hayakawa Y, Seto H. J Antibiot (Tokyo) 1997;50:628–630. doi: 10.7164/antibiotics.50.628. [DOI] [PubMed] [Google Scholar]
- 3.Salomon, A. R., Voehringer, D., Herzenberg, L. A. & Khosla, C. (2000) Chem. Biol., in press. [DOI] [PubMed]
- 4.Matsuyama S, Llopis J, Deveraux Q L, Tsien R Y, Reed J C. Nat Cell Biol. 2000;2:318–325. doi: 10.1038/35014006. [DOI] [PubMed] [Google Scholar]
- 5.Monks A, Scudiero D, Skehan P, Shoemaker R, Paull K, Vistica D, Hose C, Langley J, Cronise P, Vaigro-Wolff A, et al. J Natl Cancer Inst. 1991;83:757–766. doi: 10.1093/jnci/83.11.757. [DOI] [PubMed] [Google Scholar]
- 6.Paull K D, Shoemaker R H, Hodes L, Monks A, Scudiero D A, Rubinstein L, Plowman J, Boyd M R. J Natl Cancer Inst. 1989;81:1088–1092. doi: 10.1093/jnci/81.14.1088. [DOI] [PubMed] [Google Scholar]
- 7.Paull K D, Hamel E, Malspeis L. In: Cancer Chemotherapeutic Agents. Foye W E, editor. Washington, DC: Am. Chem. Soc.; 1993. pp. 9–45. [Google Scholar]
- 8.Ross D T, Scherf U, Eisen M B, Perou C M, Rees C, Spellman P, Iyer V, Jeffrey S S, Van de Rijn M, Waltham M, et al. Nat Genet. 2000;24:227–235. doi: 10.1038/73432. [DOI] [PubMed] [Google Scholar]
- 9.Scherf U, Ross D T, Waltham M, Smith L H, Lee J K, Tanabe L, Kohn K W, Reinhold W C, Myers T G, Andrews D T, et al. Nat Genet. 2000;24:236–244. doi: 10.1038/73439. [DOI] [PubMed] [Google Scholar]
- 10.Criddle R S, Packer L, Shieh P. Proc Natl Acad Sci USA. 1977;74:4306–4310. doi: 10.1073/pnas.74.10.4306. [DOI] [PMC free article] [PubMed] [Google Scholar]
- 11.John U P, Nagley P. FEBS Lett. 1986;207:79–83. doi: 10.1016/0014-5793(86)80016-3. [DOI] [PubMed] [Google Scholar]
- 12.Nagley P, Hall R M, Ooi B G. FEBS Lett. 1986;195:159–163. doi: 10.1016/0014-5793(86)80152-1. [DOI] [PubMed] [Google Scholar]
- 13.Eigenbrodt E, Reinacher M, Scheefers-Borchel U, Scheefers H, Friis R. Crit Rev Oncog. 1992;3:91–115. [PubMed] [Google Scholar]
- 14.Yamada K, Noguchi T. Biochem Biophys Res Commun. 1999;256:257–262. doi: 10.1006/bbrc.1999.0228. [DOI] [PubMed] [Google Scholar]
- 15.Greenhouse W V, Lehninger A L. Cancer Res. 1976;36:1392–1396. [PubMed] [Google Scholar]
- 16.Greenhouse W V, Lehninger A L. Cancer Res. 1977;37:4173–4181. [PubMed] [Google Scholar]
- 17.Lopez-Alarcon L, Eboli M L. Cancer Res. 1986;46:5589–5591. [PubMed] [Google Scholar]
- 18.Semenza G L. Annu Rev Cell Dev Biol. 1999;15:551–578. doi: 10.1146/annurev.cellbio.15.1.551. [DOI] [PubMed] [Google Scholar]
- 19.Hanahan D, Folkman J. Cell. 1996;86:353–364. doi: 10.1016/s0092-8674(00)80108-7. [DOI] [PubMed] [Google Scholar]
- 20.Story M D, Voehringer D W, Malone C G, Hobbs M L, Meyn R E. Int J Radiat Biol. 1994;66:659–668. [PubMed] [Google Scholar]
- 21.Warburg O. Biochem Z. 1924;152:319–344. [Google Scholar]
- 22.Warburg O. Science. 1956;123:309–314. doi: 10.1126/science.123.3191.309. [DOI] [PubMed] [Google Scholar]
- 23.Green D R, Reed J C. Science. 1998;281:1309–1312. doi: 10.1126/science.281.5381.1309. [DOI] [PubMed] [Google Scholar]
- 24.Narita M, Shimizu S, Ito T, Chittenden T, Lutz R J, Matsuda H, Tsujimoto Y. Proc Natl Acad Sci USA. 1998;95:14681–14686. doi: 10.1073/pnas.95.25.14681. [DOI] [PMC free article] [PubMed] [Google Scholar]


