Abstract
Angiotensin-converting enzyme (ACE) is a peptidase responsible for the cleavage of angiotensin I and several other peptides. Here, gene targeting was used to switch control of the ACE locus from the endogenous promoter to the macrophage-specific c-fms promoter. Challenge of these mice, called ACE 10/10, with the aggressive mouse melanoma cell line B16 showed that they are remarkably resistant to tumor growth. Tumor resistance was seen after challenge with different melanoma cell lines and in mice with different genetic backgrounds. Histological study of the tumors that did grow in ACE 10/10 mice showed an enhanced inflammatory response. ACE 10/10 mice had increased numbers of tumor epitope-specific CD8+ T cells after challenge with melanoma or lymphoma. ACE 10/10 macrophages showed increased production of interleukin-12 and nitric oxide but reduced interleukin-10. Engraftment of wild-type mice with ACE 10/10 bone marrow transferred B16 tumor resistance. Injection of B16 tumors with ACE 10/10 macrophages also reduced tumor growth. ACE 10/10 mice may define a new means of enhancing the immune response, which may be potentially useful in several human clinical situations.
The renin-angiotensin system (RAS) is an enzymatic cascade producing the active octapeptide angiotensin II from angiotensinogen.1 This occurs in two consecutive steps catalyzed by renin and angiotensin-converting enzyme (ACE). Whereas renin is very precise in its substrate specificity, ACE is more promiscuous. Angiotensin I and bradykinin are well-known physiological substrates, but ACE also cleaves substance P, AcSDKP, β-endorphins, and several other peptides. Perhaps because of this variety of substrates, ACE affects many physiological processes including blood pressure, hematopoiesis, and fertility.2 Indeed, ACE may occasionally play an immunological role as indicated by Nakagawa et al3 and Koslowski et al,4 who showed that ACE is important in the production of the immunodominant epitope of the human immunodeficiency virus 1 protein gp160. Finally, ACE has been implicated in several pathological processes, such as atherosclerosis and diabetic nephropathy.5,6
ACE is a zinc-dependent carboxypeptidase. Several different tissues express ACE, but it is the expression of large amounts of ACE by vascular endothelium that is responsible for the bulk conversion of angiotensin I to angiotensin II. All somatic tissues that express ACE make a protein containing two independent catalytic domains.7 This is distinct from the ACE isozyme made by developing male germ cells, which is called testis ACE. Testis ACE is catalytic, but this protein is smaller than the somatic enzyme. Somatic ACE and testis ACE arise because the ACE gene has two distinct promoter regions.2,8
Previously, the physiology of ACE was investigated using genetically modified mice lacking all ACE.9,10 Such ACE-null mice have a complicated phenotype characterized by low blood pressure, the inability to concentrate urine, structural renal defects, anemia, and reduced male fertility. In an attempt to reduce this complexity, our group used gene targeting to make genetic mouse models in which ACE expression was limited to a small group of tissues. Specifically, gene targeting in mouse embryonic stem cells was used to transfer the expression of somatic ACE from the endogenous somatic ACE promoter to other promoter regions.11
Here, we describe a mouse model called ACE 10/10, in which gene targeting was used to substitute ACE expression from the endogenous promoter to the c-fms promoter. These mice express high ACE levels in macrophages and macrophage-like cells but lack ACE in such traditional locations as blood vessels and kidney. ACE 10/10 mice were originally conceived as a model to study the relationship between enhanced macrophage ACE expression and atherosclerosis. However, while we were characterizing these animals, we realized that ACE 10/10 mice have a very unexpected phenotype: a marked resistance to the growth of an aggressive and commonly used tumor model, B16 melanoma. ACE 10/10 mice respond to melanoma challenge with an enhanced inflammatory response, including increased tumor-specific CD8+ T cells; macrophages from these mice respond to stimuli with an enhanced “M1” activation profile characterized by increased interleukin (IL)-12 and nitric oxide but decreased IL-10. Direct transfer of macrophages or engraftment of wild-type mice with ACE 10/10 bone marrow transferred B16 tumor resistance. If ACE 10/10 mice define a general yet simple means of enhancing immunity, this may be useful to human tumor therapy as well as in other clinical settings.
Materials and Methods
Materials
Lipopolysaccharide (LPS) (Escherichia coli 055:B5) was from Sigma-Aldrich (St. Louis, MO). Murine IL-10 and IL-12/p40 enzyme-linked immunosorbent assay kits were purchased from eBioscience (San Diego, CA). Griess reagents were from Promega (Madison, WI), and the Griess assay was performed according to the manufacturer’s instructions. ACE activity was measured using the ACE-REA kit from American Laboratory Products Company, Ltd. (ALPCO, Windham, NH) as previously described.11 ACE activity was defined as that inhibited by captopril.
Creation of ACE.10 Homozygous Mutant Mice
A neomycin cassette (called KT3NP4) was inserted into a unique BssHII restriction site located within the 5′ untranslated region of somatic ACE.11 A 7.2-kb fragment of DNA encoding the mouse c-fms promoter, the first and second c-fms exons, and the first and second introns were positioned immediately 3′ to the neomycin cassette within the targeting vector. The c-fms promoter had previously been modified so that the translation start site, normally present in exon II, was no longer functional.12,13 The promoter was obtained from David Hume (University of Queensland, Queensland, QLD, Australia). Targeted homologous recombination was performed as previously described.11 Age-matched littermate controls were used in all studies. Animal procedures were approved by the Institutional Animal Care and Use Committee and were supervised by the Emory Division of Animal Research.
Antibodies and Tetramer
Immunohistochemistry of paraffin-embedded tissue was performed with polyclonal rabbit anti-mouse ACE,8 rat anti-mouse F4/80 (Serotec, Oxford, UK), and rat anti-human CD3 (Serotec). The antibodies were developed using biotinylated goat secondary antibodies (Vector Laboratories, Burlingame, CA), the VECTASTAIN ABC-AP (alkaline phosphatase) kit (Vector Laboratories), and Vector Red substrate. Other antibodies used for immunofluorescent microscopy or fluorescence-activated cell sorting (FACS) analysis were from BD Biosciences, Serotec, or eBioscience. Phycoerythrin-conjugated SVYDFFVWL tetramer was synthesized by the National Institutes of Health Tetramer Core Facility. Allophycocyanine-conjugated SIINFEKL tetramer was a gift from Dr. John D. Altman (Emory University).
Cells and Tumor Model
The B16-F10 melanoma cell line was obtained from the American Type Culture Collection (Manassas, VA). The B16-LS9 melanoma cell line was obtained from Hans E. Grossniklaus (Emory University). The B16/OVA melanoma cell line was obtained from Edith M. Lord (University of Rochester). The E.G7-OVA cell line was obtained from Kyle McKenna (Emory University). Before use, the melanoma cell monolayer was detached with phosphate-buffered saline containing 0.25% trypsin and 0.03% ethylenediamine tetraacetic acid, washed, and counted. The cell concentration was adjusted to 1 × 10⁷ cells/ml, and 100 μl of the suspension was injected intradermally into the dorsal skin using a 26-gauge needle under anesthesia. The size of the tumor was measured using a caliper. The tumor volume was calculated according to the formula (V = [L × W2] × 0.52), where V is volume, L is length, and W is width (length is greater than width).14
Inhibitors
ALZET osmotic minipumps (Cupertino, CA) were placed subcutaneously. Captopril was dosed at 6 mg/kg per day, whereas losartan was given at 30 mg/kg per day for 2 weeks. Blood pressure measurements by tail cuff verified the effectiveness of the drugs in reducing blood pressure.
Bone Marrow Transplantation
ACE 10 mice were back-crossed to C56BL/6 mice for a total of 7 generations. These mice expressed the CD45.2 allele. Bone marrow was obtained from 8-week-old ACE 10/10 and littermate ACE wild-type donor mice by flushing femurs and tibiae with RPMI 1640 medium. Nucleated cells were counted, and the bone marrow was resuspended at a concentration of 2 × 10⁷/ml. Recipient mice were 8-week-old C57BL/6, 10 of whom expressed the CD45.1 allele, whereas five expressed CD45.2. Recipients were irradiated with 1100 rads and then were immediately reconstituted with either 2 × 10⁶ ACE 10/10 or wild-type bone marrow cells via retroorbital injection. After 8 weeks, the recipient mice were analyzed by FACS for blood leukocyte expression of CD45 alleles, ACE, and markers of myeloid and T cells.
T Cell Depletion
On days −2, −1, 1, and 7, F2 ACE 10/10 mice were injected intraperitoneally with 250 μg of monoclonal antibodies YTS 169.4.2.1 (anti-mouse CD8; Emory Vaccine Center) or GK1.5 (anti-mouse CD4; Emory Vaccine Center). A second group of control ACE 10/10 mice was injected with class-matched rat IgG.
Macrophage Expansion
For later experiments, bone marrow was obtained from 6- to 8-week-old donor mice. This was cultured for 7 days in media containing 15% L929 cell-conditioned media as previously described.15 The conditioned media provide macrophage-colony-stimulating factor and results in a pure population of macrophages.
Results
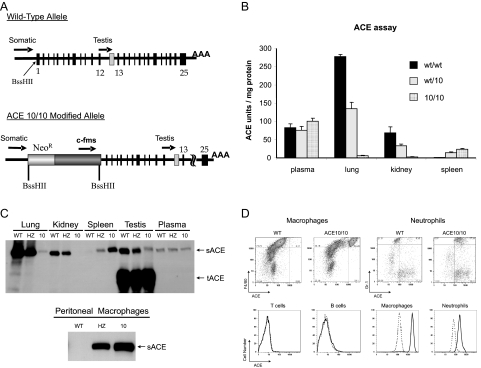
Targeted homologous recombination in mouse embryonic stem cells was used to modify the ACE gene and substitute control of ACE expression to a c-fms promoter cassette (Figure 1A). This cassette, containing both the first and second introns of the c-fms gene, was previously shown to be selective in targeting gene expression to macrophages and macrophage lineage cells.12,13 Proper homologous targeting was verified, and chimeric mice were bred to produce agouti F1 and then F2 mice. Homozygous mutant mice are termed ACE 10/10, since this was the 10th ACE line made in our laboratory. Of 441 F2 mice genotyped, 26% were wild type, 49% were heterozygous, and 26% were ACE 10/10. ACE 10/10 mice appeared grossly normal, with normal organ weight/body weight ratios.
Figure 1.
ACE expression in ACE 10/10 mice. A: The top of the figure shows the wild-type organization of the ACE locus. Both the somatic ACE promoter and the testis ACE promoter are indicated with arrows. In the ACE 10/10 gene (bottom), homologous recombination was used to position a neomycin resistance cassette (NeoR) and a 7.2-kb c-fms promoter cassette such that the structural portion of the ACE gene is now under the control of the c-fms promoter. B: ACE activity was measured in organ homogenates of wild-type (w/w), heterozygous (wt/10), and ACE 10/10 mice. ACE activity is expressed as units per milligram total solubilized protein. The data are the group means ± SEM of 6 to 10 individual mice. C: The top panel shows tissue homogenates from wild-type (WT), heterozygous (HZ), and ACE 10/1010 mice that were studied by Western blot analysis using a rabbit anti-ACE antibody. Somatic ACE (sACE) is a band of about 170 kd, whereas testis ACE (tACE) is about 100 kd. The bottom panel shows ACE Western blot analysis of peritoneal macrophages collected after thioglycollate injection. In contrast to wild type, ACE 10/10 macrophages express abundant ACE. D: FACS was performed on white cells from the blood and peritoneal lavage of wild-type and ACE 10/10 mice. Cells were stained with a polyclonal rabbit anti-ACE antibody and costained with antibody against CD3, B220, Gr-1, or F4/80. The upper portion of the figure shows that macrophages (F4/80 bright cells) and neutrophils (Gr-1 bright cells) from ACE 10/10 mice express approximately 16- and fourfold more ACE (as estimated by mean fluorescent activity) than these cells from wild-type mice. The lower portion of the figure shows a histogram of the ACE staining for B cells (B220 bright), T cells (CD3 bright), macrophages, and neutrophils. The solid line shows cells from ACE 10/10, whereas the dotted line shows equivalent data from wild-type mice. Similar data were found in cells from spleen and bone marrow.
To study the tissue distribution of ACE, organ extracts from wild-type, heterozygous, and ACE 10/10 mice were tested for ACE activity (Figure 1B). Whereas a wild-type mouse has abundant lung and renal ACE activity, ACE 10/10 mice had a reduction of approximately 98% in pulmonary ACE and no detectable renal ACE. In contrast, ACE 10/10 mice had a 20-fold increase of ACE activity in spleen compared with wild type. As for plasma ACE, there were no significant differences between wild-type, heterozygous, or ACE 10/10 mice.
Western blot analysis of tissue extracts confirmed the marked reduction of lung ACE and the lack of renal ACE in ACE 10/10 mice (Figure 1C). It also verified that these mice have much more splenic ACE protein than wild-type animals. We also performed ACE activity assays and Western blot analysis of macrophages collected after peritoneal thioglycollate injection. Both assays showed little ACE activity in cells derived from wild-type mice but abundant ACE in cells from ACE 10/10 mice (Western blot shown in Figure 1C, bottom).
Standard blood analyses of ACE 10/10 mice were not significantly different from wild-type mice. These animals have normal quantities of red and white blood cells. Histological study of peripheral blood smears also showed no significant differences. FACS analysis of bone marrow and spleen showed normal quantities of T, B, and myeloid cells (data not shown).
To investigate the expression of ACE by hematopoietic tissues, FACS analysis was performed on white blood cells collected from the blood, spleen, bone marrow, and peritoneal washes (Figure 1D). Individual cell populations were stained with an anti-ACE antibody and antibodies to either CD3 (T cells), B220 (B cells), CD11b (monocytes and macrophages), F4/80 (macrophages), or Gr-1 (neutrophils and other myeloid cells). Controls included identically prepared cells from wild-type mice and a previously reported line of mice called ACE 4/4 that is null for ACE expression, except for male germ cells.16 Because the two control populations gave identical results, we only show data from wild-type mice. When cells were gated and compared for the level of ACE expression, no ACE expression was detected in the T or B cells of either ACE 10/10 or control mice. A high level of ACE expression, however, was detected on the monocytes/macrophages from ACE 10/10 mice; mean channel fluorescence was about 16-fold higher than that of monocytes/macrophages from wild-type or ACE 4/4 mice. Neutrophils are cells of myeloid origin, and these cells from ACE 10/10 mice showed a fourfold increase of ACE fluorescence compared with controls. Splenic CD11c+ cells from ACE 10/10 mice also mildly overexpressed ACE. Thus, FACS confirms our hypothesis that ACE 10/10 mice have ACE expression targeted to macrophages and macrophage lineage cells. Indeed, monocytes and macrophages markedly overexpress ACE.
Analysis of blood pressure by tail cuff showed that ACE 10/10 mice have systolic blood pressures equivalent to wild-type and heterozygous mice (ACE 10/10, 100 ± 1 mm Hg; wild type, 99 ± 1 mm Hg; heterozygous, 94 ± 1 mm Hg, n >20/group). In addition, renal concentrating function was similar in ACE 10/10 and wild-type mice.
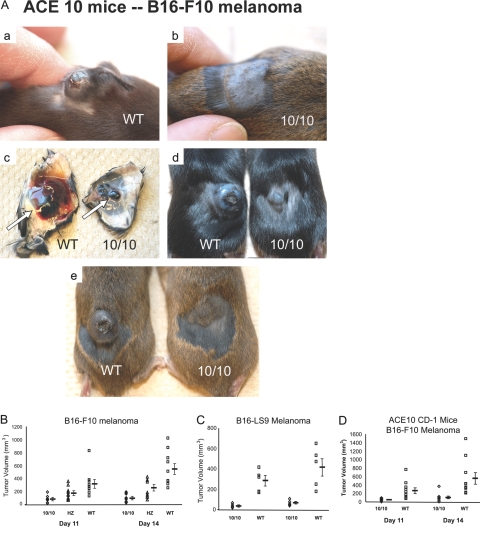
To investigate inflammation and tumor growth, we injected 1 × 10⁶ B16-F10 melanoma cells intradermally into F2 wild-type, heterozygous, and ACE 10/10 mice. B16-F10 melanoma is an aggressive cell line that will give rise to a tumor nodule in most mouse lines.17 At days 11 and 14 after injection, tumor size was measured and total tumor volume calculated. These experiments uncovered a profound and consistent difference between wild-type and ACE 10/10 mice (Figure 2, A and B). At 14 days, wild-type mice averaged tumors of 540 ± 83 mm3; ACE 10/10 and heterozygous mice averaged tumors of 90 ± 18 and 252 ± 43 mm3, respectively (P ≤ 0.001 compared with wild type).
Figure 2.
Increased resistance to melanoma in ACE 10/10 mice. A: Mice shown in panels a, b, d, and e are three pairs of littermate mice 14 days after injection of B16-F10 melanoma cells. ACE 10/10 mice (10/10) consistently have dramatically smaller tumors than wild-type (WT) mice. c: Skin flaps and subcutaneous melanoma (arrow) from the mice pictured in a and b. B: ACE 10/10 (10/10), heterozygous (HZ), and WT mice were injected intradermally with B16-F10 melanoma cells (n = 11, 10, and 10). At 11 and 14 days after injection, tumor volume was measured. Mean values ± SEM are shown to the right of the individual data points. The P values at 14 days were: WT versus 10/10, P < 0.0005; WT versus HZ, P = 0.001; and HZ versus 10/10, P = 0.039. C: F2 WT and ACE 10/10 (10/10) mice were injected with B16-LS9 melanoma cells. Tumor size was measured as described above (n = 5, P < 0.02 at day 14). D: ACE 10/10 mice were mated with CD-1 mice, and heterozygous offspring were then bred to produce WT and ACE 10/10 mice. Mice were intradermally injected with B16-F10 melanoma cells and analyzed as described above (n = 10, P < 0.01 at day 14).
To see whether tumor resistance was unique to the B16-F10 cell line, we performed an identical experiment using a different strain of mouse melanoma cells called B16-LS9 (Figure 2C). These cells also produced much larger tumors in wild-type mice than in ACE 10/10. To this point, all experiments were performed in F2 generation mice, which are a genetic mix of 129 and C57BL/6 backgrounds. To understand further the ACE 10/10 phenotype, mice were bred with outbred CD-1 (Swiss) mice and then challenged with intradermal injection of B16-F10 melanoma cells (Figure 2D). Again, ACE 10/10 mice showed much smaller tumors than those observed in wild-type mice (ACE 10/10, 104 ± 33 mm3; wild type, 552 ± 134 mm3; P < 0.01). Thus, in different genetic backgrounds and challenged with different melanoma cell lines, ACE 10/10 mice showed a profound resistance to the growth of tumors. ACE 10/10 mice inbred to C57BL/6 are discussed below.
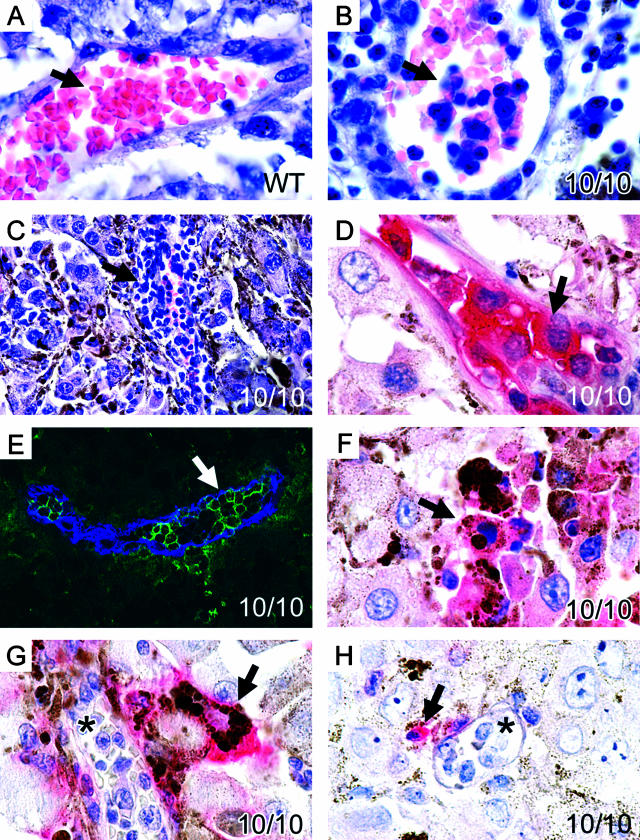
Insight into the mechanism operating in the ACE 10/10 mice was obtained by histologically examining tumors present in wild-type and ACE 10/10 animals (Figure 3). A major difference was in the quantity of inflammatory cells observed within the blood vessels of the tumors. Although tumors present in wild-type mice contain very few intravascular white blood cells (Figure 3A), these cells were abundant in ACE 10/10 tumor blood vessels (Figure 3B). At times, vessels were almost engorged by the white cell response (Figure 3C). Immunohistochemical analysis of tumors from ACE 10/10 mice showed that the vast majority of intravascular cells were strikingly positive for ACE expression (Figure 3D). Histologically, these cells resembled monocytes, and immunofluorescence showed that most of these cells stained for CD11b (Figure 3E). In addition, within the tumor were phagocytic cells that also stained intensely for ACE (Figure 3F). These cells histologically resembled macrophages, contained phagocytized melanin, and immunostained for F4/80 (Figure 3G). Finally, we identified some T cells (CD3-positive cells) within the 10/10 tumors (Figure 3H). Thus, histological analysis indicates a greater inflammatory response within the small tumors of ACE 10/10 mice.
Figure 3.
Enhanced inflammatory response to melanoma in ACE 10/10 mice. B16-F10 melanomas from a wild-type (A) and ACE 10/10 mice (B–H) were examined microscopically. The most impressive difference was in the quantity of inflammatory cells observed within the blood vessels of the tumor. Although tumors from wild-type mice contain very few intravascular white blood cells (A, arrow), these cells were abundant in ACE 10/10 tumor blood vessels (B, arrow). At times, vessels were almost engorged by a white cell response (C, arrow). Immunochemical analysis of tumors with an anti-ACE antibody (D) showed that the great majority of intravascular cells were strongly positive for ACE (the red pigment indicated by the arrow). Further, these cells stained with anti-CD11b, a monocyte/macrophage marker (E, anti-CD11b is green, whereas anti-CD31, an endothelial marker, is colored blue). Inflammatory cells were also found outside of blood vessels within the tumors of ACE 10/10 mice. These cells histologically resembled macrophages and contained phagocytized melanin. They stained intensely for ACE (F, group of pink cells indicated by the arrow). They also immunostained for the macrophage marker F4/80 (G, red cell indicated by arrow). As expected, monocytes within blood vessels (G, asterisk) did not stain for F4/80. Finally, some CD3+ T cells were found within the 10/10 tumors (H, red cell indicated by arrow). However, most cells within blood vessels were not lymphocytes but were monocytic (H, asterisk).
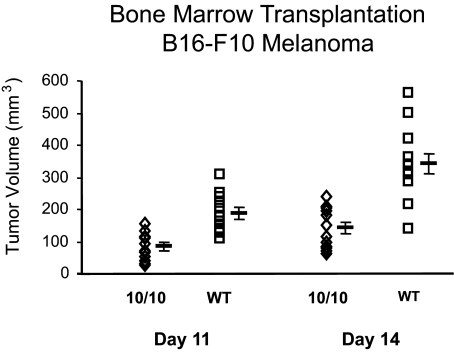
If an enhanced immune response is responsible for the increased tumor resistance of ACE 10/10 mice, then the transfer of bone marrow might endow a wild-type mouse with increased resistance to melanoma. This was tested by first back-breeding the ACE 10/10 mice to C57BL/6 mice for 7 generations. On average, such mice (termed F7) have genomes greater than 99% identical to C57BL/6. Bone marrow was harvested from littermate F7 wild type and F7 ACE 10/10 mice and engrafted into lethally irradiated C57BL/6 mice. After allowing for repopulation of the marrow, engraftment was checked by FACS analysis of blood leukocytes for CD11b and ACE expression. In addition, some recipient mice were a congenic strain of C57BL/6 having the CD45.1 allele, whereas all donor marrow was from mice with the CD45.2 allele. After engraftment, the recipient animals were checked by FACS for leukocyte CD45.1 and CD45.2 expression. Such analyses showed that by 8 weeks, virtually all myeloid cells and nearly all T cells were of donor origin. The engrafted C57BL/6 mice were then challenged by intradermal injection of B16-F10 cells, and at 2 weeks, tumor size was evaluated (Figure 4). These data showed a highly significant difference in tumor size between C57BL/6 mice receiving ACE 10/10 bone marrow versus wild-type bone marrow (ACE 10/10, 168 ± 22 mm3; wild type, 330 ± 29 mm3; P < 0.0005). Thus, transfer of ACE 10/10 bone marrow to wild-type recipients transferred significant resistance to melanoma growth.
Figure 4.
ACE 10/10 bone marrow transplantation confers tumor immunity. C57BL/6 mice were lethally irradiated and then immediately transplanted with bone marrow from either ACE 10/10 or littermate wild-type (WT) mice (n = 12 per group). After engraftment, the mice were challenged by intradermal injection of B16-F10 melanoma cells. Tumor volume was measured at 11 and 14 days after injection. Mean values ± SEM are shown to the right of the individual data points. On day 14, the P value was P < 0.0005.
ACE 10/10 mice have several differences from wild-type mice. Although the most obvious is increased ACE expression by macrophages and macrophage-like cells, ACE 10/10 mice also lack ACE expression by tissues such as endothelium. Such was not the case when all recipient mice were wild-type C57BL/6 with normal endothelial ACE expression (Figure 4). To address further the question of endothelial ACE, we implanted B16-F10 tumor into the skin of a different line of mice, termed ACE 3/3, which express ACE in the liver but completely lack endothelial ACE.11 Unlike ACE 10/10, these mice showed no difference from wild type in tumor growth (data not shown). Thus, the lack of endothelial ACE does not explain the resistance of ACE 10/10 mice to melanoma.
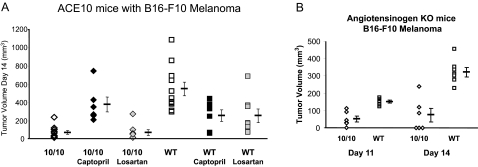
Angiotensin II is the most important product of ACE in a wild-type mouse, and most of the effects of angiotensin II are mediated by the AT1 receptor. To investigate the role of angiotensin II in the ACE 10/10 model, we studied six groups of mice implanted with B16-F10 melanoma: ACE 10/10, wild type, both ACE 10/10 and wild type treated with the ACE inhibitor captopril, and both ACE 10/10 and wild type treated with the AT1 receptor blocker losartan (Figure 5A). Both captopril (by blocking ACE) and losartan (by blocking the angiotensin II receptor) reduced systolic blood pressure from approximately 105 mm Hg to below 80 mm Hg. Wild-type mice treated with either captopril or losartan showed a slower growth of the tumor compared with untreated wild-type mice. Perhaps this was because of the effects of the acute and substantial blood pressure reduction during the 2-week assay. However, quite different results were seen with ACE 10/10 mice. Whereas these two drugs reduced the systolic blood pressure to an equivalent degree as seen in wild-type mice, the ACE 10/10 mice treated with captopril showed a more rapid growth of the melanoma as compared with untreated ACE 10/10 mice. In fact, there was no statistical difference in tumor growth between wild-type and ACE 10/10 mice when both groups were treated with captopril. In contrast, blocking the AT1 receptor of ACE 10/10 mice with losartan had no significant effect on B16-F10 tumor growth. Further, we have examined six mice that are angiotensinogen (agt)-knockout-ACE 10/10. Genetically eliminating agt makes it impossible to produce angiotensin II (and other angiotensin peptides). If angiotensin II was critical for the ACE 10/10 phenotype, then agt-ACE 10/10 mice should be equivalent to agt-ACE wild-type mice. However, as seen in Figure 5B, the agt-ACE 10/10 double knockout mice resisted B16-F10 tumors much more effectively than agt-ACE wild-type mice (P < 0.0005). Thus, the captopril experiments strongly suggest that it is the presence of ACE, and not its absence, that is important in the resistance of ACE 10/10 mice to melanoma growth. However, both pharmacological and genetic approaches suggest that angiotensin II is not the critical element in understanding the ACE 10/10 mice. As discussed below, we believe that resistance to melanoma in ACE 10/10 mice is mediated by immunological mechanisms and not by aberrant angiotensin II production.
Figure 5.
ACE is critical for tumor resistance. A: ACE 10/10 and wild-type (WT) mice were compared with mice receiving either 2 weeks of captopril or 2 weeks of losartan by minipump. One day after pump placement, mice were injected with B16-F10 melanoma cells in a location removed from the minipumps. Tumor size was measured 2 weeks after melanoma implantation. Mean values ± SEM are shown to the right of the individual data points. As determined using analysis of variance with Tukey’s honestly significantly different, there is a significant difference between ACE 10/10 (n = 12) and ACE 10/10 captopril (n = 6, P < 0.01). In contrast, there is no significant difference between ACE 10/10 and ACE 10/10 losartan (n = 8, P < 0.99). Further, there is no significant difference between ACE 10/10 captopril and either wild type, wild-type captopril, or wild-type losartan (n = 11, 6, 8; P < 0.39 or greater). B: All mice in this figure lack angiotensinogen expression. The ACE genotype is either ACE 10/10 (n = 6) or wild type (WT, n = 7). All mice were challenged by intradermal injection of B16-F10 melanoma cells. Tumor volume was measured at 11 and 14 days after injection. Mean values ± SEM are shown to the right of the individual data points. On day 14, the P value was P < 0.0005.
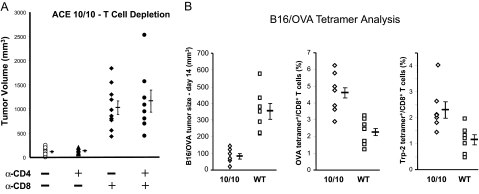
To understand the immune response in ACE 10/10 mice, we infused these mice with monoclonal antibodies directed at either CD4+ or CD8+ T cells. This manipulation eliminated greater than 90% of the appropriate T cells while not greatly affecting the CD11b+ cells. ACE 10/10 mice lacking CD8+ T cells are highly susceptible to B16-F10 tumor growth (Figure 6A). Indeed, at 14 days, tumors in ACE 10/10 mice lacking CD8+ T cells averaged nine times greater than tumors in control ACE 10/10 mice (ACE 10/10 depleted of CD8+ T cells, 1026 ± 140 mm3; ACE 10/10 treated with control antisera, 114 ± 20 mm3). In contrast, when ACE 10/10 mice were depleted of only CD4+ T cells, there was no effect on tumor growth.
Figure 6.
T cells in ACE 10/10 mice. A: ACE 10/10 mice were depleted of CD4 or CD8 T cells by intraperitoneal injections of rat monoclonal antibody as indicated in the figure. Control mice received equivalent injections of class-matched rat IgG. FACS analysis showed that the monoclonal antibodies depleted more than 90% of the targeted T cells. The mice were challenged by intradermal injection of B16-F10 melanoma cells, and tumor size was measured on day 14. Mean values ± SEM are shown to the right of the individual data points (n = at least 8 for each group). B: ACE 10/10 or control mice were intradermally injected with B16/OVA and tumor size was measured on day 14 (left panel). Peripheral blood was also analyzed by FACS using anti-CD8 antibody and tetramers containing the peptide epitopes OVA257–264 (middle panel) and TRP-2180–188 (right panel). Data are reported as the percentage of CD8+ cells that also stained for the individual tetramers (n = 7 for each group).
CD8+ T cells become activated when their T cell receptors recognize peptides presented within major histocompatibility complex class I proteins. To measure tumor-reactive T cells, both ACE 10/10 and littermate wild-type mice were intradermally injected with B16/OVA cells, which is a B16 melanoma line (B16-F1) stably altered to produce ovalbumin.18 Tumor size was measured on day 14 and again showed enhanced tumor resistance in ACE 10/10 mice as compared with wild type (Figure 6B, left panel). We also measured the number of blood CD8+ T cells recognizing known immunodominant epitopes by using tetramer reagents and FACS analysis.19 One such epitope reported for the B16 melanoma is the tyrosinase-related protein 2 (TRP-2) peptide SVYDFFVWL (TRP-2180–188).20 In addition, we measured the frequency of CD8+ T cells recognizing the ovalbumin epitope SIINFEKL (OVA257–264). For both epitopes, there was a highly significant increase in the frequency of CD8+ tetramer+ T cells in ACE 10/10 mice (Figure 6B, center and right panels, P < 0.01 for both TRP-2180–188 and OVA257–264). The data in Figure 6 strongly suggest that ACE 10/10 mice have an enhanced immune response to B16 melanoma due, at least in part, to increased expansion of tumor epitope-specific T cells.
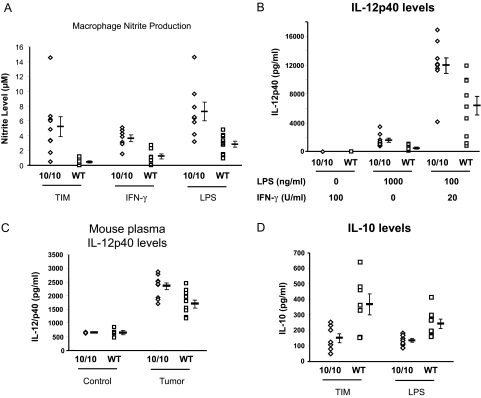
ACE 10/10 mice also show a different phenotype of effector molecule and cytokine production compared with wild-type mice. To examine this, we first developed a straightforward way to obtain relatively pure “tumor-induced macrophages.” The protocol was to inject F7 mice intradermally with 3 × 10⁵ B16 melanoma cells. Eight days later, 5 × 10⁵ melanoma cells were injected into the peritoneum. Four days later (day 12), the mice were sacrificed, and collected peritoneal cells were adhered to plastic to isolate macrophages. These cells were washed and then cultured for 24 hours without any additional stimulation. At that point, we measured the nitrite levels (a stable end product of nitric oxide) in the culture medium (Figure 7A).21 This showed that ACE 10/10 macrophages increased the levels of nitrite produced by wild-type cells by greater than 10-fold (ACE 10/10, 5.22 ± 1.4 μmol/L; wild type, 0.42 ± 0.1 μmol/L; P < 0.01).
Figure 7.
Nitrite and cytokine response of ACE 10/10 mice. A: Tumor-induced macrophages (TIM) were obtained from ACE 10/10 or wild-type (WT) mice as described in Results. These were cultured for 24 hours, and nitrite levels were measured in the culture media using the Griess reagent. Macrophages from ACE 10/10 and wild-type mice were also obtained after thioglycollate injection into the peritoneum. After culture overnight, the cells were treated with either IFN-γ (100 U/ml) or LPS (1 μg/ml) for 24 hours, and nitrite levels were measured in the culture media. Mean values ± SEM are shown to the right of the individual data points (n = at least 7 for each group, P < 0.01 for each of the three panels). B: TIM were obtained from ACE 10/10 or WT mice as described in Results. These were adhered to plastic and rested for 16 hours. They were then cultured for an additional 24 hours in the presence of either IFN-γ or LPS as indicated. Finally, IL-12 levels were measured in the culture media (n = 10, P < 0.005 for LPS and LPS/IFN-γ). C: IL-12 levels in plasma were measured in mice without tumors (Control) or 14 days after skin implantation of B16 melanoma (Tumor) (n = 4 for each Control group; n = 10 for each Tumor group). Although ACE 10/10 and wild-type mice free of tumors have no apparent difference in plasma IL-12 levels, mice with tumors do show a difference, with higher plasma levels present in ACE 10/10 mice. D: TIM were obtained from ACE 10/10 or WT mice. These were adhered to plastic and cultured for 6 hours, and IL-10 levels in the supernatants were then measured by enzyme-linked immunosorbent assay. Lower IL-10 was present in supernatants from ACE 10/10 macrophages compared with supernatants from wild-type macrophages. Thioglycollate-induced macrophages were also collected from mice without tumors. These were cultured for 6 hours with 1000 ng/ml LPS. Again, the supernatants from ACE 10/10 macrophages contained significantly less IL-10 (ACE 10/10, 133 ± 13 pg/ml; wild type, 242 ± 30 pg/ml, n = 8, P < 0.01).
One may argue that the above experiment reflects enhanced in vivo immune activation due to several possible mechanisms. So to study a simpler system, macrophages from F7 wild-type and ACE 10/10 mice (without any exposure to tumor) were collected 4 days after peritoneal instillation of thioglycollate. The cells were then cultured without additional stimulation for 16 hours. Finally, either interferon (IFN)-γ or LPS was added for 24 hours, and nitrite levels were measured (Figure 7A, center and right). In the absence of stimulation, no nitrites were detected. However, in response to either IFN-γ or LPS, ACE 10/10 macrophages produced significantly more nitrites than cells from wild-type mice. For example, in response to IFN-γ, ACE 10/10 cells averaged 3.6 ± 0.5 μmol/L, whereas wild-type cells averaged 1.2 ± 0.4 μmol/L (P < 0.005).
We also measured IL-12 production. For this, tumor-induced macrophages were prepared as described above. On day 12 of the protocol, the peritoneal macrophages were adhered to plastic and treated for 24 hours with LPS, IFN-γ, or the combination LPS/IFN-γ. An enzyme-linked immunosorbent assay was then used to measure IL-12p40 levels in the culture media. Without stimulation, or with the addition of just IFN-γ, no IL-12p40 was found (Figure 7B). With either LPS alone or LPS and IFN-γ, ACE 10/10 macrophages produced substantially more cytokine than control macrophages. For example, LPS/INF-γ induced 11,939 ± 1054 pg/ml IL-12p40 from ACE 10/10 macrophages but only 6389 ± 1289 pg/ml from control macrophages (P < 0.005).
The above experiments showed that ACE 10/10 macrophages respond to a variety of stimuli with enhanced IL-12 production. This question was also evaluated in ACE 10/10 and wild-type mice by measuring plasma levels of IL-12p40 (Figure 7C). Without tumors, there was no difference in plasma levels of this protein (ACE 10/10, 661 ± 11 pg/ml; wild type, 659 ± 80 mg/ml, n = 4 for each group). However, 14 days after the intradermal implantation of B16 melanoma, ACE 10/10 mice averaged 2346 ± 123 pg/ml plasma IL-12p40 compared with 1704 ± 146 pg/ml plasma IL-12p40 for wild-type mice (n = 10 for each group, P < 0.005).
In studying nitrites and IL-12, we focused on molecules associated with immune activation. In contrast, IL-10 is associated with immune suppression.22 To examine this in the ACE 10/10 system, we prepared tumor-induced macrophages, as previously described, in F7 mice bearing B16 melanoma. We also prepared macrophages from mice without tumor by collecting peritoneal macrophages in response to thioglycollate. The tumor-induced macrophages were cultured without further stimulation, whereas the thioglycollate-induced cells were stimulated with 1000 ng/ml LPS. After 6 hours, the culture supernatants were collected and IL-10 levels determined by enzyme-linked immunosorbent assay. As shown in Figure 7D, ACE 10/10 macrophages produced less IL-10 than wild-type cells, either in response to tumor or after LPS challenge. For example, tumor-induced macrophages from ACE 10/10 mice averaged 148 ± 30 pg/ml IL-10; equivalently prepared cells from wild-type mice averaged 366 ± 67 pg/ml (n = 7, P < 0.02). Thus, macrophages from ACE 10/10 mice respond to stimuli with increased numbers of tumor-specific T cells, and a different phenotype of cytokines and effector molecules compared with macrophages from wild-type mice.
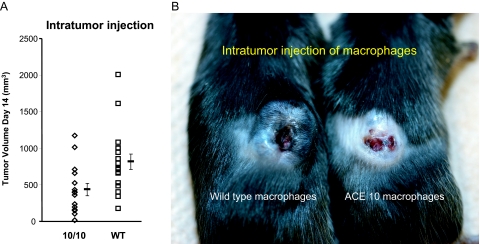
If ACE 10/10 macrophages demonstrate enhanced immune activation, then the transfer of such cells should confer a clinical advantage. As previously discussed in Figure 4, bone marrow transplantation with ACE 10/10 bone marrow did just this. In addition, we tried a simpler protocol where wild-type C57BL/6 mice were implanted intradermally with B16-F10 melanoma. After 7 days, all animals had a small skin tumor. Each animal then received a single intratumor injection of 2 × 10⁶ macrophages from either ACE 10/10 or littermate wild-type mice. These macrophages were derived from bone marrow and harvested from donor mice without any exposure to tumor. The marrow was induced to expand and differentiate into a pure population of macrophages by culture with conditioned media.15 Seven days after macrophage injection (day 14 of the experiment), tumor size was measured (Figure 8A). Mice receiving intratumor injections of ACE 10/10 macrophages had significantly smaller tumors than animals receiving an equivalent injection of wild-type macrophages (ACE 10/10, 435 ± 86 mm3 versus control, 816 ± 104 mm3; P < 0.01). Although results varied among individual animals, the transfer of ACE 10/10 macrophages sometimes produced very dramatic involution of tumors, as seen in Figure 8B.
Figure 8.
Intratumor injection of macrophages. A: C57BL/6 mice were implanted with tumor. On day 7, the tumors were injected with either 2 × 10⁶ macrophages from ACE 10/10 or littermate wild-type (WT) mice. Tumor size was measured on day 14. Mean values ± SEM are shown to the right of the individual data points (n = at least 15 for each group, P < 0.01). B: A picture of two mice treated as described in A. The mouse on the left was injected with wild-type macrophages, whereas the animal on the right was injected with ACE 10/10 macrophages.
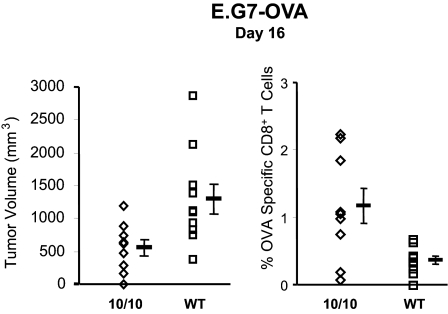
Finally, we studied the immune response of F7 ACE 10/10 mice to one other tumor besides melanoma. This was E.G7-OVA, an ovalbumin-expressing derivative of the mouse lymphoma line EL4.23 The protocol was to inject 3 × 10⁵ tumor cells subcutaneously and then measure both tumor nodule size and blood CD8+ tetramer+ cells for SIINFEKL. Similar to what was noted with melanoma, ACE 10/10 mice had slower growth of the E.G7-OVA tumor and a higher frequency of CD8+ tetramer+ cells than littermate wild-type mice (Figure 9). These data suggest that the enhanced immune response of ACE 10/10 mice is not limited to only B16 melanoma.
Figure 9.
Increased resistance to E.G7-OVA in ACE 10/10 mice. E.G7-OVA, an ovalbumin-expressing derivative of the mouse lymphoma line EL4, was injected into the subcutaneous tissue of either ACE 10/10 or wild-type mice. At day 16, the size of the tumor nodule was measured (left panel). Peripheral blood was also analyzed by FACS using anti-CD8 antibody and tetramers containing the peptide epitopes OVA257–264 (right panel). Data are reported as the percentage of CD8+ tetramer+ cells. Mean values ± SEM are shown to the right of the individual data points (n = at least 9 mice for each group, P = 0.01 for the left panel and P < 0.02 for the right panel).
Discussion
The study of tumor growth in ACE 10/10 mice was stimulated by articles suggesting that blockade of ACE or the AT1 receptor may reduce tumor growth, perhaps through effects on tumor angiogenesis.24,25,26 To our surprise, the ACE 10/10 mice did not show accelerated tumor growth but a consistent and marked resistance to tumor proliferation. We believe that the antitumor effect observed in ACE 10/10 mice is due to ACE overexpression by macrophages and macrophage-lineage cells: only these cells express ACE in ACE 10/10 mice, ACE inhibition eliminates the effect, and the effect is transferable into wild-type mice through bone marrow transplantation.
ACE 10/10 mice markedly overexpress ACE in macrophages and macrophage-like cells. This is true because these cells make substantial ACE, but it is also true because macrophages from wild-type mice typically make little ACE (see Figure 1C). The marked overexpression of ACE in ACE 10/10 mice is almost pharmacological, and the behavior of this model has little bearing on the immunological resistance of humans treated with ACE inhibitors. To our knowledge, no one has found that patients treated with ACE inhibitors were immunocompromised by the therapy.
In this article, we demonstrate that ACE 10/10 mice respond to B16 challenge with an enhanced immune response. There is an increased frequency of tumor-specific CD8+ lymphocytes and evidence of increased cytokines such as IL-12 and effector molecules such as nitric oxide. The result is much slower growth of the tumors. In recent years, some scientists have emphasized that the response of macrophages to tumor challenge can be broadly classified along two major pathways.27,28 One pathway produces what is referred to as “classical” macrophage activation. Such macrophages are characterized by a high capacity to present antigen, high IL-12 production, and high production of nitric oxide and other reactive intermediates. Macrophages with this phenotype, often referred to as M1, are the cells that are thought to participate in eliminating microorganisms and in killing tumor cells.
It has also been recognized that in an inflammatory response, there is often a resolution phase in which macrophages have a different set of developmental characteristics.29 These “alternatively activated” or M2 macrophages are described as hyporesponsive to proinflammatory stimuli and often show enhanced IL-10 production. Such cells participate in debris salvaging and wound healing. It is also thought that some tumor-associated macrophages resemble M2 macrophages in their behavior and that these macrophages may promote tumor growth.30 Thus, a simplistic but perhaps useful way of looking at the role of macrophages in tumor immunity is as a balance between M1 macrophages that destroy tumors and M2 tumor-associated macrophages that tend to promote tumor growth.
The concept of M1 and M2 macrophages is relevant to the ACE 10/10 model. These mice respond to melanoma with increased numbers of tumor-specific CD8+ cells, increased macrophage IL-12, increased nitric oxide, and decreased IL-10, all characteristics indicating a tilt toward a classically activated (M1) phenotype. The exaggerated propensity to express the phenotypic markers of the M1 developmental pathway provide a partial explanation for the enhanced tumor resistance of ACE 10/10 mice.
Of course, a major question is how the overexpression of the peptidase ACE leads to a phenotypic change in macrophages. We examined whether the ACE 10/10 phenotype was due to angiotensin II, the classical end product of ACE. Although an ACE inhibitor reversed the ACE 10/10 phenotype, inhibition of the major angiotensin II receptor, the AT1 receptor, had no such effect. In addition, we created ACE 10/10 mice that also genetically lacked the ability to produce angiotensinogen. Here, the control mice were wild type for ACE expression but also lacked angiotensinogen. If angiotensin II was a critical player in the ACE 10/10 phenotype, we would expect that the loss of angiotensinogen would have rendered these mice susceptible to B16 tumor growth. In fact, ACE 10/10 mice lacking angiotensinogen were substantially more resistant to tumor growth than the control mice. Thus, two separate approaches suggest that the underlying behavior of ACE 10/10 mice is not critically dependent on angiotensin II.
Certainly, one of the major functional roles of macrophages is the presentation of peptides. Can ACE, a rather nonspecific peptidase, play a role in this process? Our group has no direct evidence for or against this hypothesis. However, Eisenlohr et al31 overexpressed ACE in fibroblasts and then used vaccinia viral infection as a method to transfect these cells with DNA encoding influenza peptides or pro-peptide precursors. Peptide trimming and major histocompatibility complex class I presentation to influenza-sensitive CD8+ CTL was measured by a chromium release/cell killing assay. Specifically, this study asked if the overexpression of ACE could convert pro-peptides, including a 12-amino acid nucleoprotein peptide not recognized by CTL, into nine- or 10-amino acid peptides detected by the CTL T-cell receptor. The answer was yes, and in establishing this, Eisenlohr et al31 provided evidence that ACE, acting internally at the endoplasmic reticulum, could trim precursor peptides into a size optimal for loading, presentation, and CTL recognition. In the future, our group hopes to study whether such a mechanism can enhance antigen presentation in ACE 10/10 macrophages, perhaps providing a partial explanation for the ACE 10/10 phenotype.
However, it is likely that the effects of ACE overexpression may be due to more than one mechanism. This is suggested by experiments in Figure 7A, which examined nitrite expression of cultured ACE 10/10 macrophages exposed to LPS. These experiments found clear differences in the expression of nitrites between cells from ACE 10/10 mice and control animals. What makes this in vitro experiment notable is that it was performed in cells from animals lacking any exposure to tumor. The lack of tumor antigens suggests intrinsic differences in the behavior of ACE 10/10 macrophages in response to LPS, an agent that acts through well described cell surface receptors.32 Thus, the overexpression of ACE may change the fundamental phenotype of how ACE 10/10 macrophages respond to a stimulus such as LPS.
In summary, ACE 10/10 mice exhibit enhanced resistance to melanoma (B16-F10, B16-LS9, and B16-F1) and lymphoma (EL4). Macrophages from these mice respond to stimuli with an enhanced classically activated (M1) phenotype, including increased numbers of specific CD8+ cells, increased IL-12, and decreased IL-10. If the study of ACE 10/10 mice leads to a means of enhancing immunity, this may be useful in a variety of human clinical situations.
Acknowledgments
We thank Dr. Xinjian Chen, Dr. David Archer, and Ms. Giji Joseph for technical assistance. We also thank Dr. David Hume for providing the c-fms promoter cassette, Dr. Hans Grossniklaus for providing the B16-LS9 cell line, Dr. Edith Lord for providing the B16/OVA cell line, and Dr. Kyle McKenna for providing the E.G7-OVA cell line. Mr. Robert Santoianni kindly provided assistance in figure preparation. We also thank Dr. Kristen Frenzel and Ms. Ellen Bernstein. This article is written in memory of Dr. Liliane Striker, who died in November, 2004.
Footnotes
Address reprint requests to Kenneth E. Bernstein, M.D., Rm 7107A WMB, 101 Woodruff Circle, Emory University, Atlanta, GA 30322. E-mail: kbernst@emory.edu.
Supported by National Institutes of Health grants R37 DK039777, R01 DK051445, and R01 DK055503. P.L. is supported by a Postdoctoral Fellowship from the American Heart Association. S.F. is supported by a Beginning grant-in-aid, and H.D.X. is supported by a Scientist Development grant from the American Heart Association.
References
- Corvol P, Williams TA, Soubrier F. Peptidyl dipeptidase A: angiotensin I-converting enzyme. Methods Enzymol. 1995;248:283–305. doi: 10.1016/0076-6879(95)48020-x. [DOI] [PubMed] [Google Scholar]
- Bernstein KE, Xiao HD, Frenzel K, Li P, Shen XZ, Adams JW, Fuchs S. Six truisms concerning ACE and the renin-angiotensin system. Circ Res. 2005;96:1135–1144. doi: 10.1161/01.RES.0000169536.73576.66. [DOI] [PubMed] [Google Scholar]
- Nakagawa Y, Takeshita T, Berzofsky JA, Takahashi H. Analysis of the mechanism for extracellular processing in the presentation of human immunodeficiency virus-1 envelope protein-derived peptide to epitope-specific cytotoxic T lymphocytes. Immunology. 2000;101:76–82. doi: 10.1046/j.1365-2567.2000.00092.x. [DOI] [PMC free article] [PubMed] [Google Scholar]
- Kozlowski S, Corr M, Takeshita T, Boyd LF, Pendleton CD, Germain RN, Berzofsky JA, Margulies DH. Serum angiotensin-1 converting enzyme activity processes a human immunodeficiency virus 1 gp160 peptide for presentation by major histocompatibility complex class I molecules. J Exp Med. 1992;75:1417–1422. doi: 10.1084/jem.175.6.1417. [DOI] [PMC free article] [PubMed] [Google Scholar]
- Metzger R, Bohle RM, Chumachenko P, Danilov SM, Franke FE. CD143 in the development of atherosclerosis. Atherosclerosis. 2000;150:21–31. doi: 10.1016/s0021-9150(99)00354-8. [DOI] [PubMed] [Google Scholar]
- Leehey DJ, Singh AK, Alavi N, Singh R. Role of angiotensin II in diabetic nephropathy. Kidney Int Suppl. 2000;77:S93–S98. doi: 10.1046/j.1523-1755.2000.07715.x. [DOI] [PubMed] [Google Scholar]
- Wei L, Alhenc-Gelas F, Corvol P, Clauser E. The two homologous domains of human angiotensin I-converting enzyme are both catalytically active. J Biol Chem. 1991;266:9002–9008. [PubMed] [Google Scholar]
- Langford KG, Shai SY, Howard TE, Kovac MJ, Overbeek PA, Bernstein KE. Transgenic mice demonstrate a testis-specific promoter for angiotensin-converting enzyme. J Biol Chem. 1991;266:15559–15562. [PubMed] [Google Scholar]
- Krege JH, John SW, Langenbach LL, Hodgin JB, Hagaman JR, Bachman ES, Jennette JC, O’Brien DA, Smithies O. Male-female differences in fertility and blood pressure in ACE-deficient mice. Nature. 1995;375:146–148. doi: 10.1038/375146a0. [DOI] [PubMed] [Google Scholar]
- Esther CR, Jr, Howard TE, Marino EM, Goddard JM, Capecchi MR, Bernstein KE. Mice lacking angiotensin-converting enzyme have low blood pressure, renal pathology, and reduced male fertility. Lab Invest. 1996;74:953–965. [PubMed] [Google Scholar]
- Cole J, Quach DL, Sundaram K, Corvol P, Capecchi MR, Bernstein KE. Mice lacking endothelial angiotensin-converting enzyme have a normal blood pressure. Circ Res. 2002;90:87–92. doi: 10.1161/hh0102.102360. [DOI] [PubMed] [Google Scholar]
- Himes SR, Tagoh H, Goonetilleke N, Sasmono T, Oceandy D, Clark R, Bonifer C, Hume DA. A highly conserved c-fms gene intronic element controls macrophage-specific and regulated expression. J Leukoc Biol. 2001;70:812–820. [PubMed] [Google Scholar]
- Sasmono RT, Oceandy D, Pollard JW, Tong W, Pavli P, Wainwright BJ, Ostrowski MC, Himes SR, Hume DA. A macrophage colony-stimulating factor receptor-green fluorescent protein transgene is expressed throughout the mononuclear phagocyte system of the mouse. Blood. 2003;101:1155–1163. doi: 10.1182/blood-2002-02-0569. [DOI] [PubMed] [Google Scholar]
- Wang J, Sun L, Myeroff L, Wang X, Gentry LE, Yang J, Liang J, Zborowska E, Markowitz S, Willson JKV, Grattain MG. Demonstration that mutation of the type II transforming growth factor beta receptor inactivates its tumor suppressor activity in replication error-positive colon carcinoma cells. J Biol Chem. 1995;270:22044–22049. doi: 10.1074/jbc.270.37.22044. [DOI] [PubMed] [Google Scholar]
- Davies JQ, Gordon S. Isolation and culture of murine macrophages. Methods Mol Biol. 2005;290:91–103. doi: 10.1385/1-59259-838-2:091. [DOI] [PubMed] [Google Scholar]
- Cole JM, Xiao H, Adams JW, Disher KM, Zhao H, Bernstein KE. New approaches to genetic manipulation of mice: tissue-specific expression of ACE. Am J Physiol. 2003;284:F599–F607. doi: 10.1152/ajprenal.00308.2002. [DOI] [PubMed] [Google Scholar]
- Fidler IJ, Nicolson GL. Organ selectivity for implantation survival and growth of B16 melanoma variant tumor lines. J Natl Cancer Inst. 1976;57:1199–1202. doi: 10.1093/jnci/57.5.1199. [DOI] [PubMed] [Google Scholar]
- Brown DM, Fisher TL, Wei C, Frelinger JG, Lord EM. Tumours can act as adjuvants for humoral immunity. Immunology. 2001;102:486–497. doi: 10.1046/j.1365-2567.2001.01213.x. [DOI] [PMC free article] [PubMed] [Google Scholar]
- Altman JD, Moss PA, Goulder PJ, Barouch DH, McHeyzer-Williams MG, Bell JI, McMichael AJ, Davis MM. Phenotypic analysis of antigen-specific T lymphocytes. Science. 1996;274:94–96. doi: 10.1126/science.274.5284.94. [DOI] [PubMed] [Google Scholar]
- Harada M, Tamada K, Abe K, Li T, Onoe Y, Tada H, Tatsugami K, Ando T, Kimura G, Nomoto K. Characterization of B16 melanoma-specific cytotoxic T lymphocytes. Cancer Immunol Immunother. 1998;47:198–204. doi: 10.1007/s002620050521. [DOI] [PMC free article] [PubMed] [Google Scholar]
- Nagano T. Practical methods for detection of nitric oxide. Luminescence. 1999;14:283–290. doi: 10.1002/(SICI)1522-7243(199911/12)14:6<283::AID-BIO572>3.0.CO;2-G. [DOI] [PubMed] [Google Scholar]
- Wan YY, Flavell RA. The roles for cytokines in the generation and maintenance of regulatory T cells. Immunol Rev. 2006;212:114–130. doi: 10.1111/j.0105-2896.2006.00407.x. [DOI] [PubMed] [Google Scholar]
- Moore MW, Carbone FR, Bevan MJ. Introduction of soluble protein into the class I pathway of antigen processing and presentation. Cell. 1988;54:777–785. doi: 10.1016/s0092-8674(88)91043-4. [DOI] [PubMed] [Google Scholar]
- Egami K, Murohara T, Shimada T, Sasaki K, Shintani S, Sugaya T, Ishii M, Akagi T, Ikeda H, Matsuishi T, Imaizumi T. Role of host angiotensin II type 1 receptor in tumor angiogenesis and growth. J Clin Invest. 2003;112:67–75. doi: 10.1172/JCI16645. [DOI] [PMC free article] [PubMed] [Google Scholar]
- Lindberg H, Nielsen D, Jensen BV, Eriksen J, Skovsgaard T. Angiotensin converting enzyme inhibitors for cancer treatment? Acta Oncol. 2004;43:142–152. doi: 10.1080/02841860310022346. [DOI] [PubMed] [Google Scholar]
- Deshayes F, Nahmias C. Angiotensin receptors: a new role in cancer? Trends Endocrinol Metab. 2005;16:293–299. doi: 10.1016/j.tem.2005.07.009. [DOI] [PubMed] [Google Scholar]
- Mantovani A, Sica A, Locati M. Macrophage polarization comes of age. Immunity. 2005;23:344–346. doi: 10.1016/j.immuni.2005.10.001. [DOI] [PubMed] [Google Scholar]
- Gordon S, Taylor PR. Monocyte and macrophage heterogeneity. Nat Rev Immunol. 2005;5:953–964. doi: 10.1038/nri1733. [DOI] [PubMed] [Google Scholar]
- Gordon S. Alternative activation of macrophages. Nat Rev Immunol. 2003;3:23–35. doi: 10.1038/nri978. [DOI] [PubMed] [Google Scholar]
- Rauh MJ, Ho V, Pereira C, Sham A, Sly LM, Lam V, Huxham L, Minchinton AI, Mui A, Krystal G. SHIP represses the generation of alternatively activated macrophages. Immunity. 2005;23:361–374. doi: 10.1016/j.immuni.2005.09.003. [DOI] [PubMed] [Google Scholar]
- Eisenlohr LC, Bacik I, Bennink JR, Bernstein K, Yewdell JW. Expression of a membrane protease enhances presentation of endogenous antigens to MHC class I-restricted T lymphocytes. Cell. 1992;71:963–972. doi: 10.1016/0092-8674(92)90392-p. [DOI] [PubMed] [Google Scholar]
- Shizuo A. Toll-like receptor signaling. J Biol Chem. 2003;278:38105–38108. doi: 10.1074/jbc.R300028200. [DOI] [PubMed] [Google Scholar]


