

Abstract
Epstein-Barr virus (EBV) escapes host immunity by the reversible and epigenetic silencing of immunogenic viral genes. We previously presented evidence that a dynamic chromatin domain, which we have referred to as the latency control region (LCR), contributes to the reversible repression of EBNA2 and LMP1 gene transcription. We now explore the protein-DNA interaction profiles for a few known regulatory factors and histone modifications that regulate LCR structure and activity. A chromatin immunoprecipitation assay combined with real-time PCR analysis was used to analyze protein-DNA interactions at ∼500-bp intervals across the first 60,000 bp of the EBV genome. We compared the binding patterns of EBNA1 with those of the origin recognition complex protein ORC2, the chromatin boundary factor CTCF, the linker histone H1, and several histone modifications. We analyzed three EBV-positive cell lines (MutuI, Raji, and LCL3459) with distinct transcription patterns reflecting different latency types. Our findings suggest that histone modification patterns within the LCR are complex but reflect differences in each latency type. The most striking finding was the identification of CTCF sites immediately upstream of the Qp, Cp, and EBER transcription initiation regions in all three cell types. In transient assays, CTCF facilitated EBNA1-dependent transcription activation of Cp, suggesting that CTCF coordinates interactions between different chromatin domains. We also found that histone H3 methyl K4 clustered with CTCF and EBNA1 at sites of active transcription or DNA replication initiation. Our findings support a model where CTCF delineates multiple domains within the LCR and regulates interactions between these domains that correlate with changes in gene expression.
Epstein-Barr virus (EBV) is a human gammaherpesvirus that has been linked causally to several human malignancies, including Burkitt's lymphoma, Hodgkin's disease, nasopharyngeal carcinoma, and lymphoproliferative disorders in the immunosuppressed (32, 53). Cell lines derived from EBV-associated tumors or EBV-immortalized primary B lymphocytes typically carry genomes as chromatin-associated, multicopy episomes that rarely produce viral particles but do express several viral genes essential for viral genome persistence and cell survival in the infected host. The different patterns of viral gene expression found during latency are referred to as latency types, and these latency types correlate with cellular context and tumor classification (63, 72). Latency type switching provides the virus with a strategy to stimulate B-cell proliferation and subsequently avoid host immune detection and elimination of infected cells (62). Latency type selection is known to be influenced by cell-specific transcription factors as well as by epigenetic events, including DNA methylation, histone modifications, and chromatin organization (3, 12, 17, 27, 43).
Upon primary infection of B lymphocytes, EBV latency transcription initiates at one or more of the multiple Wp promoters found within the long internal W repeat (70). Wp drives the expression of the multicistronic message encoding EBNA1, EBNA2, and EBNA3A-C (7, 57). Once EBNA1 and EBNA2 are sufficiently expressed, transcription initiation switches to the Cp, and Wp expression is extinguished (56, 69, 70). Stable expression of EBNA2 is sufficient to maintain a type III latency in which the full set of latency gene products (EBNA1, EBNA2, EBNA3A, EBNA3B, EBNA3C, EBNA-LP, LMP1, LMP2, EBERs, BARTs, and microRNAs) is expressed. Latency type III is observed in EBV-immortalized lymphoblastoid cell lines and in EBV-associated non-Hodgkin's lymphomas found in immunosuppressed individuals (71). In healthy adult carriers, type III latency stimulates a potent immune response, and cells expressing these viral antigens are eliminated by the immune system. Through an incompletely understood mechanism, Cp gene expression can be silenced and Qp expression activated to establish a type I latent infection, in which only EBNA1 is expressed (45, 55). This latency type persists in memory B cells but can also be found in Burkitt's lymphoma tissue and derived cell lines (5). Type I latency is thought to be essential for EBV survival in hosts with healthy immune systems (62). DNA methylation of key regulatory elements within the Cp correlates with transcription repression during type I latency (47). However, the kinetics of DNA methylation revealed that this event occurs subsequent to transcriptional repression, suggesting that DNA methylation maintains but does not initiate the switch from type III to type I gene expression (27).
Transcription of the Cp and LMP1 promoters is also regulated by the EBNA1-dependent enhancer activity of OriP (2, 44, 49, 52, 60). EBNA1 is a virus-encoded DNA binding protein that supports plasmid maintenance and stimulates DNA replication from OriP (31, 38). OriP consists of a family repeat element (FR) and a dyad symmetry element (DS), both of which contain EBNA1 binding sites (59, 66). In addition to the binding sites at OriP, EBNA1 also binds to a region near the transcription initiation site of Qp as well as to an alternative replication initiation site at Rep* (51, 65). Genetic evidence suggests that the FR of OriP, upon binding by EBNA1, can function as an enhancer to regulate DNA methylation and transcription activity of the EBNA2 and LMP1 genes (21, 44, 49, 52, 60). It has been proposed that OriP and EBNA1 can influence the DNA methylation patterns at the EBNA2 promoter region by a DNA replication-independent mechanism (26). EBNA1 can also repress Qp transcription in type III cells (61). EBNA1-dependent activation of Cp is essential for establishment of type III gene expression and the immortalization of primary B lymphocytes (2). The precise mechanism governing EBNA1 transcription activation of Cp in type III latency and the activation of Qp in type I latency is not completely understood.
Histone tail modifications and higher-order chromatin structure may be one mechanism that regulates transcription patterns associated with different latency types (11, 67). The EBV genome is known to be generally associated with regularly spaced nucleosomes during latency, similar to bulk cellular DNA (16, 68). Both cellular and viral chromatin can be organized into domains characterized by distinct histone modifications (29). Chromatin domains with active transcription are typically characterized by high acetylation of histones H3 and H4 and high methylation of lysine 4 on histone H3 (29, 58). Chromatin domains which are nonpermissive for transcription are typically characterized by little acetylation of histones H3 and H4 and high methylation of histone H3 K9 (but not histone H3 K4). However, more complex patterns of overlapping repressive and active modifications have been observed for several transcribed genes in higher eukaryotes (64). Our previous studies have indicated that the EBV latency control region (LCR) is enriched in histone H3 methyl K4 and that the expansion of this modification to the Cp from OriP correlates with Cp activation in type III latency (12, 13).
Dynamic changes in chromatin organization may be mediated by insulator elements and chromatin boundary factors (22). The cellular factor CTCF, or CCCTC-binding factor, has been implicated as a central regulator of chromatin boundary elements (46). CTCF was originally found as a repressor of the c-myc oncogene but was later characterized to be involved in enhancer blocking, chromatin insulation, and imprinting on diverse genes, such as the β-globin, c-Myc, and Igf2-H19 genes (19, 74). CTCF is a DNA binding protein containing 11 zinc fingers that can recognize a variety of dissimilar target sites spanning approximately 50 bp (30). Our previous studies found that a CTCF site was located between OriP and Cp and that CTCF bound more efficiently in type I latency, where Cp transcription was inactive (13). This led us to propose the model that CTCF is a key regulator of type I latency. However, these earlier studies were limited by an examination of only a small subset of sites on the EBV genome and therefore were not a comprehensive examination of CTCF binding sites on the EBV genome.
In this study, we looked for histone modification and protein-DNA binding patterns throughout the EBV LCR for different latency types. We present evidence that histone modification patterns reflect functional differences of the latency types and that chromatin boundary factors, such as CTCF and EBNA1, may orchestrate these different modification patterns. Our findings support a role for CTCF and EBNA1 as chromatin organizing elements and suggest that histone modification patterns may be a useful tool for characterizing latency programs and host cell identity.
MATERIALS AND METHODS
Cell lines and antibodies.
MutuI is a type I latency B-cell line derived from a Burkitt's lymphoma. Raji (ATCC) is an atypical type III latency B-cell line, derived from a Burkitt's lymphoma, that expresses EBNA2 but lacks EBNA3C and is defective for lytic cycle replication. LCL3456-EBV is a type III latency B-cell line derived from primary lymphoblasts transformed with EBV strain B95-8. These cell lines were maintained in RPMI supplemented with 10% fetal bovine serum, glutamine, penicillin, and streptomycin sulfate.
All antibodies were obtained from commercial sources, except for polyclonal rabbit anti-EBNA1, which was raised against recombinant full-length EBNA1. Commercial rabbit polyclonal antibodies used in this study were as follows: anti-CTCF, anti-acetyl H3 (AcH3), anti-acetyl H4 (AcH4), and anti-H3 methyl K4 (H3mK4) were purchased from Upstate Biotechnology; anti-H3 dimethyl K27 (H3mK27), anti-H3 trimethyl K36 (H3 mK36), and anti-H3 trimethyl K9 (H3mK9) were purchased from Abcam; anti-Orc2 was purchased from Pharmingen; and control rabbit and mouse immunoglobulin G (IgG) was purchased from Santa Cruz Biotechnology. Mouse monoclonal anti-EBNA1 was obtained from DakoCytomation.
Plasmids and luciferase assays.
The pGL3-Basic luciferase reporter plasmid (Promega) was modified by inserting the EBV BamHI C minimal promoter (Cp) (positions 11165 to 11412) into the HincII-to-HindIII site and the OriP FR (positions 7315 to 8190) into the KpnI site. This plasmid (J988C) was a generous gift from Cecilia Borestrom and Lars Rymo and is referred to as N1328 in this study. The CTCF binding site from EBV positions 6001 to 6590 (CTCF_L) was inserted into the NotI site of N1328 to generate N1341. The CTCF binding site from positions 49712 to 50250 (CTCF_R) was inserted into the NotI site of N1328 to generate N1351. CTCF_R was inserted into the BamHI site of N1341 to generate N1357. The EBNA1 expression plasmid pFLAG-EBNA1 contains the EBNA1 gene (lacking the region encoding the glycine-alanine repeats) inserted into the HindIII-EcoRI site of p3xFLAG-CMV2. Plasmids were transfected in triplicate samples into 293 cells, using Lipofectamine (Invitrogen), and assayed using a luciferase assay system (Promega) according to the manufacturer's instructions.
ChIP assay.
The chromatin immunoprecipitation (ChIP) assay was a modification of the protocol provided by Upstate Biotechnology, Inc., with minor modifications as previously described (15). DNAs were sonicated to between 200- and 350-bp DNA fragments on a Diagenode Bioruptor according to the manufacturer's protocol, and real-time PCR was performed with an ABI Prism 7000 system, using SYBR green detection according to the manufacturer's specified parameters.
EBV primer array and assay.
Primer pairs were designed using AB Primer Express 3.0. Primer sequences are available upon request and were designed to cover the first one-third of the EBV genome (coordinates 35 to 66128 according to NCBI accession number AJ507799). In addition, the array contained a negative control lacking any primer pairs and five primers specific for the cellular actin, tubulin, MTA1, and CD30 genes and a unique subtelomeric marker. Primer pairs were resuspended in 250 μl TE (10 mM Tris [pH 8.0]-1 mM EDTA) to generate a stock concentration of 20 pmol/μl. New 96-well plates were then filled with the primers at a final concentration of 0.3125 pmol/μl. A Biomek 2000 instrument was then used to transfer 2 μl (0.625 pmol) to the real-time PCR plates. These plates were stored at −20°C until use. Before use, 5.5 μl of 2× Power SYBR green real-time PCR master mix (Applied Biosystems, Inc.) and 5 μl of ChIP DNA (resuspended in 500 μl of water per immunoprecipitation reaction with 105 cells) were added to each well for a final volume of 12 μl.
Real-time PCR analysis.
A standard curve was generated with control EBV-positive cellular DNA to determine the efficiency of each primer (data not shown). Quantitation for ChIP assays was done using a version of the ΔCT method, where the cycle threshold (CT) value for each immunoprecipitation was compared to that for an IgG control immunoprecipitation for each primer pair. At least 10 sets of CT values for IgG DNA and 5 sets for the other antibodies were averaged. CT values that fell outside 10% of the mean were excluded. At least five CT values for IgG and three CT values for all other antibodies were used in the final calculations. Samples with fewer than three values falling within 10% of the mean were excluded. The data are shown in several formats, based on calculations by the ΔCT method, using the equation  . Each value was calculated and then divided by the average for the whole array in order to normalize each antibody.
Electrophoretic mobility shift assays (EMSAs).
DNA probes covering different regions of the EBV genome were generated by PCR incorporation of [α-32P]dATP (3,000 Ci/mmol; Perkin-Elmer). Each PCR mixture consisted of 30 μCi of [α-32P]dATP, 0.1 mM dCTP, 0.1 mM dGTP, 0.1 mM dTTP, 0.01 mM dATP, a 1 μM concentration of each primer, and 1 U of Taq polymerase (Roche) and was run for 25 cycles. Unincorporated nucleotides were removed with a Microspin G50 column (Amersham Biosciences). In a 20-μl reaction mixture, purified baculoviral His6-tagged CTCF (≈1 μg) was added to phosphate-buffered saline containing 0.5 μg poly(dI-dC), 5% glycerol, 0.1 mM ZnSO4, and 10,000 cpm of 32P-labeled DNA probe. Reaction mixtures were incubated for 30 min at 25°C, electrophoresed in a 5% nondenaturing, polyacrylamide gel at 110 V, and visualized with a PhosphorImager.
Hierarchical clustering analysis.
For clustering analysis of the complete data set (see Fig. 6), values were generated by sample-wise z-score normalization (done independently within each sample by subtracting the mean over all chromosomal locations and dividing by the corresponding standard deviation). Hierarchical clustering analysis was performed using a Pearson correlation-based distance metric and Ward linkage, as implemented in the bioinformatics toolbox of Matlab v 7.0.4.
FIG. 6.

Hierarchical clustering of complete ChIP data set. (A) Clustering was performed on cells and antibodies, with the genome position fixed. (B) Clustering was performed on both cells and antibodies (x axis) as well as on genome positions (y axis).
For clustering analysis of bound regions only (see Fig. 7), the numerical data were log10 transformed, and all probes with a value below 0.5 were eliminated. Clustering heat maps were then generated by a euclidean distance metric with Ward linkage.
FIG. 7.

Hierarchical clustering of significant binding sites only. (A) Clustering analysis of cells and antibodies, with the genome position fixed. (B) Clustering analysis of cells and antibodies (y axis) as well as genome positions (x axis).
RESULTS
Design and validation of array for ChIP analysis of EBV genome.
To analyze the histone modification patterns and protein-DNA interactions across the LCR of the EBV genome, we prepared a 96-well microtiter dish containing primer pairs for 90 positions on the EBV genome and 5 positions on the cellular genome, with one negative control lacking primer pairs. The EBV primers were designed to cover the first 66,000 bp of the EBV genome at a density of ∼500 bp. Since the large internal repeats (W repeats) consist of ∼11 copies of a 3,072-bp unit spanning EBV coordinates 12,000 to 36,398 (based on the wild-type EBV genome [accession no. gi:23893576]), we included only one complete repeat unit, thus reducing the duplication of primers throughout this repetitive region (Fig. 1A). Primers were designed using the AB Primer Express 3.1 program for real-time PCR amplification. Primer specificity for the EBV genome sequence was first validated by comparing the amplification curves for EBV-positive cells and EBV-negative BCBL1 lymphoma cells (data not shown). All but two primer pairs passed this test, and the defective primers were eliminated from subsequent analysis. We then determined a standard curve for each primer pair, using DNA derived from EBV-positive MutuI cells (data not shown). We found that the slope of the linear portion of each amplification curve was between −2.5 and −4.6, with the average being −3.184. Based on these data, we concluded that the array was specific and sufficiently quantitative to analyze DNA samples derived from ChIP experiments.
FIG. 1.

(A) Schematic of salient features of the latent EBV genome, with focus on the first 66 kb, which was used for ChIP array studies. (B) Bar graph representation of ChIP array data for EBNA1 binding sites in the genomes of MutuI (top), Raji (middle), and LCL (bottom) cells. The positions of OriP, the W repeat, and Qp in the bar graph are aligned with the line drawing of the EBV genome below.
Since EBNA1 is a well-characterized, high-affinity DNA binding protein with three specific binding sites in the EBV genome, we used EBNA1 ChIP to further validate the specificity and applicability of the array for ChIP analysis (Fig. 1B). An antibody to EBNA1 was used in ChIP assays with the EBV-positive MutuI, Raji, and LCL3456 cell lines. Quantitation of each well was done by determining the x-fold change relative to the IgG value for each primer pair and each cell type. Control IgG reactions were performed at least eight times, with a standard deviation of <5% of the mean value (data not shown). EBNA1 ChIP values were obtained at least three times for each cell type, with a standard deviation of <10% of the mean value. Using this criterion, we found that EBNA1 bound to the known EBNA1 binding sites at OriP (6- to 20-fold more than IgG) and Qp (3.5- to 17-fold more than IgG). A dual peak occurred at OriP, reflecting the separate binding at the FR and DS, with some additional binding at other regions, including Rep* (positions 9498 to 9538), especially in Raji and MutuI cells. These results indicate that EBV genome ChIP was sufficiently sensitive for detecting specific binding sites of EBNA1 on three different viral genomes.
As a first approach to understanding the chromatin structure and gene regulatory mechanisms governing different types of EBV latency, we set out to investigate the localization of proteins associated with DNA replication initiation (ORC2), chromatin boundaries (CTCF), histone compaction (H1), and a variety of histone H3 and H4 modifications (AcH3, AcH4, H3AcK9, H3mK4, H3mK9, H3mK27, and H3mK36). To ensure that our antibodies were specific for each of these epitopes and that each target protein was expressed to nearly equal levels in each of the three cell types, we compared the panel of antibodies by Western blotting of protein extracts derived from MutuI, Raji, and LCL3456 cells (data not shown). With the exception of the EBNA1 antibody, all of the above antibodies were found to have specific target proteins expressed at nearly equal levels in each cell type. Interestingly, EBNA1 antibody revealed a slight heterogeneity among cell types, with Raji cells producing a protein of slightly higher mobility, perhaps as a result of the loss of glycine-alanine repeats (data not shown). The heterogeneity of EBNA1 in Raji cells has been reported previously (20, 23).
Profiling the EBV chromosome.
To better understand the regulation of EBV latency control, we compared the binding patterns of several chromatin organizing proteins and histone modifications. For all of these studies, we compared the binding patterns across the EBV LCR and surrounding regions, using the array of real-time PCR primers. We compared binding in three different cell lines representing different latency types. The data are presented as a line graph for each ChIP antibody (Fig. 2) or as a color grid composite (Fig. 3). The line graphs compare all three cell types in the same plot and provide a direct comparison of the x-fold enrichment relative to the IgG control for each data point (Fig. 2). The values used for the color grid were calculated as x-fold changes over the mean value for each antibody (Fig. 3).
FIG. 2.

Line graphs representing average distances from the mean (y axis) for each antibody indicated to the left. Mutu I (red), Raji (blue), and LCL (green) cell data are shown by overlapping lines across the positions of the EBV genome array, indicated by the x axis.
FIG. 3.

Color chart analysis of ChIP data. EBV genome positions are indicated in the vertical axis to the left. Antibodies are indicated above for each set of three columns. Each column of each antibody set represents the analysis for a particular cell type (MutuI, Raji, or LCL cells). The values were normalized as distances from the mean for each column. Values of >10-fold above the mean (red), 5-fold above the mean (yellow), 2.5-fold above the mean (green), or 1.0-fold above the mean (cyan) were considered significant binding. Values of <1.0-fold above the mean are presented in light blue, and values deemed statistically insignificant or indeterminant are presented in dark blue.
As mentioned above, we observed that EBNA1 bound most efficiently to the OriP and Qp regions of all three genomes. However, the binding was considerably lower in LCL cells, perhaps reflecting the lower copy number in these cells. We also observed that the DS peak for Raji cells was shifted significantly to the right and overlapped the Rep* sequences to a greater extent than the DS. However, the resolution of our ChIP assay cannot exclude that some of this binding also occurs at the DS. These observations are interesting insofar as the major sites of replication initiation in Raji cells may occur at several locations outside the DS (41). To further explore the potential sites of DNA replication, we next analyzed the binding pattern of ORC2. ORC is known to be essential for the formation of the chromosomal prereplication complex but may also contribute to higher-order chromatin structures, especially those associated with heterochromatin formation (6, 37). We found that ORC2 bound most detectably at the DS and Rep* regions of the Raji genome and overlapped significantly with EBNA1 binding in Raji cells. Similarly, ORC2 bound to the DS region in MutuI cells, with significant overlap with EBNA1. ORC2 binding was not significantly detected in LCL cells at OriP but had multiple low peaks throughout the LCR, suggesting that this LCL cell line does not have a dedicated origin at OriP. Importantly, ORC2 was not enriched at Qp and therefore does not bind to all EBNA1 binding sites within the EBV genome, consistent with several previous studies (4, 14, 54).
CTCF is a chromatin boundary factor that can also function as a transcriptional repressor and modulate enhancer-promoter interactions (34, 46). We previously implicated CTCF in the regulation of the Cp in latency type I and type III (12, 13). We next examined CTCF binding by using the EBV array. As previously observed, we found CTCF binding sites positioned between Cp and OriP at position 10504 in MutuI cells, but to a lesser extent in Raji and LCL cells. These findings support our model that CTCF regulates OriP enhancer activation of Cp in type III latency. We also observed a major enrichment of CTCF at the Qp region, overlapping precisely with the EBNA1 binding sites in this region. CTCF bound Qp in all three cell types, with binding in Raji cells being slightly greater than that in LCL or MutuI cells. Another potentially significant peak of CTCF occurred at position 6289, which lies immediately upstream of the EBER I promoter. This CTCF site was equally enriched in all three cell types and may function to block EBER I and OriP open chromatin structure from encroaching the terminal repeats or the adjacent BNRF1 lytic cycle promoter.
Our previous studies of EBV chromatin organization focused on the histone H3 modification of methylation on K4 (H3mK4). Using the array analysis, we found that H3mK4 was highly enriched in all three cell types at the regions encompassing the EBERs and OriP. We also found elevated H3mK4 at Qp in MutuI and Raji cells but not in LCL cells. H3mK4 at Qp overlapped or was adjacent to the CTCF and EBNA1 binding sites. A strong H3mK4 peak was also observed in Raji cells at position 47693, which lies rightward of the EBV-encoded microRNA at the BHRF1 locus. H3mK4 was enriched at the Cp and W regions in LCL cells but not in MutuI or Raji cells, consistent with our earlier observations. However, in contrast to our earlier studies, we did not find a homogeneous expansion of H3mK4 from OriP to Cp in type III latency. Rather, we found several H3mK4 peaks and valleys, suggesting that H3mK4 is not homogeneous throughout the region between OriP and Cp.
Histone H3mK9 has been implicated in heterochromatin formation and transcription repression, but exceptions to this rule have been observed (36, 48). We assayed H3mK9 for its binding on the EBV genome. We found relatively weak binding of H3mK9 at all positions of the EBV genome, with the highest peaks being ∼5.5-fold higher than those of IgG controls. For most positions, H3mK9 was inversely associated with H3mK4 at the regions between OriP and Cp. The highest levels of H3mK9 were observed in Raji cells in the region at positions 60642 to 62306, which is between the divergent promoters of the BPLF1 and BORF1 genes involved in lytic cycle capsid assembly. We also found that H3mK9 was elevated at the 3′ end of the W repeats and at the EBNA2 open reading frame (ORF) in MutuI and Raji cells, while LCL cells showed sporadic H3mK9 throughout the Cp and OriP regions of the LCR (positions 8860, 12230, and 13925). H3mK9 was excluded from OriP in MutuI and Raji cells. In LCL cells, H3mK9 was excluded from the EBNA2 ORF and downstream microRNA region.
Acetylated histones typically correlate with actively transcribed regions of chromatin (29). We first examined AcH3 and found this modification pattern to be highly enriched at the EBERs and the OriP region of Raji cells. This region was not particular elevated in AcH3 in MutuI and LCL cells. In contrast, several other peaks of AcH3 were observed in MutuI cells, most notably for a region at positions 60642 and 55198. Both MutuI and LCL cells were enriched for AcH3 at positions 44017 to 44642, perhaps reflecting some background lytic cycle gene expression in these cell populations. Raji cells, which are replication defective, did not show this pattern of AcH3.
Acetylation of histone H3 on K9 is more closely associated with open chromatin that prevents methylation of K9 and heterochromatin formation. We found that H3acK9 was highly enriched in Raji cells at the 5′ end of OriP and was high in both MutuI and Raji cells at the EBER promoter and transcript. H3acK9 was also highly enriched at the Cp of LCL cells, where it is most active, but was not detectable at the Cp region of MutuI cells, where it is inactive.
AcH4 has also been linked to sites of active transcription. We found that AcH4 was significantly enriched at the Cp and Wp regions of Raji and LCL cells, as might be expected for type III latency patterns. However, we also found AcH4 enriched at Cp in MutuI cells, where Cp transcription is repressed. Additionally, we observed AcH4 enrichment within the W repeats (14764) of the type III latency cell lines Raji and LCL and at the 3′ end of the W repeats (35390) in Mutu I cells. AcH4 was also enriched near the transcription initiation sites for Qp (50786) in MutuI and Raji cells but was not detectable in LCL cells.
The H3mK27 modification has been linked to transcription repression through polycomb-associated proteins (10). We found relatively low levels of H3mK27, with a small peak for Raji cells between OriP and Cp. H3mK36 has been associated with RNA polymerase II activity and transcription elongation (33). We found H3mK36 to be highly elevated in the cellular genes for actin, MTA1, and CD30 that were also included in the array. However, relatively low levels of H3mK36 were detected in the EBV genomes, with the exception of a peak in Raji cells at position 9672, close to the DS and Rep*, as well as at position 39931, which is within the EBNA2 transcript.
The linker histone H1 has been implicated in the organization of higher-order chromatin structure, but the precise role and localization of H1 are not completely understood (9). We examined the binding of H1 and found a relatively weak association with EBV genomes. The most detectable binding occurred at the Cp and the 5′ ends of the W repeats in LCL cells as well as at the EBNA2 transcript (position 35555) in LCL cells. The significance of this H1 binding pattern is not clear but may reflect a conformational plasticity of the LCR between OriP and the W repeats.
Identification of a novel CTCF binding site upstream of Qp.
Our ChIP data revealed a highly enriched interaction between CTCF and the region upstream of the Qp promoter for all three cell types. To further validate the ChIP data and to further characterize the precise position of this CTCF site, we used in vitro DNA binding assays with recombinant CTCF protein (Fig. 4). A series of ∼200-bp DNA fragments spanning positions 49712 to 50250 or a negative control DNA from positions 100041 to 10228 was radiolabeled and assayed for binding to highly purified baculovirus-expressed CTCF by EMSA, as described previously (13) (Fig. 4A). We found that purified CTCF bound to the region from positions 49901 to 50110 with the highest affinity but did not bind significantly to the other four regions tested (Fig. 4B). This result supports the findings of the ChIP array, where CTCF binding was mapped to the region spanning positions 49867 to 50002. This binding site is immediately upstream of the EBNA1 Qp binding sites at positions 50142 to 50189, suggesting that it may contribute to Qp regulation during latency type switching or prevent latent promoters from activating neighboring lytic gene promoters. The binding of CTCF to the Qp regions was further validated with a second set of primers, using real-time PCR with a standard curve method (Fig. 4C). This alternative method verified our array analysis, since CTCF was enriched >50-fold at Qp for three cell types tested.
FIG. 4.
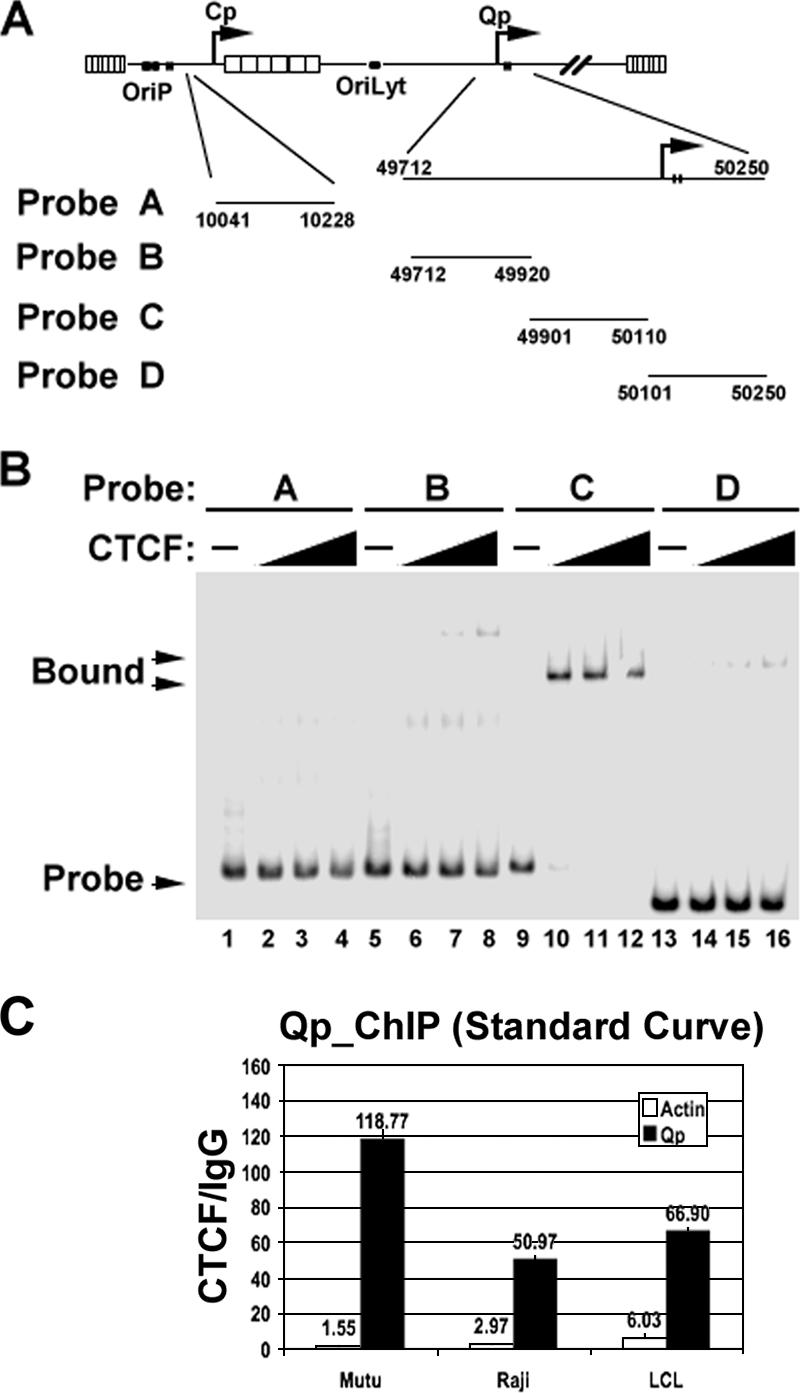
EMSA analysis of CTCF binding to the Qp region. (A) Depiction of EBV genome regions used to generate probes for EMSA. The EBV coordinates are indicated for each probe used in panel B. (B) CTCF protein, expressed and purified from baculovirus, was tested at increasing concentrations for its ability to bind probe A (positions 10041 to 10228), probe B (positions 49712 to 49920), probe C (positions 49901 to 50110), or probe D (positions 50101 to 50250). Free probe and CTCF-bound fractions are indicated by arrows. (C) ChIP assay using real-time PCR and standard curve analysis with primer pairs specific for actin (white) or Qp (black). ChIP was performed with MutuI, Raji, and LCL cells, and data are presented as x-fold changes in CTCF binding relative to that of an IgG control.
CTCF sites facilitate EBNA1 transcription activation of Cp.
Several functions have been attributed to CTCF, including enhancer blocking, insulator binding, and interchromosome interactions. To determine if the strong CTCF binding sites at positions 6001 to 6590 (CTCF_L) and 49712 to 50250 (CTCF_R) had enhancer-modulating activity, we inserted these sites into a luciferase reporter plasmid containing a minimal BamHI C promoter (Cp) and an upstream EBNA1-dependent enhancer from the FR within OriP (Fig. 5A). To our surprise, we found that CTCF_L and CTCF_R did not block EBNA1 activation of Cp (Fig. 5B). In contrast, we found that CTCF sites inserted between FR and Cp enhanced EBNA1 activation levels. In the absence of CTCF sites (N1328), Cp was activated 15.3-fold by EBNA1. Insertion of CTCF_L between FR and Cp (N1341) resulted in a 23.7-fold activation, while insertion of CTCF_R produced a 21.3-fold activation by EBNA1. Insertion of CTCF_L at the 5′ end of FR and of CTCF_R at the 3′ end of FR yielded a 32.4-fold activation by EBNA1. Part of the increase in activation resulted from a suppression of basal promoter activity. These findings suggest that in 293 cells, CTCF sites facilitate EBNA1 interactions with the minimal Cp to enhance transcription activity.
FIG. 5.

CTCF binding sites facilitate EBNA1-dependent activation of Cp. (A) CTCF sites from positions 6001 to 6590 (CTCF_L) or positions 49712 to 50250 (CTCF_R) were inserted between the FR and the minimal BamHI Cp or downstream of the luciferase gene in plasmid N1328, as indicated. (B) Luciferase constructs were assayed in 293 cells transfected with control vector or an EBNA1 expression plasmid (FLAG-EBNA1). The x-fold activation by EBNA1 is indicated above each bar in the graph.
Hierarchical clustering analysis of EBV protein and cell types.
To determine whether the ChIP array data could provide additional information regarding the functional relationship of proteins or histone modifications associated with the EBV genome, we applied an unsupervised hierarchical clustering analysis of the antibodies and cell types (Fig. 6A). Using this approach, we found that CTCF and EBNA1 clustered in one group for all three cell types, suggesting that these proteins share a related function which may be invariant relative to the EBV binding sites in all latency types. H3mK4 clustered close to EBNA1 in MutuI cells but drifted from this linkage in Raji and LCL cells. This is consistent with our model that type I latency restricts the pattern of H3mK4 to regions adjacent to EBNA1 binding sites. ORC2 in Raji and MutuI cells clustered with H3mK4 and EBNA1, but this was not the case in LCL cells. H3mK36 clustered in all three cell types, while AcH3 and AcH4 were not closely linked.
Hierarchical analysis of DNA binding sites.
To determine if DNA elements share common protein elements, we applied unsupervised hierarchical clustering analysis to the DNA binding sites as well as the protein and cell types (Fig. 6B). Using this approach, we found that Qp and DS clustered as a result of the common interaction with EBNA1, CTCF, and H3mK4. The region around the EBERs also clustered close to DS and Qp as a result of the H3mK4, AcH3, and H3AcK9 modifications that they share. The cellular actin, CD30, and MTA1 genes clustered as a result of their enrichment in H3mK36. The Cp regions also clustered, partly as a result of AcH3 and AcH4 in this region, but also due to complex patterns of other histone modifications.
Hierarchical analysis of bound sites only.
To eliminate the concern that the hierarchical analysis was based mostly on the extensive regions where no binding was detected, we performed a more limited clustering analysis with only those values where protein binding was detected (Fig. 7). Using this approach, we found a slightly different pattern of clustering which reflected the cell type more strongly than the protein identity. For example, the MutuI cells were clustered according to histone H1, H3mK27, CTCF, AcH3, EBNA1, H3mK4, AcH4, and AcK9 (Fig. 7A). Similarly, Raji and LCL cells were clustered according to both histone modifications and protein binding. This suggests that each cell type has a specific signature that can be recognized by this analysis. When the clustering algorithm was applied to the DNA sites, we again found clustering of the Qp region with the DS and Rep* regions (Fig. 7B). Several other groupings, such as the Cp region and EBERs, may reflect underlying patterns of protein-DNA interaction or histone modifications. In summary, this method provides an opportunity to explore the relationships between different regions of the genome based on their patterns of chromatin structure and protein-DNA interactions.
DISCUSSION
The plasticity of gene expression during the EBV latent cycle provides a mechanism for viral persistence and immune evasion (63, 72). Promoter selection plays a key role in determining latency type, and this selection depends on the interplay of host-cell-specific transcription factors and poorly defined epigenetic events that reinforce gene expression patterns over multiple generations (39, 47, 70). The Cp can be silenced epigenetically by cytosine methylation during the transition from type III to type I latency (3, 27, 47). However, factors that determine the sites of CpG methylation and the effectors of cytosine methylation-directed transcription repression are not completely understood (27). The EBNA1-dependent enhancer at OriP can regulate Cp transcription, along with the autoactivation of EBNA2 and the automodulation by EBNA3A and EBNA3C (2, 42, 49, 50). Cellular transcription factors that bind Cp, including CSL (C8F1, RBPJK) and associated cofactors, are also known to contribute to the promoter activity that determines latency type (8, 18, 25). Chromatin structure and histone modifications at Cp are less well understood but are also thought to contribute to latency type gene expression (1).
In this study, we used a ChIP assay to examine the histone modification and chromatin regulatory protein binding patterns at Cp and the EBV LCR in three different cell types. In a previous study, we used ChIP assays with a relatively small number of primer pairs to examine a few selected regions of the EBV genome (12). Based on these studies, we proposed that the chromatin boundary and enhancer-blocking factor CTCF binds to a region between Cp and OriP and blocks enhancer activation of Cp in type I latency, where Cp is repressed. We observed that histone H3mK4 was elevated at the region surrounding OriP and that this modification extended to the Cp and W repeat region in type III latency but was limited to the OriP region in type I latently infected cells (12). In the studies presented here with higher-density and more extensive ChIP arrays, we now extend and revise this model in several respects. Importantly, our new data corroborate previous findings that H3mK4 is enriched at the OriP region in type I and type III latency. However, our new findings raise the possibilities that H3mK4 may be most highly enriched at the EBERs and that RNA polymerase III transcription may be the generating event for this histone modification. H3mK4 extends through the OriP region in all cell types and is generally spread over a larger domain in type III latency. However, H3mK4 modification may not be distributed uniformly throughout the regions between OriP and Cp in type III latency, since we observed that some regions were deficient in H3mK4 and elevated in H3mK9. In LCL cells, H3mK4 and H3mK9 appear to oscillate, with some partial overlap in the regions between the EBERs and Qp. Others have found that H3mK4 and H3mK9 can be present simultaneously at transcriptionally active genes (64). Our data suggest that these histone modifications form a complex pattern across this active region of the viral genome. It is also possible that some of the heterogeneity in signal may reflect the heterogeneity of viral genomes, since latently infected B cells carry multiple copies of the viral genome. It is also possible that some background lytic gene expression may complicate the analysis. Therefore, the complex patterns of H3mK4 and H3mK9 may reflect the complex behavior of the cell type analyzed.
In our previous study, we also observed that the CTCF binding site between Cp and OriP was differentially regulated between type I and type III cells (13). In the present study, we noted that CTCF bound to this region with a high affinity in MutuI and Raji cells and to a much lesser extent in LCL cells. However, detectable levels of CTCF binding in LCL cells suggest that additional factors must also contribute to Cp regulation. Others have found that CpG methylation strongly influences the binding properties of CTCF, especially at the H19 and Igf2 imprinted loci (35). It has also been reported that poly(ADP) ribosylation of CTCF at the Igf2 locus regulates its activity as an enhancer-blocking factor (73). Thus, it is possible that the enhancer-blocking activity of CTCF is further regulated by CpG methylation patterns and protein poly(ADP) ribosylation in these different cell types.
A major new finding from this study is the discovery of several additional high-affinity CTCF sites in the LCR of EBV. The most highly enriched binding for CTCF was found at the Qp locus, immediately upstream of the EBNA1 binding sites. CTCF bound to the Qp locus in all three cell types. In addition to CTCF binding at Qp, we also found significant enrichment of CTCF at position 6239, immediately 5′ of the EBER I promoter. Interestingly, these two major CTCF sites delineate predicted boundaries of the latency control region. One possible function of these CTCF sites is to prevent active latent cycle promoters from stimulating transcription of lytic cycle genes. In this respect, CTCF may help to maintain the latent state. Additionally, CTCF may facilitate interactions between distal regulatory elements. We found that insertion of CTCF sites between Cp and FR in a reporter-based assay augmented EBNA1-dependent activation (Fig. 5). Consistent with this hypothesis is the finding that CTCF mediates long-range interactions between regulatory loci on different chromosomes (40). It is possible that CTCF can both limit the spreading of histone modifications to adjoining DNA and facilitate long-distance interactions between regulatory elements through looping or tethering mechanisms. The higher-resolution analysis used in this study suggests that the LCR consists of a collection of smaller subdomains punctuated by CTCF sites (Fig. 8). Histone modification patterns within each subdomain were not homogeneous, as originally proposed. However, modifications associated with active transcription, including H3mK4, AcH3, and AcH4, were clustered within the boundaries set by various CTCF sites. Although the CTCF function at each site is not clear at this point, the positions of CTCF binding sites suggest that they provide a structural element that organizes the viral chromosome and coordinates interactions between enhancers and promoters important for latency type determination.
FIG. 8.

Schematic of chromatin organization based on genome ChIP analysis of different EBV latency types. Type I is based on MutuI cells, and type III is based on LCL cells. CTCF is depicted in purple, EBNA1 is in red, the permissive chromatin H3mK4 is in green.
In summary, we have combined a ChIP assay with an array of primer pairs to measure protein-DNA interaction and histone modification patterns at a density of ∼500-bp intervals for the first 66 kb of the EBV genome. Our data support the general model that this region consists of a dynamic chromatin structure that regulates aspects of promoter switching observed in the different latency types of EBV (Fig. 8). Additionally, hierarchical clustering of these data was capable of sorting patterns according to viral latency type and cellular identity, suggesting that this approach may provide a chromatin bar code, linking epigenetic information to cellular identity (24, 28). The histone modification patterns were complex and distinct for each latency type associated with the three different cell lines examined. The histone modifications did not form a homogeneous domain, as originally envisioned, but rather appeared as numerous peaks and valleys of specific modifications. This may reflect the heterogeneity of the population of viral genomes or the natural complexity of chromatin structure in each cell type. Despite this, our studies definitively show that CTCF binding sites are located between key regulatory elements of the latency control region and are ideally situated for coordinating changes in promoter-enhancer interactions that may regulate latency type patterns of gene expression.
Acknowledgments
We are grateful to John Rux and the Wistar Bioinformatics Core for design of the real-time primer array. We also thank Cecilia Boreström and Lars Rhymo for plasmid J988C (N1328).
This work was funded in part by grants from the NIH (CA93606 and CA05678) to P.M.L., by the Pennsylvania Department of Health, and by a Wistar Institute NIH postdoctoral training fellowship to C.M.C. M.C. and M.S. were supported in part by PA Tobacco Settlement grants ME01-740 and SAP 4100020718.
Footnotes
Published ahead of print on 4 April 2007.
REFERENCES
- 1.Alazard, N., H. Gruffat, E. Hiriart, A. Sergeant, and E. Manet. 2003. Differential hyperacetylation of histones H3 and H4 upon promoter-specific recruitment of EBNA2 in Epstein-Barr virus chromatin. J. Virol. 77:8166-8172. [DOI] [PMC free article] [PubMed] [Google Scholar]
- 2.Altmann, M., D. Pich, R. Ruiss, J. Wang, B. Sugden, and W. Hammerschmidt. 2006. Transcriptional activation by EBV nuclear antigen 1 is essential for the expression of EBV's transforming genes. Proc. Natl. Acad. Sci. USA 103:14188-14193. [DOI] [PMC free article] [PubMed] [Google Scholar]
- 3.Ambinder, R. F., K. D. Robertson, and Q. Tao. 1999. DNA methylation and the Epstein-Barr virus. Semin. Cancer Biol. 9:369-375. [DOI] [PubMed] [Google Scholar]
- 4.Atanasiu, C., Z. Deng, A. Wiedmer, J. Norseen, and P. M. Lieberman. 2006. ORC binding to TRF2 stimulates OriP replication. EMBO Rep. 7:716-721. [DOI] [PMC free article] [PubMed] [Google Scholar]
- 5.Babcock, G. J., L. L. Decker, M. Volk, and D. A. Thorley-Lawson. 1998. EBV persistence in memory B cells in vivo. Immunity 9:395-404. [DOI] [PubMed] [Google Scholar]
- 6.Bell, S. P. 2002. The origin recognition complex: from simple origins to complex functions. Genes Dev. 16:659-672. [DOI] [PubMed] [Google Scholar]
- 7.Bodescot, M., M. Perricaudet, and P. J. Farrell. 1987. A promoter for the highly spliced EBNA family of RNAs of Epstein-Barr virus. J. Virol. 61:3424-3430. [DOI] [PMC free article] [PubMed] [Google Scholar]
- 8.Borestrom, C., H. Zetterberg, K. Liff, and L. Rymo. 2003. Functional interaction of nuclear factor Y and Sp1 is required for activation of the Epstein-Barr virus C promoter. J. Virol. 77:821-829. [DOI] [PMC free article] [PubMed] [Google Scholar]
- 9.Buttinelli, M., G. Panetta, D. Rhodes, and A. Travers. 1999. The role of histone H1 in chromatin condensation and transcriptional repression. Genetica 106:117-124. [DOI] [PubMed] [Google Scholar]
- 10.Cao, R., and Y. Zhang. 2004. The functions of E(Z)/EZH2-mediated methylation of lysine 27 in histone H3. Curr. Opin. Genet. Dev. 14:155-164. [DOI] [PubMed] [Google Scholar]
- 11.Capelson, M., and V. G. Corces. 2004. Boundary elements and nuclear organization. Biol. Cell 96:617-629. [DOI] [PubMed] [Google Scholar]
- 12.Chau, C. M., and P. M. Lieberman. 2004. Dynamic chromatin boundaries delineate a latency control region of Epstein-Barr virus. J. Virol. 78:12308-12319. [DOI] [PMC free article] [PubMed] [Google Scholar]
- 13.Chau, C. M., X. Y. Zhang, S. B. McMahon, and P. M. Lieberman. 2006. Regulation of Epstein-Barr virus latency type by the chromatin boundary factor CTCF. J. Virol. 80:5723-5732. [DOI] [PMC free article] [PubMed] [Google Scholar]
- 14.Chaudhuri, B., H. Xu, I. Todorov, A. Dutta, and J. L. Yates. 2001. Human DNA replication initiation factors, ORC and MCM, associate with oriP of Epstein-Barr virus. Proc. Natl. Acad. Sci. USA 98:10085-10089. [DOI] [PMC free article] [PubMed] [Google Scholar]
- 15.Deng, Z., L. Lezina, C. J. Chen, S. Shtivelband, W. So, and P. M. Lieberman. 2002. Telomeric proteins regulate episomal maintenance of Epstein-Barr virus origin of plasmid replication. Mol. Cell 9:493-503. [DOI] [PubMed] [Google Scholar]
- 16.Dyson, P. J., and P. J. Farrell. 1985. Chromatin structure of Epstein-Barr virus. J. Gen. Virol. 66:1931-1940. [DOI] [PubMed] [Google Scholar]
- 17.Elliott, J., E. B. Goodhew, L. T. Krug, N. Shakhnovsky, L. Yoo, and S. H. Speck. 2004. Variable methylation of the Epstein-Barr virus Wp EBNA gene promoter in B-lymphoblastoid cell lines. J. Virol. 78:14062-14065. [DOI] [PMC free article] [PubMed] [Google Scholar]
- 18.Evans, T. J., P. J. Farrell, and S. Swaminathan. 1996. Molecular genetic analysis of Epstein-Barr virus Cp promoter function. J. Virol. 70:1695-1705. [DOI] [PMC free article] [PubMed] [Google Scholar]
- 19.Fedoriw, A. M., P. Stein, P. Svoboda, R. M. Schultz, and M. S. Bartolomei. 2004. Transgenic RNAi reveals essential function for CTCF in H19 gene imprinting. Science 303:238-240. [DOI] [PubMed] [Google Scholar]
- 20.Fischer, D. K., M. F. Robert, D. Shedd, W. P. Summers, J. E. Robinson, J. Wolak, J. E. Stefano, and G. Miller. 1984. Identification of Epstein-Barr nuclear antigen polypeptide in mouse and monkey cells after gene transfer with a cloned 2.9-kilobase-pair subfragment of the genome. Proc. Natl. Acad. Sci. USA 81:43-47. [DOI] [PMC free article] [PubMed] [Google Scholar]
- 21.Gahn, T. A., and B. Sugden. 1995. An EBNA-1-dependent enhancer acts from a distance of 10 kilobase pairs to increase expression of the Epstein-Barr virus LMP gene. J. Virol. 69:2633-2636. [DOI] [PMC free article] [PubMed] [Google Scholar]
- 22.Gaszner, M., and G. Felsenfeld. 2006. Insulators: exploiting transcriptional and epigenetic mechanisms. Nat. Rev. Genet. 7:703-713. [DOI] [PubMed] [Google Scholar]
- 23.Grasser, F. A., P. G. Murray, E. Kremmer, K. Klein, K. Remberger, W. Feiden, G. Reynolds, G. Niedobitek, L. S. Young, and N. Mueller-Lantzsch. 1994. Monoclonal antibodies directed against the Epstein-Barr virus-encoded nuclear antigen 1 (EBNA1): immunohistologic detection of EBNA1 in the malignant cells of Hodgkin's disease. Blood 84:3792-3798. [PubMed] [Google Scholar]
- 24.Hake, S. B., and C. D. Allis. 2006. Histone H3 variants and their potential role in indexing mammalian genomes: the “H3 barcode hypothesis.” Proc. Natl. Acad. Sci. USA 103:6428-6435. [DOI] [PMC free article] [PubMed] [Google Scholar]
- 25.Henkel, T., P. D. Ling, S. D. Hayward, and M. G. Peterson. 1994. Mediation of Epstein-Barr virus EBNA2 transactivation by recombination signal-binding protein J kappa. Science 265:92-95. [DOI] [PubMed] [Google Scholar]
- 26.Hsieh, C. L. 1999. Evidence that protein binding specifies sites of DNA demethylation. Mol. Cell. Biol. 19:46-56. [DOI] [PMC free article] [PubMed] [Google Scholar]
- 27.Hutchings, I. A., R. J. Tierney, G. L. Kelly, J. Stylianou, A. B. Rickinson, and A. I. Bell. 2006. Methylation status of the Epstein-Barr virus (EBV) BamHI W latent cycle promoter and promoter activity: analysis using novel EBV-positive Burkitt and lymphoblastoid cell lines. J. Virol. 80:10700-10711. [DOI] [PMC free article] [PubMed] [Google Scholar]
- 28.Imhof, A., and T. Bonaldi. 2005. “Chromatomics” the analysis of the chromatome. Mol. Biosyst. 1:112-116. [DOI] [PubMed] [Google Scholar]
- 29.Jenuwein, T., and C. D. Allis. 2001. Translating the histone code. Science 293:1074-1080. [DOI] [PubMed] [Google Scholar]
- 30.Kanduri, C., V. Pant, D. Loukinov, E. Pugacheva, C. F. Qi, A. Wolffe, R. Ohlsson, and V. V. Lobanenkov. 2000. Functional association of CTCF with the insulator upstream of the H19 gene is parent of origin-specific and methylation-sensitive. Curr. Biol. 10:853-856. [DOI] [PubMed] [Google Scholar]
- 31.Kennedy, G., and B. Sugden. 2003. EBNA-1, a bifunctional transcriptional activator. Mol. Cell. Biol. 23:6901-6908. [DOI] [PMC free article] [PubMed] [Google Scholar]
- 32.Kieff, E. 1996. Epstein-Barr virus and its replication, p. 2343-2396. In D. Knipe and P. M. Howley (ed.), Fields virology, 3rd ed., vol. 2. Lippincott-Raven Publishers, Philadelphia, PA. [Google Scholar]
- 33.Kizer, K. O., H. P. Phatnani, Y. Shibata, H. Hall, A. L. Greenleaf, and B. D. Strahl. 2005. A novel domain in Set2 mediates RNA polymerase II interaction and couples histone H3 K36 methylation with transcript elongation. Mol. Cell. Biol. 25:3305-3316. [DOI] [PMC free article] [PubMed] [Google Scholar]
- 34.Klenova, E., and R. Ohlsson. 2005. Poly(ADP-ribosyl)ation and epigenetics. Is CTCF PARt of the plot? Cell Cycle 4:96-101. [DOI] [PubMed] [Google Scholar]
- 35.Kurukuti, S., V. K. Tiwari, G. Tavoosidana, E. Pugacheva, A. Murrell, Z. Zhao, V. Lobanenkov, W. Reik, and R. Ohlsson. 2006. CTCF binding at the H19 imprinting control region mediates maternally inherited higher-order chromatin conformation to restrict enhancer access to Igf2. Proc. Natl. Acad. Sci. USA 103:10684-10689. [DOI] [PMC free article] [PubMed] [Google Scholar]
- 36.Lachner, M., and T. Jenuwein. 2002. The many faces of histone lysine methylation. Curr. Opin. Cell Biol. 14:286-298. [DOI] [PubMed] [Google Scholar]
- 37.Leatherwood, J., and A. Vas. 2003. Connecting ORC and heterochromatin: why? Cell Cycle 2:573-575. [PubMed] [Google Scholar]
- 38.Leight, E. R., and B. Sugden. 2000. EBNA-1: a protein pivotal to latent infection by Epstein-Barr virus. Rev. Med. Virol. 10:83-100. [DOI] [PubMed] [Google Scholar]
- 39.Lina, I. Y., and S. H. Speck. 2000. Regulation of EBNA gene expression. Epstein-Barr Virus Rep. 7:175-185. [Google Scholar]
- 40.Ling, J. Q., T. Li, J. F. Hu, T. H. Vu, H. L. Chen, X. W. Qiu, A. M. Cherry, and A. R. Hoffman. 2006. CTCF mediates interchromosomal colocalization between Igf2/H19 and Wsb1/Nf1. Science 312:269-272. [DOI] [PubMed] [Google Scholar]
- 41.Little, R. D., and C. L. Schildkraut. 1995. Initiation of latent DNA replication in the Epstein-Barr virus genome can occur at sites other than the genetically defined origin. Mol. Cell. Biol. 15:2893-2903. [DOI] [PMC free article] [PubMed] [Google Scholar]
- 42.Maruo, S., E. Johannsen, D. Illanes, A. Cooper, B. Zhao, and E. Kieff. 2005. Epstein-Barr virus nuclear protein 3A domains essential for growth of lymphoblasts: transcriptional regulation through RBP-Jkappa/CBF1 is critical. J. Virol. 79:10171-10179. [DOI] [PMC free article] [PubMed] [Google Scholar]
- 43.Minarovits, J. 2006. Epigenotypes of latent herpesvirus genomes. Curr. Top. Microbiol. Immunol. 310:61-80. [DOI] [PubMed] [Google Scholar]
- 44.Nilsson, T., H. Zetterberg, Y. C. Wang, and L. Rymo. 2001. Promoter-proximal regulatory elements involved in oriP-EBNA1-independent and -dependent activation of the Epstein-Barr virus C promoter in B-lymphoid cell lines. J. Virol. 75:5796-5811. [DOI] [PMC free article] [PubMed] [Google Scholar]
- 45.Nonkwelo, C., J. Skinner, A. Bell, A. Rickinson, and J. Sample. 1996. Transcription start sites downstream of the Epstein-Barr virus (EBV) Fp promoter in early-passage Burkitt lymphoma cells define a fourth promoter for expression of the EBV EBNA-1 protein. J. Virol. 70:623-627. [DOI] [PMC free article] [PubMed] [Google Scholar]
- 46.Ohlsson, R., R. Renkawitz, and V. Lobanenkov. 2001. CTCF is a uniquely versatile transcription regulator linked to epigenetics and disease. Trends Genet. 17:520-527. [DOI] [PubMed] [Google Scholar]
- 47.Paulson, E. J., and S. H. Speck. 1999. Differential methylation of Epstein-Barr virus latency promoters facilitates viral persistence in healthy seropositive individuals. J. Virol. 73:9959-9968. [DOI] [PMC free article] [PubMed] [Google Scholar]
- 48.Peters, A. H., J. E. Mermoud, D. O'Carroll, M. Pagani, D. Schweizer, N. Brockdorff, and T. Jenuwein. 2002. Histone H3 lysine 9 methylation is an epigenetic imprint of facultative heterochromatin. Nat. Genet. 30:77-80. [DOI] [PubMed] [Google Scholar]
- 49.Puglielli, M. T., M. Woisetschlaeger, and S. H. Speck. 1996. oriP is essential for EBNA gene promoter activity in Epstein-Barr virus-immortalized lymphoblastoid cell lines. J. Virol. 70:5758-5768. [DOI] [PMC free article] [PubMed] [Google Scholar]
- 50.Radkov, S. A., M. Bain, P. J. Farrell, M. West, M. Rowe, and M. J. Allday. 1997. Epstein-Barr virus EBNA3C represses Cp, the major promoter for EBNA expression, but has no effect on the promoter of the cell gene CD21. J. Virol. 71:8552-8562. [DOI] [PMC free article] [PubMed] [Google Scholar]
- 51.Rawlins, D. R., G. Milman, S. D. Hayward, and G. S. Hayward. 1985. Sequence-specific DNA binding of the Epstein-Barr virus nuclear antigen (EBNA-1) to clustered sites in the plasmid maintenance region. Cell 42:859-868. [DOI] [PubMed] [Google Scholar]
- 52.Reisman, D., and B. Sugden. 1986. trans-Activation of an Epstein-Barr viral transcriptional enhancer by the Epstein-Barr viral nuclear antigen 1. Mol. Cell. Biol. 5:3838-3846. [DOI] [PMC free article] [PubMed] [Google Scholar]
- 53.Rickinson, A. B., and E. Kieff. 1996. Epstein-Barr virus, p. 2397-2446. In D. Knipe and P. M. Howley (ed.), Fields virology, 3rd ed. Lippincott-Raven Publishers, Philadelphia, PA.
- 54.Ritzi, M., K. Tillack, J. Gerhardt, E. Ott, S. Humme, E. Kremmer, W. Hammerschmidt, and A. Schepers. 2003. Complex protein-DNA dynamics at the latent origin of DNA replication of Epstein-Barr virus. J. Cell Sci. 116:3971-3984. [DOI] [PubMed] [Google Scholar]
- 55.Schaefer, B. C., J. L. Strominger, and S. H. Speck. 1995. Redefining the Epstein-Barr virus-encoded nuclear antigen EBNA-1 gene promoter and transcription initiation site in group I Burkitt lymphoma cell lines. Proc. Natl. Acad. Sci. USA 92:10565-10569. [DOI] [PMC free article] [PubMed] [Google Scholar]
- 56.Schlager, S., S. H. Speck, and M. Woisetschlager. 1996. Transcription of the Epstein-Barr virus nuclear antigen 1 (EBNA1) gene occurs before induction of the BCR2 (Cp) EBNA gene promoter during the initial stages of infection in B cells. J. Virol. 70:3561-3570. [DOI] [PMC free article] [PubMed] [Google Scholar]
- 57.Speck, S. H., and J. L. Strominger. 1985. Analysis of the transcript encoding the latent Epstein-Barr virus nuclear antigen I: a potentially polycistronic message generated by long-range splicing of several exons. Proc. Natl. Acad. Sci. USA 82:8305-8309. [DOI] [PMC free article] [PubMed] [Google Scholar]
- 58.Strahl, B. D., and C. D. Allis. 2000. The language of covalent histone modifications. Nature 403:41-45. [DOI] [PubMed] [Google Scholar]
- 59.Sugden, B., and E. R. Leight. 2001. EBV's plasmid replicon: an enigma in cis and trans. Curr. Top. Microbiol. Immunol. 258:3-11. [DOI] [PubMed] [Google Scholar]
- 60.Sugden, B., and N. Warren. 1989. A promoter of Epstein-Barr virus that can function during latent infection can be transactivated by EBNA-1, a viral protein required for viral DNA replication during latent infection. J. Virol. 63:2644-2649. [DOI] [PMC free article] [PubMed] [Google Scholar]
- 61.Sung, N. S., J. Wilson, M. Davenport, N. D. Sista, and J. S. Pagano. 1994. Reciprocal regulation of the Epstein-Barr virus BamHI-F promoter by EBNA-1 and an E2F transcription factor. Mol. Cell. Biol. 14:7144-7152. [DOI] [PMC free article] [PubMed] [Google Scholar]
- 62.Thorley-Lawson, D. A. 2001. Epstein-Barr virus: exploiting the immune system. Nat. Rev. Immunol. 1:75-82. [DOI] [PubMed] [Google Scholar]
- 63.Thorley-Lawson, D. A., and A. Gross. 2004. Persistence of the Epstein-Barr virus and the origins of associated lymphomas. N. Engl. J. Med. 350:1328-1337. [DOI] [PubMed] [Google Scholar]
- 64.Vakoc, C. R., S. A. Mandat, B. A. Olenchock, and G. A. Blobel. 2005. Histone H3 lysine 9 methylation and HP1gamma are associated with transcription elongation through mammalian chromatin. Mol. Cell 19:381-391. [DOI] [PubMed] [Google Scholar]
- 65.Wang, J., S. E. Lindner, E. R. Leight, and B. Sugden. 2006. Essential elements of a licensed, mammalian plasmid origin of DNA synthesis. Mol. Cell. Biol. 26:1124-1134. [DOI] [PMC free article] [PubMed] [Google Scholar]
- 66.Wang, J., and B. Sugden. 2005. Origins of bidirectional replication of Epstein-Barr virus: models for understanding mammalian origins of DNA synthesis. J. Cell. Biochem. 94:247-256. [DOI] [PubMed] [Google Scholar]
- 67.Wang, Y., W. Fischle, W. Cheung, S. Jacobs, S. Khorasanizadeh, and C. D. Allis. 2004. Beyond the double helix: writing and reading the histone code. Novartis Found. Symp. 259:3-17. [PubMed] [Google Scholar]
- 68.Wensing, B., A. Stuher, P. Jenkins, M. Hollyoake, C. E. Karstegl, and P. J. Farrell. 2001. Variant chromatin structure of the OriP region of Epstein-Barr virus and regulation of EBER1 expression by upstream sequences and OriP. J. Virol. 75:6235-6241. [DOI] [PMC free article] [PubMed] [Google Scholar]
- 69.Woisetschlaeger, M., J. L. Strominger, and S. H. Speck. 1989. Mutually exclusive use of viral promoters in Epstein-Barr virus latently infected lymphocytes. Proc. Natl. Acad. Sci. USA 86:6498-6502. [DOI] [PMC free article] [PubMed] [Google Scholar]
- 70.Woisetschlaeger, M., C. N. Yandava, L. A. Furmanski, J. L. Strominger, and S. H. Speck. 1990. Promoter switching in Epstein-Barr virus during the initial stages of infection of B lymphocytes. Proc. Natl. Acad. Sci. USA 87:1725-1729. [DOI] [PMC free article] [PubMed] [Google Scholar]
- 71.Young, L., C. Alfieri, K. Hennessy, H. Evans, C. O'Hara, K. C. Anderson, J. Ritz, R. S. Shapiro, A. Rickinson, E. Kieff, et al. 1989. Expression of Epstein-Barr virus transformation-associated genes in tissues of patients with EBV lymphoproliferative disease. N. Engl. J. Med. 321:1080-1085. [DOI] [PubMed] [Google Scholar]
- 72.Young, L. S., and A. B. Rickinson. 2004. Epstein-Barr virus: 40 years on. Nat. Rev. Cancer 4:757-768. [DOI] [PubMed] [Google Scholar]
- 73.Yu, W., V. Ginjala, V. Pant, I. Chernukhin, J. Whitehead, F. Docquier, D. Farrar, G. Tavoosidana, R. Mukhopadhyay, C. Kanduri, M. Oshimura, A. P. Feinberg, V. Lobanenkov, E. Klenova, and R. Ohlsson. 2004. Poly(ADP-ribosyl)ation regulates CTCF-dependent chromatin insulation. Nat. Genet. 36:1105-1110. [DOI] [PubMed] [Google Scholar]
- 74.Yusufzai, T. M., H. Tagami, Y. Nakatani, and G. Felsenfeld. 2004. CTCF tethers an insulator to subnuclear sites, suggesting shared insulator mechanisms across species. Mol. Cell 13:291-298. [DOI] [PubMed] [Google Scholar]