Abstract
Current knowledge of human immunodeficiency virus type 1 envelope (Env) glycoprotein structure and function is based on studies of clade B viruses. We present evidence of sequence and structural differences in viral glycoprotein gp120 between clades B and C. In clade C, the C3 region α2-helix exhibits high sequence entropy at the polar face but maintains its amphipathicity, whereas in clade B it accommodates hydrophobic residues. The V4 hypervariable domain in clade C is shorter than that in clade B. Generally, shorter V4 loops are incompatible with a glycine occurring in the α2-helix in clade C, an intriguing association that could be exploited to inform Env immunogen design.
The genetic diversity of human immunodeficiency virus type 1 (HIV-1) is characterized by a relatively small number of genetically defined clades, or subtypes, A to K, and their recombinants (11). The envelope (Env) glycoproteins gp120 and gp41 are the main targets of antibody neutralization and are among the most variable of HIV proteins, with typical interclade and intraclade differences of 20 to 35% and 10 to 15%, respectively (7). An antibody-based HIV vaccine would ideally be capable of neutralizing viruses from diverse variants. Whether this will be feasible and how one might design a polyvalent cocktail that could improve the cross-reactive breadth of vaccine-induced responses can be informed by detailed examination of clade-specific differences in structure and mutational patterns.
Different regions of Env are under profoundly different selective pressures in the different clades (2, 7). Such differences could result from the evolution of lineage-specific structural or functional constraints in the proteins. They could also be due to transmission pressures (1a, 4, 6), spatially localized differences in neutralizing antibody binding sites (15), or different HLA frequencies in the circulating populations (12) and the consequent immune escape pressures. Codon-specific ratios of nonsynonymous to synonymous substitution rates (dN/dS; where a high ratio is indicative of positive as well as diversifying selection) (17) are dramatically different in the B- and C-clade V3 and C3 regions of gp120 (2, 7). The V3 loop from clade B has a high density of states with dN/dS of >1, whereas those from clade C show little variation (8). Conversely, clade C is more variable in the C3 region, particularly in the α2-helix, which is relatively conserved in clade B (2, 7). Neutralization studies on C-clade transmission pair Envs found α2-helix resistance-associated mutations (14a), indicating that immune pressure could be directed against it. Here we explore mutational patterns and their structural implications to better understand how positive selection might be driven by immune escape.
The analysis of clade differences is based on 582 C-clade and 634 B-clade sequences from the LANL HIV database as of January 2005. Subsets of 120 early and 68 late C sequences and 241 early and 211 late B sequences are also analyzed, where “early” and “late” sequences are defined as described by the sequence contributor as ≤12 and ≥24 months postseroconversion, respectively. Early sequences transmitted from mother to infant were excluded, as maternal neutralizing antibodies can select for transmission of neutralization-resistant virus (5, 16). Sample sets include only one sequence per individual and only sequences that span α2 through V4 (HXB2 amino acid numbering, gp120 335 to 418). Structural calculations are based on all-atom molecular dynamics simulations with AMBER (D. Pearlman, D. A. Case, J. W. Caldwell, W. S. Ross, I. T. E. Cheatam, D. M. Ferguson, U. C. Singh, P. Weiner, and P. Kollman. AMBER 4.1, University of California—San Francisco, 1995) using the PARM94 force field (3). The simulated system corresponded to a fully flexible gp120 of YU2 (PDB accession no. 1RZK) (10) with modeled loops solvated in ∼16,000 water molecules (14a). The phylogenic methodology is described elsewhere (1). The Wilcoxon rank test was used to compare distributions. For correlation statistics, Pearson's product moment correlation coefficients are provided, and a nonparametric Spearman's rank correlation produced similar P values (R Statistical Software program, 2.3.1 ed.; R Foundation for Statistical Computing). The sequence alignments used are available via (ftp at ftp-t10.lanl.gov/pub/BC_JVIROL.
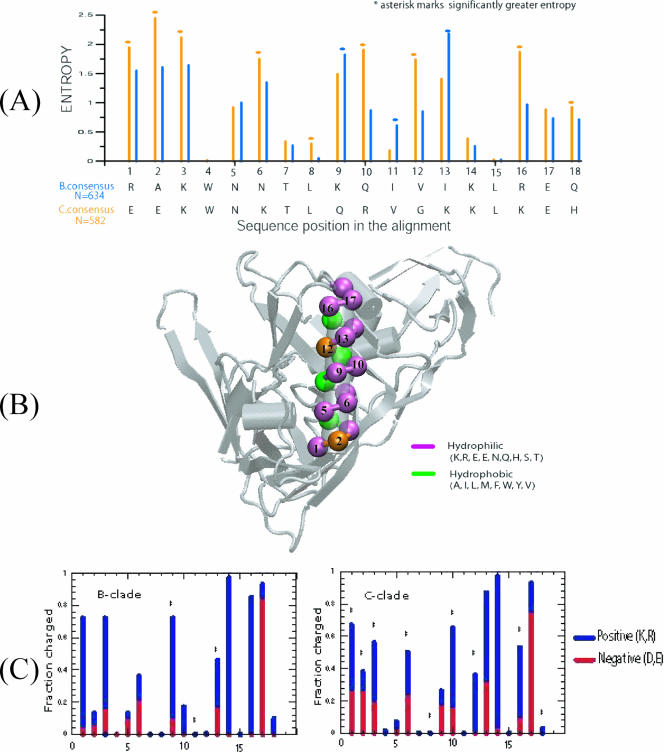
The α2-helix, comprising 18 residues (HXB2 numbering, 335 to 352), has different sequence entropy profiles for clades B and C. Sequence variability at each position in the alignment was evaluated using Shannon entropy (9, 18). The α2-helix of clade C is more variable than that of clade B (Fig. 1A), and the entropy at each position parallels differences previously found for dN/dS ratios (7). Structural mapping reveals that the C-clade α2-helix is amphipathic: i.e., it has distinct polar and nonpolar faces, an expected characteristic for a surface helix. The interior positions are highly conserved in both clades and form critical contacts with the gp120 core (Fig. 1B). In contrast, various positions in both clades appear on the solvent-exposed face. Positions 2 and 12 on the polar face are predominantly hydrophilic in clade C, whereas they can either be hydrophilic or hydrophobic in clade B. Thus, the amphipathic character of the α2-helix is maintained to a greater degree in clade C.
FIG. 1.
Sequence and structural characteristics of α2-helix from the C3 region of gp120 from clades B and C. (A) Sequence entropy profiles of α2-helix for clades B (blue) and C (orange). Sequence entropy at each position in the alignment is evaluated (582 C-clade and 634 B-clade sequences), and the consensus sequences are also shown for completeness. The asterisk marks significantly greater entropy. Positions 1, 2, 3, 6, 8, 10, 12, 16, and 18 exhibit statistically significantly higher sequence entropy scores in clade C; only positions 9 and 13 are found to have greater variability in clade B. Positions 4, 7, 8, 14, and 15 in both clades and position 11 within individual clades are conserved and are hydrophobic in nature. Substitutions at these positions also conform to maintain the hydrophobicity, as seen in positions 8 and 11, which show slight variability in clades C and B, respectively. (B) Mapping of residue positions from panel A onto the X-ray structure of HXB2 (10). The hydrophobic and hydrophilic residues are marked by green and violet, respectively. The dark amber colors in position 2 and 12 mark the differences in residue types between the clades. In clade C, those positions are hydrophilic, whereas in clade B, position 12 is hydrophobic and position 2 can either be hydrophobic or hydrophilic. In this X-ray structure, the V4 loop was not resolved (10). (C) Fraction of charged residues (blue, positive; red, negative) at each position of the α2-helix of clades B and C as identified in panel A.
At 7 of the11 variable positions in the C-clade α2-helix, the two most commonly occurring amino acids switch between positively and negatively charged residues, whereas the B-clade variable positions tend to maintain similar charge (Fig. 1C). In both clades, the existence of charged or polar residues at these positions is easily understood in terms of solvent exposure. However, the reason for the differences in patterns of sequence variation is not clear. The α2-helix may be more exposed and therefore more antigenic in clade C, and the switch between positive and negative residues may facilitate immune escape. Alternatively, the greater hydrophobicity and maintenance of similar charge in specific residues in clade B could indicate that the α2-helix in clade B is shielded from the solvent by the V4 loop and/or by glycosylation.
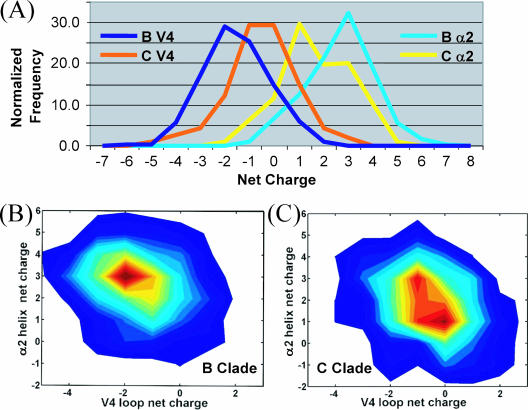
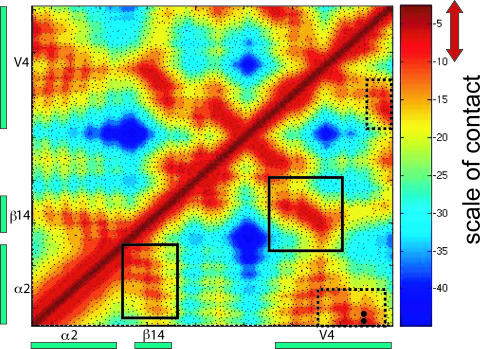
The B and C clades also differ in the number of charged residues in α2 and V4 (HXB2 numbering, 385 to 418) regions, as can be seen from the distributions of net charges (Fig. 2A). The α2-helix of clade B (+3) is more positive than that of clade C (+1) (P < 0.00001). The V4 of clade B is more negative (−2) than that of clade C (−1 to 0) (P < 0.00001). Interestingly, the α2 and V4 regions of both clades have a similar number of positively charged residues, but differ in the number of negatively charged residues that modulate the changes in net charges. A conserved charge anticorrelation between the α2 and V4 regions is maintained, with clade C (correlation coefficient, −0.324; P < 0.00001) exhibiting stronger anticorrelation than clade B (correlation coefficient, −0.185; P < 0.00001) (Fig. 2B and C). In V4, the C-terminal end is negatively charged and the N-terminal end is positively charged. The contact map (Fig. 3) of the α2-V4 region obtained from molecular dynamics simulations shows that the N-terminal half of α2 interacts strongly with the C-terminal half of V4. Therefore, the close proximity and spatial preference of charge residues suggest that the anticorrelation enables electrostatic interactions. This charge complementarity is statistically supported between two specific pairs of charged residues (marked in Fig. 3) that are spatially in close proximity. These two pairs of residues (HXB2 positions 335 and 412 and 337 and 412; P = 0.001 and 0.015, respectively, based on 10,000 randomizations) maintain complementarity of charges despite a high mutation rate in these positions.
FIG. 2.
Nature and correlations of charge distributions in α2 and V4 regions. (A) The net charge distributions are given for α2 (B, light blue; C, yellow) and V4 (B, dark blue; C, dark orange) regions of clades B and C. (B and C) Contour plots showing the correlation between net charges from α2 and V4 regions for clades B (B) and C (C). In clade B, +3 and −2 are the predominant set of preferred net charges for α2 and V4, whereas, a few sets of preferred net charges exist in clade C and are related to the different lengths of V4. Short and long V4 lengths contribute to peaks at +3 and −1 and +1 and −1 for α2 and V4, respectively, whereas medium V4 lengths (25 to 30) dominate the peaks at +1 and 0.
FIG. 3.
Distance matrix identifying the contacts proximal to α2 helix in gp120. This distance matrix shows the α2-helix-to-V4 region and was obtained from all-atom molecular dynamics simulations of gp120 in aqueous solution. The color gradient shown on the right indicates the spectrum of proximity (in Å), with red representing shorter and blue representing longer distances between residues. A potential contact is defined when two C-α atoms are less than 10 Å from each other, as shown with a red double arrow. Boxes with solid lines show contact between the C-terminal halves of α2 and β14; boxes with dashed lines show contact between the N-terminal half of α2 and the C-terminal half of V4. Black dots show pairs of residues with statistically significant charge complementarity.
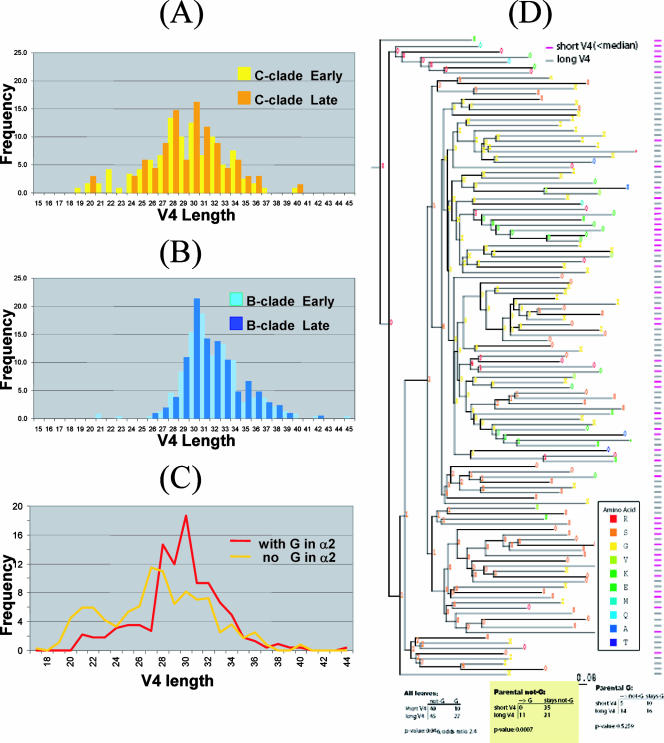
The V4 loop shows extensive length variation and clade dependency. Overall, the distribution of V4 of clade C is shifted towards shorter lengths (P < 0.00001). In the early stages following transmission, V1-V2 and V1-V4 lengths tended to be shorter in clades A and C, but not in clade B; shorter loops were postulated to enhance infectivity at the cost of exposing neutralization epitopes (1a, 4, 6). In Fig. 4A and B, the distribution of V4 lengths is plotted for early and late sequences; no significant difference was found for clades B (P = 0.276) and C (P = 0.507), although the shortest loops in clade C tended to be from the earliest samples (Fig. 4A). The number of glycosylation sites in V4 is correlated to loop lengths in clades B (correlation coefficient, 0.455; P < 0.00001) and C (correlation coefficient, 0.667; P < 0.00001).
FIG. 4.
Length characteristics of the V4 loop and their dependence on the core gp120 structure. (A) Distribution of V4 lengths for C-clade sequences from early (yellow) and late (orange) infection. (B) Distribution of V4 lengths for B-clade sequences from early (light blue) and late (dark blue) infection. (C) Distributions of V4 lengths with (red) or without (yellow) glycine in the middle of the α2-helix (positions 10 to 12) of clade C. Part C pertains mostly to clade C, since Gly is most abundant at position 12 of α2. Very few sequences from clade B contain Gly in α2, and those that do exhibit a similar behavior. (D) Phylogenetic analysis showing the correlation between the existence of glycine in the α2-helix and the longer length of the V4 loop for C-clade sequences. The short and long V4 loop sequences are indicated in the rightmost column in purple and gray, respectively. The probability of the amino acid under comparison is indicated by the numbers 0 through 9, where 0 represents <0.05, 1 represents between 0.05 and 0.15, etc., through 9, which represents between 0.85 and 0.95, with X representing >0.95. The color of the symbol indicates the most likely amino acid as per the legend.
Finally, certain residues within the α2-helix are associated with the V4 loop length in clade C. Glycine occurs more frequently in the middle of the α2-helix (positions 10 to 12) in clade C than in clade B (P < 0.00001). The presence of a Gly leads to a narrow distribution of long V4 loops in clade C (Fig. 4C) (P < 0.00001). Phylogeny-based analysis confirms this correlation is not explained by founder effects (P = 0.0007; Fig. 4D); i.e., a Gly in this position emerges repeatedly along terminal branches in the tree in the context of sequences that have long V4 loops. The additional entropy cost associated with Gly could disrupt the α2-helix (13, 14) and thus alter helix-V4 loop interactions. Alternatively, the lack of a side chain in Gly may eliminate interactions with “gatekeeper” residues that influence the length of the V4 loop. Interestingly, the presence of Gly in the α2-helix has a statistically significant correlation with V4 loop length of the early sequences (P = 0.0013) but not late sequences (P = 0.714) of clade C. The above identification marks the first such intriguing association between a core residue and the length of its proximal hypervariable loop in gp120. Importantly, such an association indicates that mutagenesis alterations in the V4 loop made in isolation need to be interpreted cautiously due to potential interactions (direct or indirect) between the core and the variable loop.
In summary, comparison of sequence and structural characteristics of domains in gp120 that are under distinct selection pressures in clades B and C reveals there are clade-specific patterns in variation with structural and antigenic implications. The immunological impact of these differences is not well understood, but they suggest that the α2-helix and V4 loop are key defining features of clade-specific patterns in variation and are interactive and these features should be considered when selecting vaccine antigens. These differences should be taken into account when trying to discern sequence-related correlations with neutralization sensitivity.
Acknowledgments
This work is supported by internal Los Alamos National Laboratory LDRD program P01 AI061734-01, R01-AI-58706, and grant AI067854 from the NIAID Center for HIV/AIDS Vaccine Immunology.
Footnotes
Published ahead of print on 13 December 2007.
REFERENCES
- 1.Bhattacharya, T., M. Daniels, D. Heckerman, B. Foley, N. Frahm, C. Kadie, J. Carlson, K. Yusim, B. McMahon, B. Gaschen, S. Mallal, J. I. Mullins, D. C. Nickle, J. Herbeck, C. Rousseau, G. H . Learn, T. Miura, C. Brander, B. Walker, and B. Korber. 2007. Founder effects in the assessment of HIV polymorphisms and HLA allele associations. Science 315:1583-1586. [DOI] [PubMed] [Google Scholar]
- 1a.Chohan, B., D. Lang, M. Sagar, B. Korber, L. Lavreys, B. Richardson, and J. Overbaugh. 2005. Selection for human immunodeficiency virus type 1 envelope glycosylation variants with shorter V1-V2 loop sequences occurs during transmission of certain genetic subtypes and may impact viral RNA levels. J. Virol. 79:6528-6531. [DOI] [PMC free article] [PubMed] [Google Scholar]
- 2.Choisy, M., C. H. Woelk, J.-F. Guégan, and D. L. Robertson. 2004. Comparative study of adaptive molecular evolution in different human immunodeficiency virus groups and subtypes. J. Virol. 78:1962-1970. [DOI] [PMC free article] [PubMed] [Google Scholar]
- 3.Cornell, W. D., P. Cieplak, C. I. Bayly, I. R. Gould, K. M. Merz, D. M. Ferguson, D. C. Spellmeyer, T. Fox, J. W. Caldwell, and P. A. Kollman. 1995. A 2nd generation force-field for the simulation of proteins, nucleic acids, and organic molecules. J. Am. Chem. Soc. 117:5179-5197. [Google Scholar]
- 4.Derdeyn, C. A., J. M. Decker, F. Bibollet-Ruche, J. L. Mokili, M. Muldoon, S. A. Denham, M. L. Heil, F. Kasolo, R. Musonda, B. H. Hahn, G. M. Shaw, B. T. Korber, S. Allen, and E. Hunter. 2004. Envelope-constrained neutralization-sensitive HIV-1 after heterosexual transmission. Science 26:2019-2022. [DOI] [PubMed] [Google Scholar]
- 5.Dickover, R., E. Garratty, K. Yusim, C. Miller, B. Korber, and Y. Bryson. 2006. Role of maternal autologous neutralizing antibody in selective perinatal transmission of human immunodeficiency virus type 1 escape variants. J. Virol. 80:6525-6533. [DOI] [PMC free article] [PubMed] [Google Scholar]
- 6.Frost, S. D. W., Y. Liu, S. L. K. Pond, C. Chappey, T. Wrin, C. J. Petropoulos, S. J. Little, and D. D. Richman. 2005. Characterization of human immunodeficiency virus type 1 (HIV-1) envelope variation and neutralizing antibody responses during transmission of HIV-1 subtype B. J. Virol. 79:6523-6527. [DOI] [PMC free article] [PubMed] [Google Scholar]
- 7.Gaschen, B., J. Taylor, K. Yusim, B. Foley, F. Gao, D. Lang, V. Novitsky, B. Haynes, B. H. Hahn, T. Bhattacharya, and B. Korber. 2002. Diversity considerations in HIV-1 vaccine selection. Science 296:2354-2360. [DOI] [PubMed] [Google Scholar]
- 8.Korber, B., R. Smith, K. Macinnes, and G. Myers. 1994. Trends in V3 loop sequences among 5 major HIV-1 genetic lineages. AIDS Res. Hum. Retrovir. 10:S55-S55. [Google Scholar]
- 9.Korber, B. T., R. M. Farber, D. H. Wolpert, and A. S. Lapedes. 1993. Covariation of mutations in the V3 loop of human immunodeficiency virus type 1 envelope protein: an information theoretic analysis. Proc. Natl. Acad. Sci. USA 90:7176-7180. [DOI] [PMC free article] [PubMed] [Google Scholar]
- 10.Kwong, P. D., R. Wyatt, S. Majeed, J. Robinson, R. W. Sweet, J. Sodroski, and W. A. Hendrickson. 2000. Structures of HIV-1 gp120 envelope glycoproteins from laboratory-adapted and primary isolates. Structure 8:1329-1339. [DOI] [PubMed] [Google Scholar]
- 11.Leitner, T., B. Foley, B. Hahn, P. Marx, F. McCutchan, J. Mellors, S. Wolinsky, and B. Korber. 2005. HIV Sequence Compendium, vol. LA-UR 06-0680. Theoretical Biology and Biophysics Group, Los Alamos National Laboratory, Los Alamos, NM.
- 12.Leslie, A., D. Kavanagh, I. Honeyborne, K. Pfafferott, C. Edwards, T. Pillay, L. Hilton, C. Thobakgale, D. Ramduth, R. Draenert, G. Le, G. Luzzi, A. Edwards, C. Brander, A. K. Sewell, S. Moore, J. Mullins, C. Moore, S. Mallal, N. Bhardwaj, K. Yusim, R. Phillips, P. Klenerman, B. Korber, P. Kiepiela, B. Walker, and P. Goulder. 2005. Transmission and accumulation of CTL escape variants drive negative associations between HIV polymorphisms and HLA. J. Exp. Med. 201:891-902. [DOI] [PMC free article] [PubMed] [Google Scholar]
- 13.O'Neil, K. T., and W. F. DeGrado. 1990. A thermodynamic scale for the helix-forming tendencies of the commonly occurring amino acid. Science 250:646-651. [DOI] [PubMed] [Google Scholar]
- 14.Richardson, J. S., and D. C. Richardson. 1988. Amino acid preferences for specific locations at the ends of alpha helices. Science 240:1648-1652. [DOI] [PubMed] [Google Scholar]
- 14a.Rong, R. S. Gnanakaran, J. M. Decker, F. Bibollet-Ruche, J. Taylor, J. N. Sfakianos, J. L. Mokili, M. Muldoon, J. Mulenga, S. Allen, B. H. Hahn, G. M. Shaw, J. L. Blackwell, B. T. Korber, E. Hunter, and C. A. Derdeyn. Unique mutational patterns in the envelope 2 amphipathic helix and acquisition of length in gp120 hypervariable domains are associated with resistance to autologous neutralization of subtype C human immunodeficiency virus type 1. J. Virol., in press. [DOI] [PMC free article] [PubMed]
- 15.Wei, X., J. M. Decker, S. Wang, H. Hui, J. C. Kappes, X. Wu, J. F. Salazar-Gonzalez, M. G. Salazar, J. M. Kilby, M. S. Saag, N. L. Komarova, M. A. Nowak, B. H. Hahn, P. D. Kwong, and G. M. Shaw. 2003. Antibody neutralization and escape by HIV-1. Nature 422:307-312. [DOI] [PubMed] [Google Scholar]
- 16.Wu, X., A. B. Parast, B. A. Richardson, R. Nduati, G. John-Stewart, D. Mbori-Ngacha, S. M. J. Rainwater, and J. Overbaugh. 2006. Neutralization escape variants of human immunodeficiency virus type 1 are transmitted from mother to infant. J. Virol. 80:835-844. [DOI] [PMC free article] [PubMed] [Google Scholar]
- 17.Yang, W., J. Bielawski, and Z. Yang. 2003. Widespread adaptive evolution in the human immunodeficiency virus type 1 genome. J. Mol. Evol. 57:212-221. [DOI] [PubMed] [Google Scholar]
- 18.Yusim, K., C. Kesmir, B. Gaschen, M. M. Addo, M. Altfeld, S. Brunak, A. Chigaev, V. Detours, and B. T. Korber. 2002. Clustering patterns of cytotoxic T-lymphocyte epitopes in human immunodeficiency virus type 1 (HIV-1) proteins reveal imprints of immune evasion on HIV-1 global variation. J. Virol. 76:8757-8768. [DOI] [PMC free article] [PubMed] [Google Scholar]


