

Abstract
CD8+ T cells are believed to play an important role in the control of human immunodeficiency virus type 1 (HIV-1) infection. However, despite intensive efforts, it has not been possible to consistently link the overall magnitude of the CD8+ T-cell response with control of HIV-1. Here, we have investigated the association of different CD8+ memory T-cell subsets responding to HIV-1 in early infection with future control of HIV-1 viremia. Our results demonstrate that both a larger proportion and an absolute number of HIV-1-specific CD8+ CCR7− CD45RA+ effector memory T cells (TEMRA cells) were associated with a lower future viral load set point. In contrast, a larger absolute number of HIV-1-specific CD8+ CCR7− CD45RA− effector memory T cells (TEM) was not related to the viral load set point. Overall, the findings suggest that CD8+ TEMRA cells have superior antiviral activity and indicate that both qualitative and quantitative aspects of the CD8+ T-cell response need to be considered when defining the characteristics of protective immunity to HIV-1.
The spread of human immunodeficiency virus type 1 (HIV-1) infection is now best described as a global pandemic, which continues to exert a huge toll of death and morbidity in communities worldwide (11). Efforts to combat its spread by design of an effective vaccine have been frustrated so far, and long-term therapy with antiviral drugs remains suboptimal because of drug toxicity, viral drug resistance, and high cost.
It is clear that the immune system can control HIV-1 replication to a certain extent, albeit with large interindividual variation. The CD8+ T-cell response is assumed to play an important role (10, 17), is regarded as being sufficiently robust to exert some control of viral replication following acute infection, and probably helps to establish the viral load set point, a key long-term prognostic indicator (22). Progression to AIDS in untreated HIV-1-infected individuals is in general inevitable. However, some patients progress to AIDS only slowly, if at all. These rare patients, known as long-term nonprogressors (LTNPs), may have superior immune responses, suggesting that in the majority of infected persons, the CD8+ T-cell response does not attain its full potential. Therefore, manipulation of the CD8+ T-cell response, e.g., by vaccination, may pave the way to partial and perhaps even permanent control of HIV-1 infection.
However, despite strong evidence for a role for CD8+ T cells in the control of HIV-1 infection (10, 17), attempts to statistically link the magnitude of the CD8+ T-cell response with control of HIV-1 replication in vivo have yielded contradictory results (1, 3, 8, 12, 21, 23). Indeed, the majority of studies have not confirmed an association of the magnitude of the CD8+ T-cell response with control of HIV-1 viral replication (1, 4, 12, 21), and one study actually showed that a large HIV-1-specific CD8+ T-cell response was linked to higher HIV-1 viral loads (21). In light of these studies, use of the magnitude of HIV-1-specific CD8+ T-cell responses alone as a predictor of clinical outcome is not appropriate. However, studies combining quantitative and qualitative examinations of CD8+ T-cell responses may enable the input of this factor in the control of HIV-1 infection to be determined. For example, a recent study using multicolor flow cytometry showed that LTNPs have more multifunctional HIV-1-specific CD8+ T cells than do persons with progressive disease (4).
In addition to examining the role of multifunctional cells, it is plausible that the general phenotype of the HIV-1-specific CD8+ T-cell response is linked to its antiviral capacity. Different memory T-cell subsets, defined according to phenotype, have different functional capabilities and roles (19, 25), and their relative contributions to the overall size of the response may relate to overall efficacy. For example, HIV-1-specific CD8+ CCR7− CD45RA− effector memory T cells (TEM cells), which are CCR7−, have a powerful and direct antiviral capacity; on the other hand, central memory T cells, which are CCR7+, have little direct antiviral activity but probably serve to replenish and sustain CD8+ TEM cell populations through secretion of interleukin-2 and proliferation. In addition, some TEM cells lose CD45RO and reexpress CD45RA (CD45RA reversion), although the significance of this is uncertain.
One of the limitations of studies that aim to correlate T-cell responses in chronic HIV infection with control of viremia is that it is difficult to discern whether the control of viremia is a consequence of the particular T-cell response or vice versa. Analyses of CD8+ T-cell responses in early HIV infection in relation to future viral load set point could help to discern between these two possibilities and might thus provide a more robust approach when evaluating the role of CD8+ T cells in determining viral load. This study set out to test the hypothesis that the HIV-1-specific CD8+ T-cell phenotype early in infection relates to the overall potency of the response and predicts control of HIV-1 viral replication.
MATERIALS AND METHODS
Study samples.
Peripheral blood samples from HIV-1-infected patients were obtained by venipuncture from 10 adult patients recruited, after providing informed consent, from the UCSF Options cohort. The date of HIV-1 infection was estimated based on one of the following approaches: (i) prior data on the median time from exposure to acute retroviral syndrome or an indeterminate HIV-1 antibody test (20), (ii) the midpoint between the last negative and the first positive HIV-1 antibody tests, or (iii) the level of a less sensitive HIV-1 antibody test if the optical density was between 0.5 and 1.0, a range in which there has been shown to be a linear relationship between the less sensitive antibody results and the days since seroconversion (18). The UCSF Committee for Human Research approved this study, and patients gave signed consent. All patients were treatment naïve at the time of sampling and remained untreated for more than 16 weeks after sampling (mean ± 1 standard deviation, 29 ± 7.6 weeks; range, 16 to 40 weeks). The viral load set point was calculated by averaging all viral load measurements between 6 and 12 months after the estimated date of infection. The average length of time used to calculate the viral load set point was 4.6 months. Peripheral blood mononuclear cells (PBMC) were isolated from heparinized whole blood by Ficoll-Paque PLUS density gradient centrifugation (Amersham Pharmacia, Uppsala, Sweden) and frozen in fetal bovine serum with 10% dimethyl sulfoxide. Frozen cells were thawed; washed twice in R15 medium (RPMI 1640; MediaTech, Herndon, VA) supplemented with 15% fetal calf serum (Gemini BioProducts, Woodland, CA), l-glutamine, penicillin, and streptomycin; and used directly in functional assays.
Cytokine flow cytometry and phenotyping.
Thawed PBMC were cultured with 1 μg/ml staphylococcal toxin B (Sigma-Aldrich, St. Louis, MO), 1 μg/ml HIV Gag p55 peptide mix (BD Biosciences, San Diego, CA), or R15 medium alone for 15 h. Brefeldin A (Sigma-Aldrich, St. Louis, MO) was added at a final concentration of 5 μg/ml after 1 h of culture. After culture, cells were washed in fluorescence-activated cell sorter (FACS) buffer (phosphate-buffered saline with 2 mM EDTA and 1% bovine serum albumin) and stained with allophycocyanin-Cy7-conjugated anti-CD4, phycoerythrin (PE)-Cy5.5-conjugated anti-CD8, biotinylated anti-CD45RA, PE-Cy7-conjugated anti-CCR7, fluorescein isothiocyanate (FITC)-conjugated anti-CD57, or PE-conjugated anti-CD27 (all from BD Biosciences, San Jose, CA) for 30 min at 4°C. The cells were subsequently washed, fixed in 1% paraformaldehyde for 15 min, and permeabilized in FACS permeabilizing solution II (BD Biosciences) for 20 min prior to being stained with energy-coupled dye-conjugated anti-CD3 (Beckman Coulter), Pacific Blue-conjugated streptavidin, or allophycocyanin-conjugated anti-gamma interferon (IFN-γ) (BD Biosciences, San Jose, CA). Finally, the cells were washed twice in FACS buffer before being acquired on an LSR II flow cytometer (BD Biosciences, San Jose, CA) modified from the standard configuration by the addition of a 150-mW green (532-nm) diode laser and the upgrade of the blue and red lasers to 100 mW and 25 mW, respectively. The green diode was used for the excitation of all PE tandem conjugates. All flow cytometry data were analyzed using FlowJo software (Tree Star, San Carlos, CA). The gating strategy used is depicted in Fig. 1. A wide forward-scatter (FSC) versus side-scatter plot was used to define lymphocytes, followed by exclusion of cell conjugates by using an FSC-area versus FSC-height gate. T cells were selected by gating on CD3+ cells, followed by selection of CD8+ T cells by gating on CD8+ CD4− cells. IFN-γ+ cells were defined using an allophycocyanin “fluorescence minus one” (FMO) sample. IFN-γ+ and IFN-γ− cells were further analyzed for expression of T-cell memory markers in a CD45RA versus CCR7 plot. Quadrant gates were set using PE-Cy7 FMO and Pacific Blue FMO. TEM cell (CCR7− CD45RA−) and HIV-1-specific CD8+ CCR7− CD45RA+ effector memory T cell (TEMRA cell) (CCR7− CD45RA+) populations were further analyzed for expression of CD57 and CD27. The gates for CD57 and CD27 were set using FITC FMO and PE FMO, respectively.
FIG. 1.

Gating strategy for phenotyping of HIV-1-specific CD8+ T cells. (A) T cells were selected based on CD3 expression. (B) CD8+ CD4− T cells were selected in a CD8 versus CD4 plot. (C) The allophycocyanin (APC) FMO sample was used to set the gate for (D) IFN-γ+ CD8+ T cells. (E) The PE-Cy7 FMO sample and (F) the Pacific Blue FMO sample were used to set the gates for TEM (CD45RA− CCR7−) and TEMRA (CD45RA+ CCR7−) CD8+ T cells. The expression levels of CCR7 and CD45RA were analyzed for (G) IFN-γ− CD8+ T cells and (H) IFN-γ+ CD8+ T cells. (I) The FITC FMO sample was used to set the gate for CD57+ cells. The expression of CD57 was analyzed for (J) HIV-1-specific CD8+ TEMRA cells and (K) HIV-1-specific CD8+ TEM cells. FMO indicates a sample stained with all antibodies except the one indicated. ECD, energy-coupled dye.
Statistical analysis.
Regression analysis was performed using intercooled Stata, version 9.0, for Macintosh (StataCorp, College Station, TX). Linear regression was performed using a robust model. Other statistical analyses were performed using nonparametric tests, such as the Wilcoxon test for paired samples and Spearman's correlation coefficient using GraphPad Prism 4 for Macintosh (GraphPad Software, San Diego, CA).
RESULTS AND DISCUSSION
The overall magnitude of CD8+ T-cell responses to HIV-1 GAG early in infection is not a strong predictor of future viral load set point.
In this study, we aimed to determine whether HIV-1-specific CD8+ T-cell responses at early phases of infection were associated with future control of HIV-1, as assessed by the viral load set point. We made use of eight-color flow cytometry to simultaneously determine the frequency and memory phenotype of CD8+ T cells responding by IFN-γ production to a pool of HIV-1 GAG-derived peptides (15-mer peptides overlapping by 11 amino acids, spanning the entire length of a consensus HIV-1 GAG sequence). The use of a peptide pool allowed us to identify HIV-1 GAG-specific CD8+ T cells recognizing an array of different epitopes within GAG, rather than only a few known conserved epitopes, as would be the case when using, e.g., HLA tetramers. It should be noted that we did not make use of individual autologous peptide pools for each patient, which might lead to an underestimation of the frequency of HIV-1-specific CD8+ T cells. We chose GAG as the antigen since several recent studies have indicated that CD8+ T-cell responses to HIV-1 GAG might be particularly relevant for control of HIV-1 viral replication (13, 15, 16). Ten treatment-naïve subjects with early HIV-1 infection were included in the study (Table 1). In addition to the overall magnitude of the HIV-1-specific CD8+ T-cell responses, we simultaneously determined the expression of CCR7, CD45RA, CD27, and CD57 on the HIV-1-specific CD8+ T cells. The gating strategy used to identify HIV-1-specific CD8+ T cells responding with IFN-γ production and their phenotype is depicted in Fig. 1.
TABLE 1.
Study subjects
| Patient | Viral loada | CD4 countb | ETI (wk)c | Patient age (yr) | Patient gender |
|---|---|---|---|---|---|
| P1 | 265 | 594 | 12 | 36 | Male |
| P2 | 68,000 | 588 | 7 | 34 | Male |
| P3 | 70,300 | 432 | 29 | 49 | Male |
| P4 | 61,800 | 616 | 12 | 42 | Male |
| P5 | 28,400 | 495 | 8 | 34 | Female |
| P6 | 1,380 | 558 | 14 | 35 | Male |
| P7 | 20,293 | 384 | 14 | 36 | Male |
| P8 | 69,800 | 608 | 20 | 40 | Male |
| P9 | 534 | 720 | 14 | 33 | Male |
| P10 | 7,670 | 640 | 26 | 23 | Male |
Viral load at study entry.
CD4+ T cells/μl blood at study entry.
ETI, estimated time of infection at study entry.
The frequency of IFN-γ+ CD8+ T cells in samples cultured in medium alone was below 0.1%, and this was subtracted from the response to HIV-1 GAG. The HIV-1-specific responses thus calculated ranged from 0.1 to 1.8% of the CD8+ T cells (average of 0.44%), with responses being found in 9 of 10 subjects. The frequency of responding HIV-1-specific CD8+ T cells was associated only weakly with the future viral load set point when analyzed by Spearman's correlation and linear regression (r = −0.60, P = 0.07) (Table 2 and Fig. 2A). In addition, we detected no significant relationship between the absolute number of responding HIV-1-specific CD8+ T cells (per μl of blood) and the viral load set point (r = −0.57, P = 0.12) (Table 2 and Fig. 2B). However, these findings left open the possibility that other measurable aspects of the HIV-1-specific CD8+ T-cell response, including the contribution of key CD8+ memory T-cell subsets, could be linked to control of HIV-1.
TABLE 2.
Statistical analysis linking the viral load set point with the HIV-1-specific CD8+ T-cell response early after infectiona
| Cell set/subset | Univariate analysis
|
Multivariate analysis
|
||||||||
|---|---|---|---|---|---|---|---|---|---|---|
| Percentageb
|
Absolute countc
|
Percentaged
|
Absolute counte
|
|||||||
| r | P | Coefficient (SE) | r | P | Coefficient (SE) | Coefficient (SE) | P | Coefficient (SE) | P | |
| All CD8+ | −0.60 | 0.07 | −0.438 (0.229)* | −0.57 | 0.12 | −0.060 (0.033)** | 0.496 (0.262) | 0.13 | ||
| TEMRA | −0.73 | 0.03 | −0.027 (0.006)† | −0.70 | 0.04 | −0.236 (0.039)*** | −0.053 (0.015) | 0.03 | −0.263 (0.104) | 0.042 |
| TEM | +0.82 | 0.01 | +0.029 (0.006)† | −0.45 | 0.23 | −0.035 (0.049)‡ | 0.034 (0.059) | 0.275 | ||
| CD57+ | −0.32 | 0.41 | −0.015 (0.008)§ | −0.78 | 0.02 | −0.218 (0.051)¶ | 0.013 (0.013) | 0.39 | ||
| CD27+ | −0.23 | 0.55 | −0.004 (0.010)¶¶ | −0.63 | 0.08 | −0.065 (0.068)‖ | −0.027 (0.010) | 0.06 | ||
Symbols: *, P = 0.092; **, P = 0.114; †, P = 0.002; ***, P < 0.001; ‡, P = 0.505; §, P = 0.091; ¶, P = 0.004; ¶¶, P = 0.627; ‖, P = 0.376. Bold type indicates a statistically significant correlation.
Spearman's correlation coefficient and univariate linear regression analysis were used to relate the overall HIV-1-specific CD8+ T-cell response (as a percentage of all CD8+ T cells), as well as the indicated phenotypes of HIV-1-specific CD8+ T cells (as a percentage of all HIV-1-specific CD8+ T cells), with the viral load set point.
Univariate analysis of the relationship between the absolute number of HIV-1-specific CD8+ T cells per μl blood with the indicated phenotypes and the viral load set point.
Multivariate regression analysis of the terms outlined in footnote b with the viral load set point (excluding the TEM cells, due to marked colinearity of TEM and TEMRA subsets).
Multivariate regression analysis of the terms outlined in footnote c with the viral load set point.
FIG. 2.

Occurrence of HIV-1-specific CD8+ TEMRA cells is linked to future viral control. (A) Percentage of CD8+ T cells responding with IFN-γ production in PBMC stimulated with HIV-1 GAG peptides versus future viral load set point. (B) Absolute number of CD8+ T cells per μl of blood responding with IFN-γ production in PBMC stimulated with HIV-1 GAG peptides versus future viral load set point. (C) Percentage of TEMRA cells (CCR7− CD45RA+) among HIV-1-specific CD8+ T cells versus future viral load set point. (D) Absolute number of HIV-1-specific CD8+ TEMRA cells per μl of blood versus future viral load set point. (E) Percentage of TEM cells (CCR7− CD45RA−) among HIV-1-specific CD8+ T cells versus future viral load set point. (F) Absolute number of HIV-1-specific CD8+ TEM cells per μl of blood versus future viral load set point. The correlations between the viral load set points and the HIV-specific CD8+ T-cell responses were tested by Spearman's test.
HIV-1-specific CD8+ T cells with a TEMRA phenotype are linked to lower viral load set points.
The phenotype of HIV-1-specific CD8+ T cells has been compared to those of CD8+ T cells specific for other viruses, e.g., cytomegalovirus (CMV). The HIV-1-specific CD8+ T-cell response appears to be skewed towards a TEM phenotype, with lower frequencies of TEMRA cells (which are thought to represent more mature effector cells) than are present with CMV-specific CD8+ T-cell responses (2, 6). It has therefore been proposed that HIV-1-specific CD8+ T cells are deficient in their maturation, and this may be one reason why control of HIV-1 infection is poor. If this is the case, it is anticipated that control of HIV-1 infection would be better if there were a greater number of TEMRA cells. In line with this hypothesis, we found that early HIV-1-specific CD8+ T-cell responses with a higher proportion of TEMRA cells were strongly and negatively linked with a lower subsequent viral load set point (r = −0.73, P = 0.03) (Table 2 and Fig. 2C). This finding supports and extends recently published data (14), where the fraction of HLA/HIV peptide tetramer-positive CD8+ T cells displaying a TEMRA phenotype was associated with better viral control in patients undergoing structured treatment interruption. Furthermore, responses were enriched for this subset in LTNPs (14). Overall, the data suggest that CD8+ TEMRA cells may have an enhanced capacity to enable sustained control of HIV-1 viral replication.
However, several important caveats need to be addressed before this conclusion can be reached. First, it is known that the overall magnitude of the CMV-specific CD8+ T-cell response correlates with phenotype (9, 24). Therefore, a greater number of TEMRA cells may be linked with larger responses rather than directly with control of HIV-1 infection. In the current study, however, the fraction of HIV-1-specific CD8+ T cells displaying a TEMRA phenotype was linked with viral load set point independently of the magnitude of the overall HIV-1-specific CD8+ T-cell response, as tested by multivariate regression analysis (r = −0.053 ± 0.015 [standard error], P = 0.025) (Table 2).
Second, it is possible that the differentiation of HIV-1-specific CD8+ T cells progresses over time starting from the time of infection. Since the subjects included in the study were sampled at different stages of early infection, it remained possible that the frequency of HIV-1-specific CD8+ T cells displaying a TEMRA phenotype reflected the time since infection. However, we could not detect any correlation between the time since the estimated date of infection and the frequency of HIV-1-specific CD8+ T cells with a TEMRA phenotype (data not shown). This indicated that the timing of the sampling was not a key determinant of the frequency of HIV-1-specific CD8+ T cells displaying a TEMRA phenotype.
Finally, nearly all of the responding HIV-1-specific CD8+ T cells displayed either a TEMRA or a TEM phenotype, and there was thus a close and inverse correlation between the two (r = −0.98, P < 0.0001). Therefore, a higher proportion of the response with a TEM phenotype was linked strongly and positively with a higher viral load set point (r = 0.82, P = 0.01) (Fig. 2E). It thus remained to be determined whether better viral control was associated with relative enrichment of the TEMRA cell subset or relative deficiency of the TEM cell subset.
The absolute number of HIV-1-specific TEMRA cells is inversely related to the viral load set point, and this is independent of the number of HIV-1-specific CD8+ TEM cells.
In an attempt to determine whether more HIV-1-specific CD8+ TEMRA cells early in infection, rather than fewer HIV-1-specific CD8+ TEM cells, was predictive of future viral control, we compared the viral load set point with the absolute number of HIV-1-specific CD8+ TEMRA and TEM cells at study entry. We found that a higher absolute number of HIV-1-specific CD8+ TEMRA cells was strongly associated with a lower viral load set point (r = −0.70, P = 0.04) (Table 2 and Fig. 2D). In contrast, the absolute number of HIV-1-specific CD8+ TEM cells was not related to the viral load set point (r = −0.45, P = 0.23) (Table 2 and Fig. 2F). Furthermore, the relationship between the absolute number of HIV-1-specific CD8+ TEMRA cells and the viral load set point was independent of the absolute number of HIV-1-specific CD8+ TEM cells, as tested by multivariate regression analysis (−0.263 lower log10 HIV-1 RNA per additional CD8+ TEMRA cell measured [per μl blood], P = 0.04) (Table 2). These results suggested that it is highly likely that TEMRA cells are directly beneficial to viral control.
Analysis of bulk CD8+ T cells from healthy individuals revealed that a fourfold- to fivefold-larger fraction of CD8+ TEMRA cells than CD8+ TEM cells contained perforin and granzyme (data not shown), a finding consistent with previous studies suggesting enhanced cytotoxic function for this subset (6, 7, 26). Together with the independent and apparently sustained effect of HIV-1-specific CD8+ TEMRA cells on viral load, these results further strengthened the proposed link between HIV-1-specific CD8+ TEMRA cells and better viral control and the hypothesis that these cells have stronger antiviral activity in vivo.
CD57 is expressed by a larger fraction of HIV-1-specific CD8+ TEMRA cells than TEM cells.
The maturation of CD8+ T cells has been described previously by use of several models, of which senescence, as measured by CD57 expression (5), and terminal differentiation, as indicated by TEMRA cell status (6), are commonly used. A larger fraction of HIV-1-specific CD8+ TEMRA cells than HIV-1-specific CD8+ TEM cells expressed CD57 (P = 0.004 by Wilcoxon matched-pairs test) in all except one individual (Fig. 3A). On average, 69% of the HIV-1-specific CD8+ TEMRA cells expressed CD57, compared to 43% of the TEM cells, although a large amount of overlap in CD57 expression was seen.
FIG. 3.
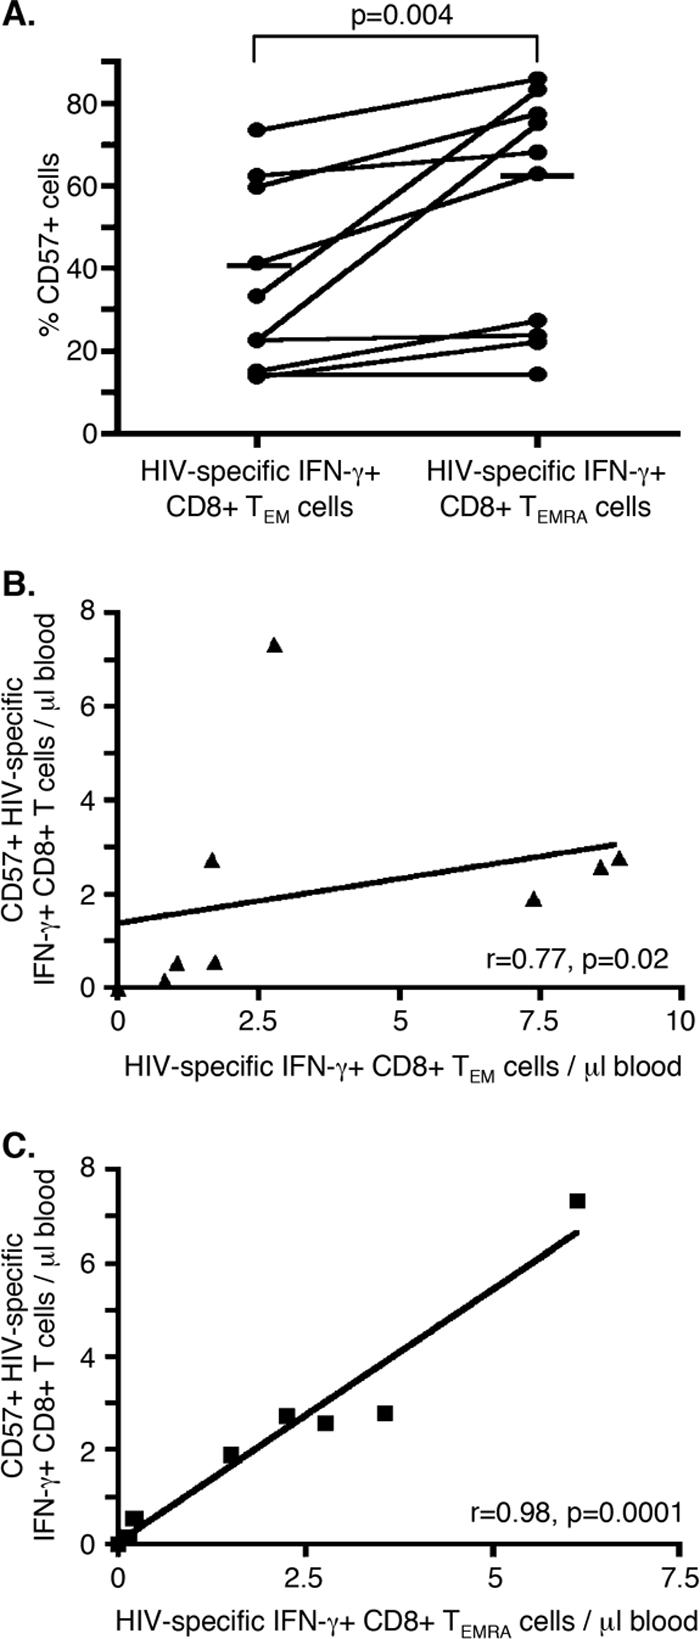
CD57 is expressed by a larger fraction of HIV-1-specific CD8+ TEMRA cells than TEM cells. (A) Percentages of HIV-1-specific CD8+ TEM and TEMRA cells that express CD57. Statistical significance was tested by the Wilcoxon matched-pairs test. (B) The absolute number of HIV-1-specific CD8+ TEM cells correlates with the absolute number of HIV-1-specific CD57+ CD8+ cells (r = 0.77, P = 0.02), as tested by Spearman's test. (C) The absolute number of HIV-1-specific CD8+ TEMRA cells correlates with the absolute number of HIV-1-specific CD57+ CD8+ cells (r = 0.98, P < 0.0001), as tested by Spearman's test.
The fraction of HIV-1-specific CD8+ T cells expressing CD57 was not a strong predictor of viral load set point (r = −0.32, P = 0.4) (Table 2). However, the absolute number of CD57+, HIV-1-specific CD8+ T cells was associated with a lower viral load set point (r = −0.78, P = 0.02) (Table 2). We found that the absolute number of HIV-1-specific CD8+ T cells expressing CD57 was closely correlated with the absolute number of HIV-1-specific CD8+ T cells with a TEMRA phenotype (r = 0.983, P < 0.0001) (Fig. 3C). It is possible, therefore, that the linkage between absolute numbers of HIV-1-specific CD57+ cells and viral load set points was dependent on the TEMRA cell subset. However, the marked colinearity between HIV-1-specific CD57+ CD8+ T cells and TEMRA cells prevented us from further dissecting the contributions of these two subsets to viral control in terms of absolute cell numbers. However, when controlling for the fraction of CD57-expressing cells among HIV-1-specific CD8+ T cells with multivariate regression analysis, the link between the viral load set point and the fraction of HIV-1-specific CD8+ T cells displaying a TEMRA phenotype remained significant, while the fraction of CD57+ CD8+ T cells was not associated with viral load set point (Table 2). This suggests that the TEMRA cell subset (rather than the CD57+ cell subset) was the subset more independently and consistently linked with control of HIV-1 infection.
Concluding remarks.
One of the major goals of HIV research is to develop efficient and safe vaccines for use on a global scale. However, well-defined correlates of immune protection from natural infection with HIV-1, which is crucial for the development of such a vaccine, are lacking. Here, we present evidence indicating that higher HIV-1-specific CD8+ TEMRA cell numbers early in infection, in either absolute or relative terms, predict a lower future viral load set point. Although our results are limited by the modest sample size, our results suggests that therapies or vaccine regimens inducing HIV-1-specific CD8+ TEMRA cells may move us one step closer to the goal of durable control or prevention of HIV-1 infection.
Acknowledgments
Support for this work was provided by the National Institute of Allergy and Infectious Diseases (NIAID U01 AI41531), UCSF/Gladstone Institute of Virology & Immunology Center for AIDS Research (NIAID P30 AI27763), the Wellcome Trust, the Swedish Research Council, and the Swedish Foundation for Strategic Research.
Footnotes
Published ahead of print on 21 March 2007.
REFERENCES
- 1.Addo, M. M., X. G. Yu, A. Rathod, D. Cohen, R. L. Eldridge, D. Strick, M. N. Johnston, C. Corcoran, A. G. Wurcel, C. A. Fitzpatrick, M. E. Feeney, W. R. Rodriguez, N. Basgoz, R. Draenert, D. R. Stone, C. Brander, P. J. Goulder, E. S. Rosenberg, M. Altfeld, and B. D. Walker. 2003. Comprehensive epitope analysis of human immunodeficiency virus type 1 (HIV-1)-specific T-cell responses directed against the entire expressed HIV-1 genome demonstrate broadly directed responses, but no correlation to viral load. J. Virol. 77:2081-2092. [DOI] [PMC free article] [PubMed] [Google Scholar]
- 2.Appay, V., P. R. Dunbar, M. Callan, P. Klenerman, G. M. Gillespie, L. Papagno, G. S. Ogg, A. King, F. Lechner, C. A. Spina, S. Little, D. V. Havlir, D. D. Richman, N. Gruener, G. Pape, A. Waters, P. Easterbrook, M. Salio, V. Cerundolo, A. J. McMichael, and S. L. Rowland-Jones. 2002. Memory CD8+ T cells vary in differentiation phenotype in different persistent virus infections. Nat. Med. 8:379-385. [DOI] [PubMed] [Google Scholar]
- 3.Betts, M. R., D. R. Ambrozak, D. C. Douek, S. Bonhoeffer, J. M. Brenchley, J. P. Casazza, R. A. Koup, and L. J. Picker. 2001. Analysis of total human immunodeficiency virus (HIV)-specific CD4+ and CD8+ T-cell responses: relationship to viral load in untreated HIV infection. J. Virol. 75:11983-11991. [DOI] [PMC free article] [PubMed] [Google Scholar]
- 4.Betts, M. R., M. C. Nason, S. M. West, S. C. De Rosa, S. A. Migueles, J. Abraham, M. M. Lederman, J. M. Benito, P. A. Goepfert, M. Connors, M. Roederer, and R. A. Koup. 2006. HIV nonprogressors preferentially maintain highly functional HIV-specific CD8+ T-cells. Blood 107:4781-4789. [DOI] [PMC free article] [PubMed] [Google Scholar]
- 5.Brenchley, J. M., N. J. Karandikar, M. R. Betts, D. R. Ambrozak, B. J. Hill, L. E. Crotty, J. P. Casazza, J. Kuruppu, S. A. Migueles, M. Connors, M. Roederer, D. C. Douek, and R. A. Koup. 2003. Expression of CD57 defines replicative senescence and antigen-induced apoptotic death of CD8+ T cells. Blood 101:2711-2720. [DOI] [PubMed] [Google Scholar]
- 6.Champagne, P., G. S. Ogg, A. S. King, C. Knabenhans, K. Ellefsen, M. Nobile, V. Appay, G. P. Rizzardi, S. Fleury, M. Lipp, R. Forster, S. Rowland-Jones, R. P. Sekaly, A. J. McMichael, and G. Pantaleo. 2001. Skewed maturation of memory HIV-specific CD8 T lymphocytes. Nature 410:106-111. [DOI] [PubMed] [Google Scholar]
- 7.Dunne, P. J., L. Belaramani, J. M. Fletcher, S. F. de Mattos, M. Lawrenz, M. V. Soares, M. H. Rustin, E. W. Lam, M. Salmon, and A. N. Akbar. 2005. Quiescence and functional reprogramming of Epstein-Barr virus (EBV)-specific CD8+ T cells during persistent infection. Blood 106:558-565. [DOI] [PubMed] [Google Scholar]
- 8.Edwards, B. H., A. Bansal, S. Sabbaj, J. Bakari, M. J. Mulligan, and P. A. Goepfert. 2002. Magnitude of functional CD8+ T-cell responses to the Gag protein of human immunodeficiency virus type 1 correlates inversely with viral load in plasma. J. Virol. 76:2298-2305. [DOI] [PMC free article] [PubMed] [Google Scholar]
- 9.Gamadia, L. E., E. M. van Leeuwen, E. B. Remmerswaal, S. L. Yong, S. Surachno, P. M. Wertheim-van Dillen, I. J. Ten Berge, and R. A. Van Lier. 2004. The size and phenotype of virus-specific T cell populations is determined by repetitive antigenic stimulation and environmental cytokines. J. Immunol. 172:6107-6114. [DOI] [PubMed] [Google Scholar]
- 10.Gandhi, R. T., and B. D. Walker. 2002. Immunologic control of HIV-1. Annu. Rev. Med. 53:149-172. [DOI] [PubMed] [Google Scholar]
- 11.Garber, D. A., G. Silvestri, and M. B. Feinberg. 2004. Prospects for an AIDS vaccine: three big questions, no easy answers. Lancet Infect. Dis. 4:397-413. [DOI] [PubMed] [Google Scholar]
- 12.Gea-Banacloche, J. C., S. A. Migueles, L. Martino, W. L. Shupert, A. C. McNeil, M. S. Sabbaghian, L. Ehler, C. Prussin, R. Stevens, L. Lambert, J. Altman, C. W. Hallahan, J. C. de Quiros, and M. Connors. 2000. Maintenance of large numbers of virus-specific CD8+ T cells in HIV-infected progressors and long-term nonprogressors. J. Immunol. 165:1082-1092. [DOI] [PubMed] [Google Scholar]
- 13.Geldmacher, C., J. R. Currier, E. Herrmann, A. Haule, E. Kuta, F. McCutchan, L. Njovu, S. Geis, O. Hoffmann, L. Maboko, C. Williamson, D. Birx, A. Meyerhans, J. Cox, and M. Hoelscher. 2007. CD8 T-cell recognition of multiple epitopes within specific Gag regions is associated with maintenance of a low steady-state viremia in human immunodeficiency virus type 1-seropositive patients. J. Virol. 81:2440-2448. [DOI] [PMC free article] [PubMed] [Google Scholar]
- 14.Hess, C., M. Altfeld, S. Y. Thomas, M. M. Addo, E. S. Rosenberg, T. M. Allen, R. Draenert, R. L. Eldrige, J. van Lunzen, H. J. Stellbrink, B. D. Walker, and A. D. Luster. 2004. HIV-1 specific CD8+ T cells with an effector phenotype and control of viral replication. Lancet 363:863-866. [DOI] [PubMed] [Google Scholar]
- 15.Honeyborne, I., A. Prendergast, F. Pereyra, A. Leslie, H. Crawford, R. Payne, S. Reddy, K. Bishop, E. Moodley, K. Nair, M. van der Stok, N. McCarthy, C. M. Rousseau, M. Addo, J. I. Mullins, C. Brander, P. Kiepiela, B. D. Walker, and P. J. R. Goulder. 2007. Control of human immunodeficiency virus type 1 is associated with HLA-B*13 and targeting of multiple Gag-specific CD8+ T-cell epitopes. J. Virol. 81:3667-3672. [DOI] [PMC free article] [PubMed] [Google Scholar]
- 16.Kiepiela, P., K. Ngumbela, C. Thobakgale, D. Ramduth, I. Honeyborne, E. Moodley, S. Reddy, C. de Pierres, Z. Mncube, N. Mkhwanazi, K. Bishop, M. van der Stok, K. Nair, N. Khan, H. Crawford, R. Payne, A. Leslie, J. Prado, A. Prendergast, J. Frater, N. McCarthy, C. Brander, G. H. Learn, D. Nickle, C. Rousseau, H. Coovadia, J. I. Mullins, D. Heckerman, B. D. Walker, and P. Goulder. 2007. CD8+ T-cell responses to different HIV proteins have discordant associations with viral load. Nat. Med. 13:46-53. [DOI] [PubMed] [Google Scholar]
- 17.Klenerman, P., Y. Wu, and R. Phillips. 2002. HIV: current opinion in escapology. Curr. Opin. Microbiol. 5:408-413. [DOI] [PubMed] [Google Scholar]
- 18.Kothe, D., R. H. Byers, S. P. Caudill, G. A. Satten, R. S. Janssen, W. H. Hannon, and J. V. Mei. 2003. Performance characteristics of a new less sensitive HIV-1 enzyme immunoassay for use in estimating HIV seroincidence. J. Acquir. Immune Defic. Syndr. 33:625-634. [DOI] [PubMed] [Google Scholar]
- 19.Lanzavecchia, A., and F. Sallusto. 2005. Understanding the generation and function of memory T cell subsets. Curr. Opin. Immunol. 17:326-332. [DOI] [PubMed] [Google Scholar]
- 20.Lindback, S., R. Thorstensson, A. C. Karlsson, M. von Sydow, L. Flamholc, A. Blaxhult, A. Sönnerborg, G. Biberfeld, H. Gaines, et al. 2000. Diagnosis of primary HIV-1 infection and duration of follow-up after HIV exposure. AIDS 14:2333-2339. [DOI] [PubMed] [Google Scholar]
- 21.Masemola, A., T. Mashishi, G. Khoury, P. Mohube, P. Mokgotho, E. Vardas, M. Colvin, L. Zijenah, D. Katzenstein, R. Musonda, S. Allen, N. Kumwenda, T. Taha, G. Gray, J. McIntyre, S. A. Karim, H. W. Sheppard, and C. M. Gray. 2004. Hierarchical targeting of subtype C human immunodeficiency virus type 1 proteins by CD8+ T cells: correlation with viral load. J. Virol. 78:3233-3243. [DOI] [PMC free article] [PubMed] [Google Scholar]
- 22.Mellors, J. W., C. R. Rinaldo, Jr., P. Gupta, R. M. White, J. A. Todd, and L. A. Kingsley. 1996. Prognosis in HIV-1 infection predicted by the quantity of virus in plasma. Science 272:1167-1170. [DOI] [PubMed] [Google Scholar]
- 23.Musey, L., J. Hughes, T. Schacker, T. Shea, L. Corey, and M. J. McElrath. 1997. Cytotoxic-T-cell responses, viral load, and disease progression in early human immunodeficiency virus type 1 infection. N. Engl. J. Med. 337:1267-1274. [DOI] [PubMed] [Google Scholar]
- 24.Northfield, J., M. Lucas, H. Jones, N. T. Young, and P. Klenerman. 2005. Does memory improve with age? CD85j (ILT-2/LIR-1) expression on CD8 T cells correlates with ‘memory inflation’ in human cytomegalovirus infection. Immunol. Cell Biol. 83:182-188. [DOI] [PubMed] [Google Scholar]
- 25.Sallusto, F., D. Lenig, R. Forster, M. Lipp, and A. Lanzavecchia. 1999. Two subsets of memory T lymphocytes with distinct homing potentials and effector functions. Nature 401:708-712. [DOI] [PubMed] [Google Scholar]
- 26.Wills, M. R., A. J. Carmichael, M. P. Weekes, K. Mynard, G. Okecha, R. Hicks, and J. G. Sissons. 1999. Human virus-specific CD8+ CTL clones revert from CD45ROhigh to CD45RAhigh in vivo: CD45RAhighCD8+ T cells comprise both naive and memory cells. J. Immunol. 162:7080-7087. [PubMed] [Google Scholar]