Abstract
We present a synthetic adaptation of the fibrillar adhesion surfaces found in nature. The structure consists of protruding fibrils topped by a thin plate and shows an experimentally measured enhancement in adhesion energy of up to a factor of 9 over a flat control. Additionally, this structure solves the robustness problems of previous mimic structures and has preferred contact properties (i.e., a large surface area and a highly compliant structure). We show that this geometry enhances adhesion because of its ability to trap interfacial cracks in highly compliant contact regimes between successive fibril detachments. This results in the requirement that the externally supplied energy release rate for interfacial separation be greater than the intrinsic work of adhesion, in a manner analogous to lattice trapping of cracks in crystalline solids.
Keywords: interface, fracture, fibrillar, lattice trapping, biomechanics
The ability to adhere two surfaces strongly together and then reversibly separate them, repeatedly, is a desirable capability that is rarely achievable using conventional fabrication techniques and materials. Nevertheless, fibrillar surfaces with these properties have evolved in nature on the adhesive surfaces of the feet of many lizards and insects. With such natural surfaces as inspiration, we have developed a fibrillar structure that produces a robust, reusable material with strongly enhanced adhesion compared with a flat control of the same material, with the enhancement resulting only from the modification of surface geometry.
The essential feature that our surfaces borrow from biology is the seta, a hair-like bristle having a diameter of 0.5–10 μm and terminating in one or more flattened, expanded tips (“spatulas”) at its contacting end. A number of biological studies (1–16) have found that arrays of setae are a common feature on the adhesion surfaces of many lizards and insects. In the biological literature, the shape, dimensions, and composition of setae from various species are described (1–5, 9–16). Also, the mechanical properties and adhesion force of a single gecko seta (7) and even a single spatula (17, 18) were the subjects of recent investigations. An important conclusion to emerge from these two studies is that setal arrays use noncovalent surface forces to achieve adhesion, and evidence suggests that geckos rely primarily on van der Waals and capillary forces (8, 18). As a result, the surface architecture is the primary design variable that has been adjusted in biological systems by evolution.
Because of the extraordinary adhesion ability of animals that possess setal arrays, several researchers have recently made an effort to mimic the biological setal geometry by using synthetic materials (19–26). It has been established theoretically that a fibrillar interface can increase both strength and interfacial toughness, compared with a flat control (21, 27–30). However, simple arrays of micropillars (19–21) have not exhibited stronger adhesion than flat control surfaces of the same materials. They tend to be quite fragile and do not function when fibrils buckle, adhere laterally to other fibrils, or adhere to the adjoining structure (19, 20). More recently, enhanced properties have been achieved by the addition of a terminal structure to the fibrils (23, 24).
It seems that simple pillar mimics of setal arrays do not replicate enough features of the biological systems. In particular, it appears that the role of highly flexible terminal spatula elements as compliant contacting surfaces is critical. Based on this notion, we have added a terminal film to a fibrillar array and have studied the properties of the resulting structure.
Results and Discussion
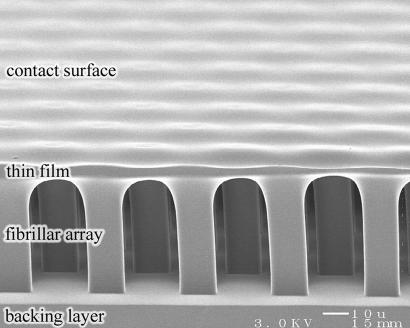
An example of the architecture we have developed is shown in Fig. 1. Although inspired by biological setal adhesion, it is distinct from any that we are aware of in nature, although the geometry of the setal system found in the insect Tettigonia viridissima is quite similar (31–33).
Fig. 1.
Synthetic fibrillar adhesion surface, including spatular features. Shown is an array of micropillars with a terminal film. (Scale bar, 10 μm.)
Addition of the terminal film to the fibrillar array is beneficial for a number of reasons. First, it maximizes the area of the contact surface. Second, it maintains the separation and uprightness of the pillars because there is an energy penalty associated with stretching the film that prevents neighboring fibrils from adhering to each other or to the backing layer (see Fig. 1). Further, due to its thinness and concomitant flexibility, the film tends to increase compliance locally, which allows intimate contact with the adherend to be attained with ease and maintained more tenaciously. The fact that the film is so compliant also means that it transfers very little load to the tip of a crack between successive fibril detachments. As we will see, this has a highly advantageous halting effect on interfacial crack propagation.
Another positive aspect of the structure shown in Fig. 1 is its ease of fabrication (see Materials and Methods for a detailed description). Briefly, a fibrillar array was constructed by molding poly(dimethylsiloxane) (PDMS) into lithographically etched silicon, as described previously (21). The array was placed onto a liquid PDMS film obtained by spin-coating. After the liquid partially wet the fibrillar array, the film was cured in place to obtain the final shape. The fibrils had square cross-sections with 14-μm sides, and fibril length was varied between 50 and 65 μm. The array of fibrils was arranged in a hexagonal pattern, with center-to-center spacing distance between fibrils set at 38, 62, or 87 μm. The terminal film had a thickness of ≈4 μm. PDMS has an elastic modulus of ≈3 MPa and surface energy of ≈20 mJ/m2.
The fact that we make our structure out of the soft, rubbery polymer PDMS distinguishes it from natural setae in lizards, which tend to be made of keratin, a protein with modulus on the order of 1 GPa. The lower modulus of PDMS results in significant stretching of the fibrils and backing layer under tension during pull-off. Some of this stored elastic energy is then dissipated during an elastic instability (to be discussed later), because of our unique geometry. It is not clear that this scheme is used by biological setal systems; however, by using a softer material and connected terminal film, we have traded some of the properties of animal setae, e.g., their self-cleaning ability (34, 35), for better adhesion. Moreover, the terminal film in our fibrillar samples is intended to accomplish many of the same ends as the crucial spatula structures found terminating most biological setae. Although biological spatulas are not connected between fibrils, they serve some of the same purposes by increasing contact area and interfacial compliance. Their disconnectedness probably allows better performance against a wider range of rough surfaces, but we do not explore that question here.
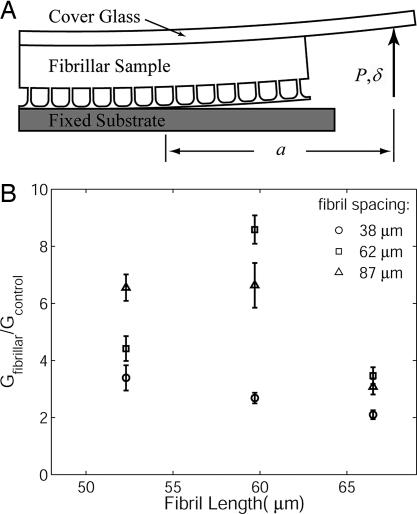
Adhesion of our synthetic samples was measured in two ways. The first is a modified version of the double cantilever beam (DCB) fracture experiment (36). The second is an indentation experiment using a spherical indenter. In the DCB experiment (Fig. 2A), the glass beam is displaced upward at a constant rate at a point near its right-hand edge, and the force, P, at this point is measured. Eventually, when the force becomes large enough, the interface between the contact surface of the sample and the substrate begins to separate, beginning at the right. A camera was placed above the transparent sample to record the distance, a, from the separation front to the load point. With these data, the work per unit area necessary to advance the crack, G, can be calculated from
 |
where B is the width of the sample (37). The first term within the parentheses is the total work input to the system, and the second term is the stored elastic energy. The latter assumes a linear force displacement response when the crack tip is stationary, which is verified by the experiments as a very good assumption for the glass/PDMS samples.
Fig. 2.
DCB experimental geometry and results. (A) Modified DCB experimental geometry. Displacement δ is controlled while the load, P, and crack length, a, are measured. (B) Normalized energy release rate G is calculated from the data by using Eq. 1 and is presented here as a function of fibril length and spacing. Results are quotients of mean values, with five trials performed to obtain each mean. Error bars were calculated by assuming that both fibrillar and control samples have random, independent uncertainty of 1 SD.
In Fig. 2B, we show the measured energy release rate, found by using Eq. 1 with the experimental data. Note that the fibrillar samples have a measured energy release rate that clearly exceeds that of a flat control, by a factor of 2–9. The flat control samples were fabricated together with the fibrillar samples, using the same method and materials, except that flat, unstructured PDMS replaced the fibrillar array in the control samples. The mean value of adhesion energy obtained for the control samples was 137 mJ/m2, although there was significant variation from wafer to wafer (SD for five wafers was 38 mJ/m2). Fibrillar adhesion values were normalized by the appropriate control sample fabricated on the same wafer.
From Fig. 2B, it is difficult to decipher the role of fibril length on the measured adhesion because of the narrow range of lengths tested. However, the spacing between fibrils certainly affects adhesion. It is clear from Fig. 2B that the lowest values of normalized energy release rate are observed for the smallest spacing. Beyond that, the data are less conclusive, although both the 62- and 87-μm spacing samples show significantly greater enhancement.
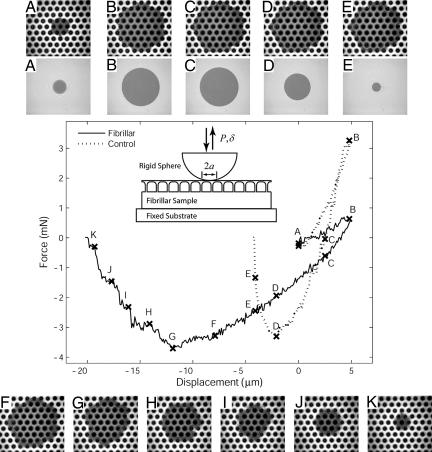
The indentation experiment (Fig. 3Inset in plot) allows direct, microscopic visualization of the contact interface during both healing and separation. A spherical indenter is pressed into contact at a constant displacement rate (1 μm/s). The plot in Fig. 3 shows an example of the measured force as a function of displacement for a very slight indentation. After the initial contact, the compressive force increases in magnitude. The magnitude of the compressive force then decreases as the indenter is retracted at the same displacement rate. Eventually, the force becomes tensile as a result of adhesion between the indenter and the sample.
Fig. 3.
Indentation experimental observations. The plot shows typical force–displacement data for shallow indentation of a flat control and a fibrillar sample (fibril length = 60 μm, nearest neighbor spacing = 62 μm). (Inset) Geometry of the indentation experiment. Displacement δ is controlled while the load, P, and contact radius, a, are measured. (Compressive force and displacement into the sample are taken to be positive.) Relative displacement between the indenter and sample increases initially until an indentation depth of 5 μm is reached and then decreases until complete separation occurs. (A–K) Photos corresponding to points indicated on the force vs. displacement curves.
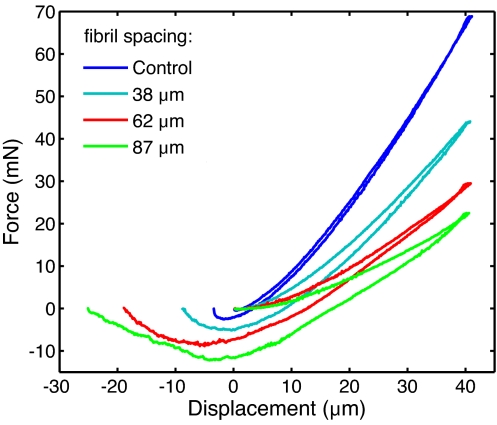
During indentation, the contact area is viewed with an inverted optical microscope. The still images in Fig. 3§ show the contact area at various points along the load vs. displacement curve. There are several substantial differences between the fibrillar and control samples. For the flat control sample, the contact area is circular, as expected for the spherical indenter. In the case of the fibrillar sample, the contact region resembles a hexagon at most points because of the patterning of the fibrils. Also note that the maximum compression force is significantly reduced for the fibrillar sample compared with the flat control at the same depth of indent, and the contact area is larger. Both of these observations indicate a larger compliance for the fibrillar sample. In fact, compliance increases systematically with increasing fibril spacing. This is not surprising and is demonstrated in Fig. 4, which shows force–displacement responses for deeper indentations of a sequence of samples differing only in fibril spacing. A similar trend was observed for samples of three different fibril lengths. A plot showing all results is provided as SI Fig. 7.
Fig. 4.
Effect of spacing on compliance. Indentation data are shown for specimens with different interfibrillar spacing and fixed fibril height. It is clear that the compliance and loading–unloading hysteresis both increase with increasing spacing between fibrils.
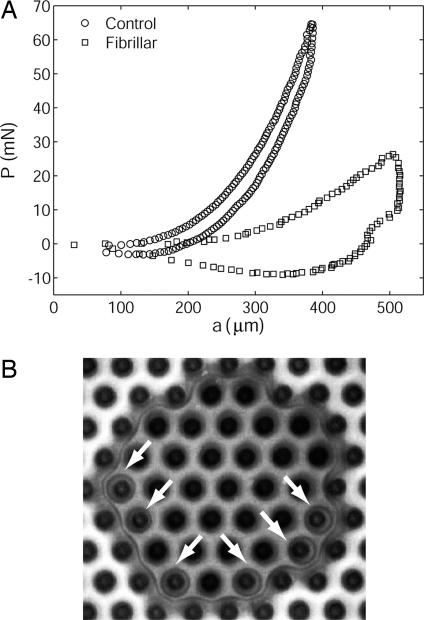
For the control samples, the contact area increases continuously with indentation depth and begins decreasing immediately when retraction of the indenter begins. In contrast, for the fibrillar sample there is strong hysteresis in the sense that the contact area remains pinned at the maximum value it achieved on compression nearly until the point of maximum tension. This “contact pinning” is evident from a comparison of Figs. 3 D and G, in which we see that the contact area is significantly reduced at the point of maximum tension for the control and is nearly maximal for the fibrillar sample. Fig. 5A better demonstrates contact pinning for a deeper indent. Note in that plot that, during retraction, the measured area clearly remains almost constant for the fibrillar sample until the force is reduced to ≈10 mN.
Fig. 5.
Contact pinning and a consequence. (A) This plot of load P vs. contact radius a for the indentation experiment reveals strong hysteresis in the fibrillar sample due to crack trapping. During retraction, a decreases with P for the control sample, whereas it remains nearly constant until tensile values of P are reached for the fibrillar sample (fibril length = 60 μm, nearest neighbor spacing = 62 μm). The experimental geometry is shown in Fig. 3 Inset. (B) Fig. 3F shown at larger magnification. Note that interfacial cavitation occurs under several fibrils ahead of the pinned crack tip as the indenter is retracted. Cavities are indicated by arrows. Nucleation of voids indicates a large tensile stress in front of the crack tip, a situation that occurs when the crack tip is pinned between fibrils while the external load continues to increase.
In Fig. 3 H–K, we see phenomena closely related to the contact pinning effect that occur after the point of maximum tension. Whereas the circular contact shrinks continuously for the flat control, the fibrillar sample decoheres incrementally in a more controlled way, with each hexagonal contact pinned as a temporary point of stability. In fact, the contact remains stable until the region around only a single fibril is in contact. See the photos in Fig. 3 H–K, and also note the step-like load reduction between the corresponding points on the load vs. displacement curve.
Enhanced adhesion was also observed in the indentation experiments. Compared with corresponding flat controls, the pull-off force of the indenter was found to be a factor of 1.5–3.5 greater for the fibrillar samples. The role of fibril spacing was clearer from the indentation data than from the DCB results (Fig. 4). A plot showing all pull-off force results is provided as SI Fig. 8. Complementary to the pull-off force results are findings regarding adhesion hysteresis, another measure of adhesion performance. As one can see from Fig. 4, the mismatch between the indentation and retraction force traces increases with fibril spacing. As a result, more work is required to fail the fibrillar samples, and the amount increases systematically with increased fibril spacing. Note the somewhat surprising aspect of these results: both pull-off force and adhesion hysteresis increase as the fibril density decreases. Previous models for adhesion enhancement in fibrillar interfaces (21, 29–30), based on a fixed amount of energy loss per fibril, would predict a decrease in adhesion with decreasing fibril density.
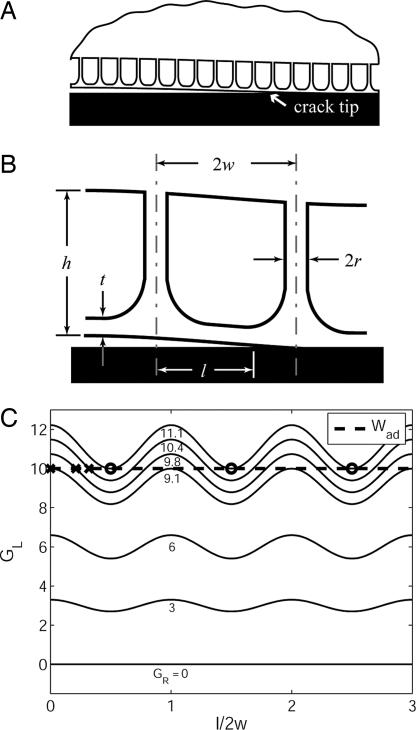
To understand why contact pinning directly results in enhanced adhesion in the fibrillar sample, we propose a qualitative theoretical explanation. Consider a two-dimensional version of the fibrillar array with a terminal film, as shown in Fig. 6A. Assume that the fibrils are backed by a semi-infinite medium of the same elastic material and that the film makes contact with a fixed, rigid surface. Also assume that a semi-infinite crack extends along the interface.
Fig. 6.
Qualitative theoretical explanation of the observed behavior. (A) Illustration of the two-dimensional fibrillar system considered. A semi-infinite crack extends along the interface between a fibrillated semi-infinite elastic body and a terminal film. (B) Illustration of the geometry of the repeating unit cell within the fibrillar strip and its associated geometric variables. (C) Variation of the local energy release rate available to the crack tip, GL, as a function of the crack length, l. This example assumes a constant, remotely supplied energy release rate, GR, and a sinusoidal variation due to the absorption and expulsion of energy by the fibrillar strip. The Xs indicate stable equilibrium crack positions; the Os indicate unstable ones. Note that when the crack propagates between unstable equlibria, GR > Wad.
Consider the energetics of extending the crack along the interface. First, recall that the thermodynamic work of adhesion, Wad, is the energy per unit area required to separate an interface and is a property of the two contacting surfaces only. Thus, the condition that must be satisfied for the crack to be in stable equilibrium is
where GL is the elastic strain energy released locally from the material just adjacent to the crack tip, per unit length of an infinitesimal extension of the crack, and l is the crack length measured from an arbitrary datum. (Note that the width of the sample perpendicular to the page is unity because we assumed a two-dimensional sample.)
Next note that, because of the periodic nature of the fibrillar microstructure near the interface, the rate of energy release GL available from the material will vary periodically as a function of crack position. Specifically, the strip of material near the interface containing the fibrillar array will alternately absorb and expel energy, depending on the location of the crack tip within the repeating geometric cell shown in Fig. 6B. If energy is input to the system remotely at a rate GR per unit length of crack extension, then by energy conservation, one has
where Ws is the elastic strain energy stored in the fibrillar strip. That is, the remote supply of energy is either absorbed by the fibrillar strip (dWs/dl > 0) or is available to do the work of extending the crack in the term GL. In the case in which the fibrillar strip is releasing energy (dWs/dl < 0), extra energy beyond that supplied remotely is available to propagate the crack. Observations from the indentation experiment indicate that energy is released from the strip whenever the crack passes under a fibril (dWs/dl < 0) and is absorbed when the crack is between fibrils (dWs/dl > 0).
The variation in energy release rate indicated by Eq. 3 is analogous to the phenomenon of lattice trapping of a crack (38), which has the consequence of enhanced work of fracture and irreversibility (39). It is reasonable to assume that the periodic energy storage and release rate will scale with the remote loading, or
where α is a dimensionless function of the geometry of the strip of fibrils. It is clear that α must be periodic in l, with period 2w. That is, as the crack traverses a periodic cell, the work absorbed equals the work released so that
 |
(Note that 2w is the spacing between fibrils. See Fig. 6B.)
By making use of Eq. 5 in Eq. 2, integration of Eq. 3 results in
 |
where ḠR is the mean value of the externally supplied energy release rate. Eq. 6 states that if the crack always propagates stably in accordance with Eq. 2, there will be no enhancement in macroscopically measured adhesion; this is a requirement for a purely elastic material. However, this outcome is highly unlikely because it would require constant and automatic adjustment of the remote loading system. More realistically, remote loading will change monotonically, in which case the crack will be forced to open at a higher remote energy release rate. Let us demonstrate this with the following example.
For convenience, let GR be constant and let α = ε cos(πl/w). Eqs. 3 and 4 then determine GL, which is plotted vs. l for various values of GR in Fig. 6C. (The corresponding value of GR is indicated next to each GL curve in Fig. 6C.) For the system in Fig. 6C, Wad = 10 and ε = 0.1, so that Eq. 2 is not satisfied for GR < 10/1.1, meaning that the crack heals for GR < 10/1.1. When GR = 10/1.1 ≈ 9.1, we see that the upper peak of the GL curve just satisfies Eq. 2. The equilibrium is stable, and so the crack cannot move beyond l = 0.
To move the crack, GR must be increased. As shown in Fig. 6C, the crack extends to the values of l indicated by Xs for GR = 9.8 and 10.4. These crack extensions are stable because dGL/dl < 0; that is, further extension of l beyond the X in each case results in the available energy release rate being less than the work of adhesion. For GR = 10/0.9 ≈ 11.1, however, the crack extends to the first O mark. Now the situation is different because dGL/dl is nonnegative at the first equilibrium location. Any further increase in GR results in unstable crack growth. Moreover, if one measured the energy release rate upon crack healing, the argument also holds in reverse, so that ḠR generally will be less than Wad upon healing, using a similar argument.
This demonstration of how a periodic structure can lead to hysteresis in a purely elastic material is very similar to the lattice trapping calculations mentioned previously (38). The difference in the GR necessary to advance and retract a crack is the reason for the contact pinning displayed in Figs. 3 and 5A.
To what extent can this mechanism enhance adhesion? For a fixed value of work of adhesion, the required remote energy release rate for unstable crack propagation is maximized when dWs/dl (or α) is maximized. When the crack tip is between fibrils, the energy release rate available to it is mediated by the thin film and scales as t3 if the film is modeled as a plate, where t is the film thickness. As t becomes vanishingly small, GL → 0, so that, to advance the crack, GR → ∞. Physically, this means that the plate is too thin to transfer energy to the crack tip. Of course, in reality, GR does not go to infinity. Rather, as GR becomes large, a very large tensile stress will develop under the fibrils directly ahead of the crack tip. This stress will eventually become large enough to nucleate an interfacial void or cavity underneath the fibril. Failure of the interface will then proceed as a result of the propagation of these voids. Note in Fig. 5B that voids do in fact nucleate ahead of the opening crack tip in several instances, as is the case with thin soft films in confined geometry (40, 41). Failure by void nucleation represents the maximum enhancement possible by the mechanism proposed here and is limited by individual fibril detachments, a situation that has been studied in detail elsewhere (21, 30). Before concluding, it should be noted that crack arrest and re-initiation have been observed to enhance adhesion, even in nonfibrillar systems (40–43). These cases involve incisions in thin confined films (40, 41), discontinuity of film thickness (42, 43), and the discontinuity of the elastic modulii of adjoining films (42). It may be possible to develop a unifying description of the enhancement of fracture toughness in these related systems by using the picture of crack trapping developed in this article.
In conclusion, we have created a synthetic structured adhesion surface inspired by biological setal adhesion surfaces. Through the addition of a highly compliant terminal film, our structure improves on previous mimics of biological setae in that it has a larger surface area and is more robust. We found that fibrillar samples provided an enhancement factor of 2–9 in the adhesion energy release rate and greatly increased contact compliance over the controls. Our experiments also showed that the fibrillar geometry tends to pin the contact upon retraction and fails incrementally in a more stable way than does the flat control. A qualitative theory was presented to explain these findings and showed that the behavior of our material at the micrometer scale is similar to the lattice trapping behavior observed at the atomic scale in brittle elastic solids.
Materials and Methods
Hydrophobic Self-Assembled Monolayers.
To decrease the surface energy of a silicon or glass surface, a self-assembled monolayer (SAM) of the molecule n-hexadecyltrichlorosilane was introduced there, as follows. First, the surface was cleaned with a solution of 70% H2SO4/15% H2O2/15% H2O for 30 min. Next, it was rinsed with deionized water and dried with N2. Then, it was cleaned with oxygen plasma, at a low enough power density to avoid introducing any roughness on the surface. Finally, the surface was placed in an evacuated chamber (20 mTorr) with an open vessel containing n-hexadecyltrichlorosilane liquid for 1 h.
Fabrication of PDMS Fibrillar Arrays.
Arrays of square cross-sectioned holes of the desired dimensions (5- to 15-μm sides) were introduced into silicon wafers by means of standard photolithography and deep reactive ion etch techniques. The depth of the holes was determined by the etch time and ranged from 50 to 65 μm. These Si “master wafers” were used to mold PDMS into pillars, as follows.
First, a hydrophobic SAM was formed on the surface of the Si master, as described above, making it a very low-energy surface and enabling the subsequent release of molded PDMS. Next, PDMS (Sylgard 184; Dow Corning, Midland, MI) was cast in liquid form (10:1 mass ratio of elastomer base to curing agent) against the Si master. To ensure a backing layer of uniform thickness behind the fibrillar array, feeler gage stock was used to space a confining glass slide 0.635 mm away from the Si master. The PDMS was then cross-linked in the mold by heating to 80°C for >1 h. To facilitate removal of the array of PDMS posts from the master, the entire structure was cooled in dry ice (−78.5°C) for 1 h after curing was complete. The fibrillar PDMS sample was then removed manually from the master.
Fabrication of Terminal Spatular Film.
A SAM of n-hexadecyltrichlorosilane was prepared on a Si wafer, as described above. Then, PDMS liquid was spin-coated on the wafer, with the thickness of the PDMS liquid film controlled by the spin speed. We obtained a film thickness of ≈4 μm for a spin speed of 6,000 rpm. Next, the fibrillar array was placed manually into the liquid film. Because both the fibrillar array and liquid film are PDMS, the liquid wets the fibrillar array such that some of the liquid in the film coats the fibrillar array. The liquid PDMS film is then cross-linked at 80°C for >1 h. After curing is complete, the fibrillar array and terminal film, now a single structure, may be removed manually from the SAM on the Si surface.
DCB Experimental Details.
A PDMS fibrillar array with terminal film was constructed as described above. To complete the sample preparation for DCB experiments, a rectangular piece of cover glass was attached to the side of the PDMS backing layer opposite the fibrillar array and film. Both the PDMS sample and cover glass were placed in oxygen plasma before the two were attached, to make a very strong bond. During this process, the film (contacting surface) of the fibrillar array was protected from exposure to the plasma by keeping it in contact with the surface against which it was fabricated.
The sample was then brought into contact with a Si wafer on which was formed a hydrophobic SAM formed, as described above. The Si wafer was fixed in place, and the glass slide was pushed upward in displacement control at 5 μm/s, as shown in Fig. 2A. A video camera above the sample was used to view and record the location of the receding contact line, and a load cell recorded the load.
Indentation Experimental Details.
After the DCB experiments were complete, the same samples were used in indentation experiments. A smooth glass sphere of radius 3.97 mm, fabricated in a flame, was indented a total of 5 or 40 μm into the sample and then retracted immediately. The speed of indentation and retraction was 1 μm/s, and the experiment was carried out in displacement control. A load cell recorded the load, and an inverted microscope was used to view and record the corresponding contact area.
Supplementary Material
Acknowledgments
We thank J. Y. Chung for assistance with technical details of sample fabrication and experiment setup, S. Vajpayee for help with measurements of sample dimensions, and Prof. A. Ruina of Cornell University for pointing out the connection of this work with work on lattice trapping of cracks. This work was supported by a grant from the DuPont Company and by start-up funds (to A.J.) from Lehigh University. W.L.N. was supported by the National Science Foundation under a Research Experiences for Undergraduates supplement to Grant CMS-0527785. This work was performed in part at the Cornell NanoScale Science and Technology Facility (Ithaca, NY), a member of the National Nanotechnology Infrastructure Network, which is supported by National Science Foundation Grant ECS 03-35765.
Abbreviations
- DCB
double cantilever beam
- PDMS
poly(dimethylsiloxane)
- SAM
self-assembled monolayer
- SAS
structured adhesion surface.
Footnotes
The authors declare no conflict of interest.
This article contains supporting information online at www.pnas.org/cgi/content/full/0703762104/DC1.
The full digital video files from which the still images were drawn are available online as supporting information (SI) Movies 1 and 2.
References
- 1.Dellit W-D. Jena Z Naturw. 1934;68:613–656. [Google Scholar]
- 2.Ruibal R, Ernst V. J Morphol. 1965;117:271–294. doi: 10.1002/jmor.1051170302. [DOI] [PubMed] [Google Scholar]
- 3.Hiller U. J Bombay Nat Hist Soc. 1976;73:278–282. [Google Scholar]
- 4.Stork NE. J Nat Hist. 1983;17:829–835. [Google Scholar]
- 5.Röll B. J Zool (London) 1995;235:289–300. [Google Scholar]
- 6.Irschick DJ, Austin CC, Petren K, Fisher R, Losos JB, Ellers O. Biol J Linn Soc. 1996;59:21–35. [Google Scholar]
- 7.Autumn K, Liang YA, Hsieh ST, Zesch W, Chan W-P, Kenny TW, Fearing R, Full RJ. Nature (London) 2000;405:681–685. doi: 10.1038/35015073. [DOI] [PubMed] [Google Scholar]
- 8.Autumn K, Sitti M, Liang YA, Peattie AM, Hansen WR, Sponberg S, Kenny TW, Fearing R, Israelachvili JN, Full RJ. Proc Natl Acad Sci USA. 2002;99:12252–12256. doi: 10.1073/pnas.192252799. [DOI] [PMC free article] [PubMed] [Google Scholar]
- 9.Rizzo NW, Gardner KH, Walls DJ, Keiper-Hrynko NM, Ganzke TS, Hallahan DL. J R Soc Interface. 2006;8:441–451. doi: 10.1098/rsif.2005.0097. [DOI] [PMC free article] [PubMed] [Google Scholar]
- 10.Williams EE, Peterson JA. Science. 1982;215:1509–1511. doi: 10.1126/science.215.4539.1509. [DOI] [PubMed] [Google Scholar]
- 11.Gorb SN. Proc R Soc London Ser B. 1998;265:747–752. [Google Scholar]
- 12.Eisner T, Aneshansley DJ. Proc Natl Acad Sci USA. 2000;97:6568–6573. doi: 10.1073/pnas.97.12.6568. [DOI] [PMC free article] [PubMed] [Google Scholar]
- 13.Gorb SN, Beutel RG. Naturwissenschaften. 2001;88:530–534. doi: 10.1007/s00114-001-0274-y. [DOI] [PubMed] [Google Scholar]
- 14.Gorb S. Attachment Devices of Insect Cuticle. Dordrecht, The Netherlands: Kluwer; 2001. [Google Scholar]
- 15.Scherge M, Gorb SN. Biological Micro and Nanotribiology: Nature's Solutions. Berlin: Springer–Verlag; 2001. [Google Scholar]
- 16.Kesel AB, Martin A, Seidl T. J Exp Biol. 2003;206:2733–2738. doi: 10.1242/jeb.00478. [DOI] [PubMed] [Google Scholar]
- 17.Huber G, Gorb SN, Spolenak R, Arzt E. Biol Lett. 2005;1:2–4. doi: 10.1098/rsbl.2004.0254. [DOI] [PMC free article] [PubMed] [Google Scholar]
- 18.Huber G, Mantz H, Spolenak R, Mecke K, Jacobs K, Gorb SN, Arzt E. Proc Natl Acad Sci USA. 2005;102:16293–16296. doi: 10.1073/pnas.0506328102. [DOI] [PMC free article] [PubMed] [Google Scholar]
- 19.Sitti M, Fearing RS. J Adhes Sci Technol. 2003;17:1055–1073. [Google Scholar]
- 20.Glassmaker NJ, Jagota A, Hui C-Y, Kim J. J R Soc Interface. 2004;1:23–33. doi: 10.1098/rsif.2004.0004. [DOI] [PMC free article] [PubMed] [Google Scholar]
- 21.Hui C-Y, Glassmaker NJ, Tang T, Jagota A. J R Soc Interface. 2004;1:35–48. doi: 10.1098/rsif.2004.0005. [DOI] [PMC free article] [PubMed] [Google Scholar]
- 22.Peressadko A, Gorb SN. J Adhes. 2004;80:247–261. [Google Scholar]
- 23.Gorb S, Varenberg M, Peressadko A, Tuma J. J R Soc Interface. 2007;4:271–275. doi: 10.1098/rsif.2006.0164. [DOI] [PMC free article] [PubMed] [Google Scholar]
- 24.Kim S, Sitti M. Appl Phys Lett. 2006;89:261911. [Google Scholar]
- 25.Yurdumakan B, Raravikar NR, Ajayan PM, Dhinojwala A. Chem Commun. 2005:3799–3801. doi: 10.1039/b506047h. [DOI] [PubMed] [Google Scholar]
- 26.Majidi C, Groff RE, Maeno Y, Schubert B, Baek S, Bush B, Maboudian R, Gravish N, Wilkinson M, Autumn K, Fearing RS. Phys Rev Lett. 2006;97 doi: 10.1103/PhysRevLett.97.076103. 076103. [DOI] [PubMed] [Google Scholar]
- 27.Persson BNJ. J Chem Phys. 2003;118:7614–7621. [Google Scholar]
- 28.Gao H, Yao H. Proc Natl Acad Sci USA. 2004;101:7851–7856. doi: 10.1073/pnas.0400757101. [DOI] [PMC free article] [PubMed] [Google Scholar]
- 29.Gao H, Wang X, Yao H, Gorb S, Arzt E. Mech Mater. 2005;37:275–285. [Google Scholar]
- 30.Tang T, Hui C-Y, Glassmaker NJ. J R Soc Interface. 2005;2:505–516. doi: 10.1098/rsif.2005.0070. [DOI] [PMC free article] [PubMed] [Google Scholar]
- 31.Gorb S, Jiao Y, Scherge M. J Comp Physiol A. 2000;186:821–831. doi: 10.1007/s003590000135. [DOI] [PubMed] [Google Scholar]
- 32.Jiao Y, Gorb S, Scherge M. J Exp Biol. 2000;203:1887–1895. doi: 10.1242/jeb.203.12.1887. [DOI] [PubMed] [Google Scholar]
- 33.Gorb S, Scherge M. Proc R Soc London Ser B. 2000;267:1239–1244. doi: 10.1098/rspb.2000.1133. [DOI] [PMC free article] [PubMed] [Google Scholar]
- 34.Hansen W, Autumn K. Proc Natl Acad Sci USA. 2005;102:385–389. doi: 10.1073/pnas.0408304102. [DOI] [PMC free article] [PubMed] [Google Scholar]
- 35.Hui C-Y, Shen L, Jagota A, Autumn K. Proceedings of the 29th Annual Meeting of the Adhesion Society; Blacksburg, VA: Adhesion Society; 2006. pp. 29–31. ISSN 1086-9506. [Google Scholar]
- 36.Blackman B, Dear JP, Kinloch AJ, Osiyemi S. J Mater Sci Lett. 1991;10:253–256. [Google Scholar]
- 37.Tada H, Paris PC, Irwin GR. The Stress Analysis of Cracks Handbook. New York: ASME Press; 2000. pp. 11–12. [Google Scholar]
- 38.Thomson R, Hsieh C, Rana V. J Appl Phys. 1971;42:3154–3160. [Google Scholar]
- 39.Rice JR. J Mech Phys Solids. 1978;26:61–78. [Google Scholar]
- 40.Ghatak A, Mahadevan L, Chung J, Chaudhury MK, Shenoy V. Proc R Soc London Ser A. 2004;460:2725–2735. [Google Scholar]
- 41.Chung JY, Chaudhury MK. J R Soc Interface. 2005;2:55–61. doi: 10.1098/rsif.2004.0020. [DOI] [PMC free article] [PubMed] [Google Scholar]
- 42.Kendall K. Proc R Soc London Ser A. 1975;341:409–428. [Google Scholar]
- 43.Crosby AJ, Hageman M, Duncan A. Langmuir. 2005;21:11738–11743. doi: 10.1021/la051721k. [DOI] [PubMed] [Google Scholar]
Associated Data
This section collects any data citations, data availability statements, or supplementary materials included in this article.


