Abstract
Directional tuning is a basic functional property of cell activity in the motor cortex. Previous work has indicated that cells with similar preferred directions are organized in columns perpendicular to the cortical surface. Here we show that these columns are organized in an orderly fashion in the tangential dimension on the cortical surface. Based on a large number of microelectrode penetrations and systematic exploration of the proximal arm area of the motor cortex while monkeys made free reaching 3D movements, it was estimated that (i) directional minicolumns are ≈30 μm in width, (ii) minicolumns with similar preferred directions tend to occur in doublets or triplets, and (iii) such minicolumns tend to repeat every ≈240 μm (estimated width of a column), with intermediate preferred directions represented in a gradient. These findings provide evidence for an orderly mapping of the preferred direction in the motor cortex.
Keywords: monkey, reaching, minicolumn
The directional tuning of motor cortical cell activity was first described for arm movements in 2D space (1), followed by a generalization for free reaching movements in 3D space (2–4). Preferred directions (PDs) range throughout the 3D directional continuum (3, 4) and are multiply represented in the arm area of the motor cortex (3). Early studies using arm movements in 2D space (5) indicated that the preferred directions of cells recorded in the exposed part of the motor cortex tended to be similar, whereas the preferred directions of cells recorded along the anterior bank of the central sulcus tended to change en bloc. Similar observations were made in later studies by using free reaching 3D arm movements (3, 6). These qualitative patterns suggested a columnar organization of the preferred direction, along the lines of similar kinds of evidence described for the somatosensory cortex (7). A quantitative analysis of the relations between the spread of the preferred directions along a penetration and the angle formed between the penetration and the anatomical columns in the motor cortex revealed a high positive correlation (0.756; P < 0.01; ref. 5), a finding that provided further support for the hypothesis of a columnar organization of the preferred direction. In fact, a similar quantitative analysis in the primary visual cortex (8) yielded comparable results to those found in the motor cortex (5). Although the results of studies using 2D arm movements are suggestive, they cannot form a solid basis for a rigorous investigation of the issue of the mapping of the preferred direction because a particular PD in 2D can come from an infinite number of preferred directions in 3D, with an elevation angle ranging from 0° to 180° (6). This consideration, and the fact that natural arm movements are typically unconstrained in 3D space, necessitates the use of free reaching 3D movements for a proper mapping study. A detailed statistical analysis of 3D reaching data (3) yielded two basic findings (6). First, for penetrations in the exposed part of the cortex, there was a continuum of ≈500 μm in depth with cells of similar preferred directions. Second, for penetrations along the anterior bank of the central sulcus, there was a repeating columnar pattern of similar PDs with a width of 50 to 100 μm and a repetition distance of ≈200 μm. These studies provided the background for the systematic reinvestigation of the mapping of the PDs presented in this article.
Results
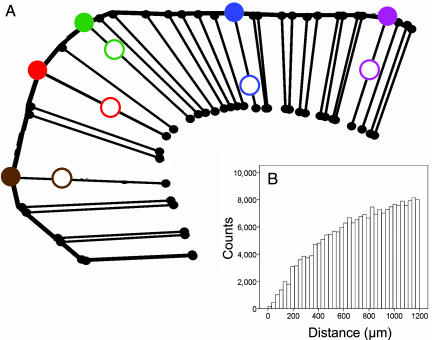
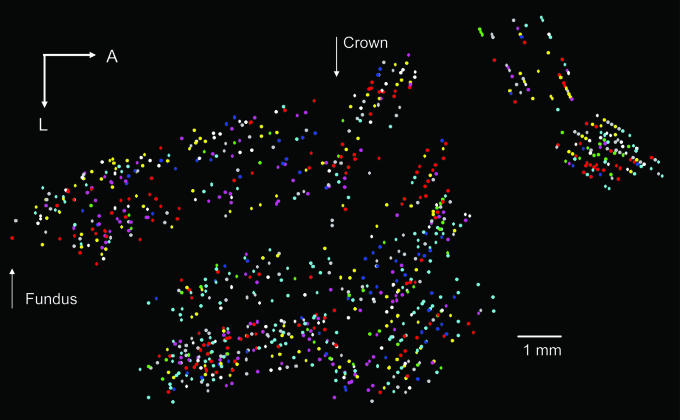
Two monkeys made 40 free, unconstrained reaching movements in each of eight directions in 3D space using the same apparatus and design as described previously (3). In a given day, 16 independently movable microelectrodes were inserted into the motor cortex contralaterally to the moving arm and advanced simultaneously in 150-μm steps (9–11). At every step, a run of 40 trials above was performed. The presence of directional tuning was assessed for thresholded multiunit records (10, 11). The approximate location on the cortical surface of the recording sites, as projected along anatomical columns (Fig. 1A), was determined as described previously (9). Of 2,385 recording sites analyzed, 985 (41.3%) were directionally tuned. The PDs at the recorded sites were multiply represented and widely distributed on the motor cortical surface (Fig. 2).
Fig. 1.
Design of the mapping experiment. (A) Schematic illustration of the projection of recording sites onto the cortical surface along anatomical columns. The procedure is described in detail in ref. 9. Open and slashed circles denote recording and projected sites, respectively. (B) Frequency distribution of pairwise distances on the cortical surface (≤1,200 μm) between projected recording sites (bin size, 30 μm).
Fig. 2.
Location on the flattened motor cortical surface (9) of the preferred directions of directionally tuned sites. The octant of the unit sphere to which a preferred direction belongs is color-coded depending on the sign of the directional cosines [x, y, z] as follows: blue, [x ≥ 0, y ≥ 0, z ≥ 0]; magenta, [x ≥ 0, y ≥ 0, z < 0]; green, [x ≥ 0, y < 0, z ≥ 0]; light gray, [x ≥ 0, y < 0, z < 0]; turquoise, [x < 0, y ≥ 0, z ≥ 0]; red, [x < 0, y < 0, z ≥ 0]; white, [x < 0, y ≥ 0, z < 0]; yellow, [x < 0, y < 0, z < 0]. A, anterior; L, lateral.
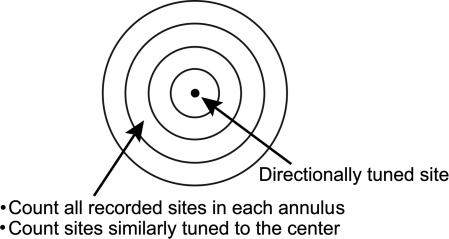
Next, we investigated the possible regularity in the representation of the PD as follows. On a given directionally tuned site, we fit a circular grid consisting of 30-μm annuli (Fig. 3) extending up to 1,200 μm from the center (the distribution of all pairwise distances up to 1,200 μm is shown in Fig. 1B). For every annulus, we counted the number of sites recorded from and the number of sites with similar directional tuning to the center site as determined by a correlation analysis (see Materials and Methods). This process was repeated for every directionally tuned recording site to derive average estimates of the prevalence of similar PDs away from a given one, determined as the fraction of these sites over the total recorded in an annulus. As expected, the total number of recording sites increased with distance away from the center of the grid as the area of the annulus increased. By contrast, the proportion of similarly tuned sites fell with distance, indicating a local enrichment of similar PDs. In fact, the fraction (percentage) of similarly tuned sites Fi in annulus i, with respect to the center site, decreased with distance Di (μm) from the center as a power fit:
where Fi is the fraction (percentage) of sites in the ith annulus, which are significantly correlated to the site at the center.
Fig. 3.
Circular grid used to count recording sites and sites with similar directional tuning to the center site. The fraction of similarly tuned sites over all sites (in a circular bin) was used for further analysis to remove potential influence of variations in the sampling distribution of recorded sites.
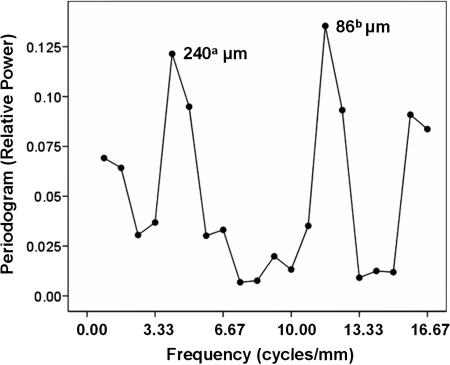
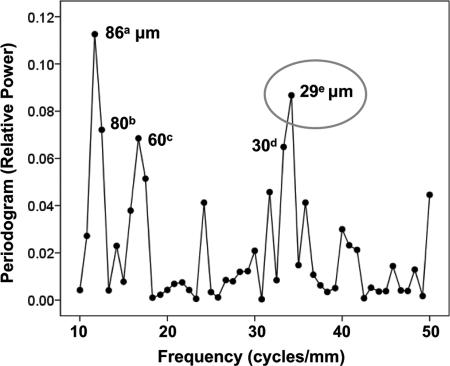
Next, the detrended data were subjected to spectral analysis to check for and identify possible spatial periodicities in the fluctuation of similarly tuned cells. The periodogram (Fig. 4) revealed two striking peaks at periods of 240 and 86 μm. A finer grain analysis of higher spatial frequencies using a 10-μm annulus revealed additional significant power at periods ≈30 and 60 μm (Fig. 5). These results suggest (i) a width of a minicolumn (12) of ≈30 μm, (ii) clustering of two to three minicolumns with similar directions, and (iii) a regular repetition of minicolumns with similar directions every 240 μm. It is noteworthy that the analysis of 2,366 records of single-unit activity (SUA) yielded statistically significant peaks in the normalized periodogram at similar frequencies as above, corresponding to a period of ≈200 μm (using 30-μm annulus binning) and 32 and 60 μm (using 10-μm annulus binning). This finding shows that the periodicities observed were not because of potentially overlapping fields. Finally, an analysis of the spatial distribution of nontuned multiunit sites (P > 0.25 for directional tuning in multiple regression) revealed a weak periodicity with a period of 171 μm, which, however, did not reach statistical significance in the permutation test (P = 0.08). Similar results were obtained when the level of nontuning was varied (e.g., P > 0.5).
Fig. 4.
Normalized periodogram (13) of detrended observed data using a circular grid of 30-μm annulus. The period of statistically significant points is displayed next to the points. The levels of statistical significance of the labeled points were as follows. a, P = 0.032; b, P = 0.017.
Fig. 5.
Normalized periodogram of detrended original data using a circular grid of 10-μm annulus. The levels of significance of the labeled points were as follows. a, P < 0.004; b, P = 0.018; c, P = 0.027; d, P = 0.03; e, P = 0.01.
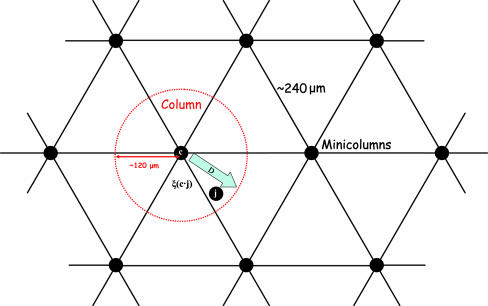
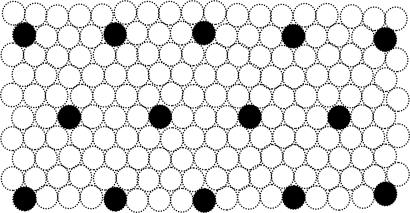
A tentative model of the mapping of PDs in the motor cortex is shown in Figs. 6 and 7, where given PD is represented by filled circles. There are two additional aspects of this model to be considered regarding the PDs within a 240-μm radius circle. First, there should be wide representations of the PDs; and, second, there should be a radial gradient of PDs becoming more and more dissimilar from that at the center of the circle, as distance increases away from the center, up to the radius of the circle (120 μm). We evaluated the first prediction by examining the distribution of the difference in polar angles (azimuth and elevation) between the one observed at the center of the circle and those observed in a given site within the circle. In accord with the earlier prediction, the angular differences above covered the full range of −180° to +180° for azimuth and −90° to +90° for elevation. Then we tested the second prediction by performing a regression analysis, where the dependent variable was the angle formed between the PD at the center site and the PD at a particular distance from it, and the independent variable was this distance. We found a highly statistically significant positive relation for a certain range of distances from 0 to 105 μm to 0 to 120 μm, indicating that the overall angular difference increased with the distance from the center, up to the midwidth of the hypothesized column; this relation disappeared for longer distances. The best fit was an exponential function:
 |
where ξcj is the angle (°) between the PD at the center and site at distance Dj (μm) (P = 0.003). This gradient is illustrated as an arrow in Fig. 6.
Fig. 6.
Schematic model of mapping of the preferred direction in motor cortex. The quantity ξ(c·j) denotes the angle formed between the PD vector c at the center of the circle and the PD vector j at site j.
Fig. 7.
Schematic diagram illustrating the periodic pattern of Fig. 6 in a filled patch of the map. Dimensions (and numbers of columns) are arbitrary.
Together these two findings lend strong, independent support to our model (Fig. 6). In addition, they provide approximate quantitative estimates of some key mapping parameters, as follows. Assuming a tangential area of a minicolumn (r = 15 μm) of 707 μm2 and a tangential area of a column (r = 120 μm) of 45,230 μm2, there are n = 45,230/707 = 64 minicolumns in a column, within which the unit sphere of PDs is mapped with a resolution of ≈360°/64 = 5.62° solid angle. It is noteworthy that this estimate of 64 minicolumns is roughly the number of minicolumns required to span all eight octants, as we estimated on different grounds (11).
Discussion
We demonstrated the orderly, repeated mapping of the 3D PD of arm movement in space on the motor cortical surface by systematically sampling a large cortical space. The width of ≈30 μm estimated from these data is comparable to the minicolumn width estimated in sensory systems (12). Given the known orderly topographic projections of the motor cortex to cortical and subcortical structures, it is likely that the repeated mapping of the PD might reflect and subserve the required multiple distribution of directional information. The additional peaks observed (at 60 and 86 μm in the multiunit and 60 μm in the single-unit records) probably reflect doublet or triplet clustering of minicolumns with similar PD. This interpretation is in keeping with the common experience of recording cells with similar PDs from the same electrode tip.
Although the data were collected with equally spaced electrodes and at regular depth steps, the spatial distribution was not affected by this scheme because the PD data were projected to the cortical surface along the anatomical columns (Fig. 1A), a procedure that resulted in a practically continuous distribution of distances between points on the flattened cortical surface (Fig. 1B). In addition, the periodicity analysis was performed on the fraction of the recording sites that were directionally tuned so that any potential peculiarities of the sampling distribution of the recording sites would be removed. The resulting fractions were detrended because periodicities cannot be properly assessed from a series of data in the presence of linear or curvilinear trends. Such trends would produce spurious boosting of the lower frequencies. Therefore, spectral analyses are applied on the residuals of the detrended data (13). Finally, the permutation test by which we assessed the statistical significance of the periodogram peaks involved keeping the actual recording sites while randomly permuting the PDs so that any peculiarities of the spatial distribution of the recording sites were taken into account. Finally, the flattening method cannot introduce power at some fundamental frequency. The purpose of flattening was to display projected recording sites in a plane figure (such as Fig. 2) while preserving the cortical surface distances between the projected sites in the folded cortex.
The model of organization of PD depicted in Fig. 6 bears directly on the question of origin (or formation) of the directional tuning curve. We propose that the regular, bell-shaped directional tuning curve is primarily the result of strong excitatory thalamic input to a particular column, followed by a mixture of excitatory and inhibitory inputs mediated by local interneurons acting in the tangential dimension. This idea is supported by the findings that (i) the onset latency of cell activity is shortest for movements in the PD and progressively longer with movements farther and farther away from it (1), and (ii) movements well away from the PD are often associated with abrupt cessation of activity suggestive of inhibitory effects (see e.g., fig. 4 in ref. 1). A major source of excitatory and inhibitory effects originating from pyramidal tract cell lies in its recurrent collaterals (14–16), in addition to known interneuronal anatomical connections (17, 18) and physiological mechanisms (19). Although these effects are well established, the exact spatial pattern of their distribution in the tangential cortical dimension is unknown. Our prior interpretation of the present findings posits the presence of an orderly regularity in this distribution, a hypothesis that remains to be tested.
Materials and Methods
Behavioral Task.
All neural data used in these studies were collected from two monkeys performing a 3D center-out reaching task. Details are provided elsewhere (2, 3). All animal procedures were approved by the relevant institutional boards.
Mapping Procedure.
The data analyzed in this study came from the experiments reported previously (9, 10). All recordings were obtained from the arm region of the motor cortex. The recorded area was contained within a region that extended 3 to 4 mm along the central sulcus and 7 to 12 mm in the direction perpendicular to the central sulcus. This region was centered ≈15 mm from the midline along the medial-lateral axis. The techniques used to construct a map of recording sites have been described in detail elsewhere (9). Briefly, an array of 16 electrodes was passed through the arm region of M1 while monkeys engaged in the reaching task. Before insertion, electrodes were coated in a fluorescent dye. Once the top of the neural activity was identified, electrodes were advanced at 150-μm increments until they reached white matter. Raw extracellular potentials were recorded at each site with a sampling frequency of 60 kHz and high-pass filtered at 0.5 kHz. We also analyzed data from SUA extracted from multiunit activity records by using Plexon software (Plexon, Inc., Dallas, TX) (10). In total, 2,385 multiunit activity and 2,366 SUA records were analyzed.
After the experiment, the monkeys were killed and the recorded area of the cortex was blocked and sectioned every 50 μm. Registered digital fluorescence and Nissl-stained images of each slice were used to reconstruct the trajectories made by the electrodes passing through the cortex. Electrode penetrations passed from the exposed surface of the precentral gyrus through the crown and into the anterior bank of the central sulcus (CS). Recording sites were transformed into a “flattened” coordinate system that unfolded the cortical surface about the crown of the CS. In all of the maps to be presented, the top and bottom borders of the map are orthogonal to the CS, with the fundus of the CS located on the far left. The left and right borders of the maps are parallel to the CS, with the most medial positions at the top of the maps. In these surface maps, recording sites are projected to the surface along the line defined by neighboring anatomical columns, as revealed by inspection of Nissl-stained sections.
Calculation of PDs and Correlation Analysis.
The presence of directional tuning was assessed by using multiple linear regression analysis (3). A one-tailed threshold of P < 0.05 was used because the directional tuning is well established in motor cortical cells. However, a statistically significant similarity between two sites was deemed to be present when the correlation coefficient between the mean discharge rates for the eight movement directions was 0.707 (P < 0.05, n = 8, df = 6). The average angle between the PDs of significantly correlated sites was 24.8°.
Spectral Analysis.
The raw periodogram was computed on the residuals of the power fit above and was normalized by computing relative periodogram values as follows:
 |
where ni is the normalized power value for the ith frequency, pi is the raw power value, and k is the number of frequencies for which the periodogram was calculated.
To determine the significance level for different points on the periodogram, we performed the following analysis. For each permutation, the x and y positions of the data were randomly permuted, and the same process of counting was carried out as for the original data. One thousand random permutations were performed. Periodograms were computed on the residuals of a power fit estimated for each permutation. This analysis yielded 1,000 normalized periodogram values for each frequency, which provided chance distributions against which actually observed values were assessed. For that purpose, we computed, for each frequency, the proportion of the 1,000 (permuted) periodogram values that were equal or higher to the observed one; this proportion was an estimate of the probability that the observed value could be because of chance. Finally, the same analyses were performed on 2,366 SUA sites.
Acknowledgments
We thank Scott Zeger for statistical advice on assessing the significance of periodogram peaks. This work was supported by U.S. Public Health Service Grant NS17413 (to A.P.G.), the U.S. Department of Veterans Affairs, and the American Legion Brain Sciences Chair.
Abbreviations
- CS
central sulcus
- PD
preferred direction
- SUA
single-unit activity.
Footnotes
The authors declare no conflict of interest.
This article is a PNAS Direct Submission.
References
- 1.Georgopoulos AP, Kalaska JF, Caminiti R, Massey JT. J Neurosci. 1982;2:1527–1547. doi: 10.1523/JNEUROSCI.02-11-01527.1982. [DOI] [PMC free article] [PubMed] [Google Scholar]
- 2.Georgopoulos AP, Schwartz AB, Kettner RE. Science. 1986;233:1416–1419. doi: 10.1126/science.3749885. [DOI] [PubMed] [Google Scholar]
- 3.Schwartz AB, Kettner RE, Georgopoulos AP. J Neurosci. 1988;8:2913–2927. doi: 10.1523/JNEUROSCI.08-08-02913.1988. [DOI] [PMC free article] [PubMed] [Google Scholar]
- 4.Caminiti R, Johnson PB, Urbano A. J Neurosci. 1990;10:2039–2058. doi: 10.1523/JNEUROSCI.10-07-02039.1990. [DOI] [PMC free article] [PubMed] [Google Scholar]
- 5.Georgopoulos AP, Kalaska JF, Crutcher MD, Caminiti R, Massey JT. In: Dynamic Aspects of Neocortical Function. Edelman GM, Cowan WM, Gall WE, editors. New York: Wiley; 1984. pp. 501–524. [Google Scholar]
- 6.Amirikian B, Georgopoulos AP. Proc Natl Acad Sci USA. 2003;100:12474–12479. doi: 10.1073/pnas.2037719100. [DOI] [PMC free article] [PubMed] [Google Scholar]
- 7.Powell TSP, Mountcastle VB. Bull Johns Hopkins Hosp. 1959;105:133–162. [PubMed] [Google Scholar]
- 8.Dow BM, Bauer R, Snyder AZ, Vautin RG. In: Dynamic Aspects of Neocortical Function. Edelman GM, Cowan WM, Gall WG, editors. New York: Wiley; 1984. pp. 59–61. [Google Scholar]
- 9.Naselaris T, Merchant H, Amirikian B, Georgopoulos AP. J Neurophysiol. 2005;93:2318–2330. doi: 10.1152/jn.00581.2004. [DOI] [PubMed] [Google Scholar]
- 10.Naselaris T, Merchant H, Amirikian B, Georgopoulos AP. J Neurophysiol. 2006;96:3231–3236. doi: 10.1152/jn.00487.2006. [DOI] [PubMed] [Google Scholar]
- 11.Naselaris T, Merchant H, Amirikian B, Georgopoulos AP. J Neurophysiol. 2006;96:3237–3247. doi: 10.1152/jn.00488.2006. [DOI] [PubMed] [Google Scholar]
- 12.Mountcastle VB. Brain. 1997;120:701–722. doi: 10.1093/brain/120.4.701. [DOI] [PubMed] [Google Scholar]
- 13.Warner RM. Spectral Analysis of Time-Series Data. New York: Guilford; 1998. [Google Scholar]
- 14.Stefanis C, Jasper H. J Neurophysiol. 1964;27:855–877. doi: 10.1152/jn.1964.27.5.855. [DOI] [PubMed] [Google Scholar]
- 15.Stefanis C, Jasper H. J Neurophysiol. 1964;27:828–854. doi: 10.1152/jn.1964.27.5.828. [DOI] [PubMed] [Google Scholar]
- 16.Brooks VB, Asanuma H. Arch Ital Biol. 1965;103:247–278. [PubMed] [Google Scholar]
- 17.Gatter KC, Sloper JJ, Powell TPS. Brain. 1978;101:543–553. doi: 10.1093/brain/101.3.543. [DOI] [PubMed] [Google Scholar]
- 18.Lund JS, Yoshioka T, Levitt JB. Cereb Cortex. 1993;3:148–162. doi: 10.1093/cercor/3.2.148. [DOI] [PubMed] [Google Scholar]
- 19.Jacobs KM, Donoghue JP. Science. 1991;251:944–947. doi: 10.1126/science.2000496. [DOI] [PubMed] [Google Scholar]


