Abstract
We and others have recently shown that loss of the mitochondrial membrane potential (Δψ) precedes apoptosis and chemical-hypoxia-induced necrosis and is prevented by Bcl-2. In this report, we examine the biochemical mechanism used by Bcl-2 to prevent Δψ loss, as determined with mitochondria isolated from a cell line overexpressing human Bcl-2 or from livers of Bcl-2 transgenic mice. Although Bcl-2 had no effect on the respiration rate of isolated mitochondria, it prevented both Δψ loss and the permeability transition (PT) induced by various reagents, including Ca2+, H2O2, and tert-butyl hydroperoxide. Even under conditions that did not allow PT, Bcl-2 maintained Δψ, suggesting that the functional target of Bcl-2 is regulation of Δψ but not PT. Bcl-2 also maintained Δψ in the presence of the protonophore SF6847, which induces proton influx, suggesting that Bcl-2 regulates ion transport to maintain Δψ. Although treatment with SF6847 in the absence of Ca2+ caused massive H+ influx in control mitochondria, the presence of Bcl-2 induced H+ efflux after transient H+ influx. In this case, Bcl-2 did not enhance K+ efflux. Furthermore, Bcl-2 enhanced H+ efflux but not K+ flux after treatment of mitochondria with Ca2+ or tert-butyl hydroperoxide. These results suggest that Bcl-2 maintains Δψ by enhancing H+ efflux in the presence of Δψ-loss-inducing stimuli.
The protooncogene bcl-2 is activated by the t(14;18) chromosomal translocation in follicular lymphoma (1–3) and can prevent apoptosis and some forms of cellular necrosis (4–6), although the detailed mechanisms of its anti-cell-death function remain unknown. Bcl-2 has been shown to localize in multiple membrane compartments, including the mitochondria (7, 8). Several models have been proposed to explain how Bcl-2 blocks cell death: (i) by sequestering the proforms of caspases by indirect interaction (9–11), (ii) by forming ionic channels (12, 13), and (iii) by inhibiting apoptosis-associated release of cytochrome c from the mitochondria, which leads to the activation of the caspase 3 (14, 15). However, all these models lack direct evidence of direct involvement in the anti-cell-death function of Bcl-2. Recently, we (16) and others (17) have reported that mitochondrial dysfunction such as membrane potential (Δψ) loss and the permeability transition (PT) precedes cell death and is prevented by Bcl-2 and Bcl-XL. Δψ, an electrical potential across the inner membrane created by H+ pumping during electron transfer, plays a key role in mitochondrial bioenergetics. The PT allows solutes with a molecular weight of less than 1,500 to equilibrate across the inner membrane (18, 19). It has been proposed that mitochondrial apoptogenic factors might be released through the PT during apoptosis, and in fact, a mitochondrial protein, apoptosis-inducing factor, which has the ability to induce apoptotic changes of the nucleus in vitro and the activation of caspases, was shown to be released by the PT (20, 21).
We studied the role of Bcl-2 in preventing Δψ loss from isolated mitochondria. Our findings suggested that in the presence of Δψ-loss-inducing stimuli, Bcl-2 maintains Δψ by enhancing proton efflux.
MATERIALS AND METHODS
Chemicals and Protein Purification.
SF6847 and bongkrekic acid were kindly provided by H. Terada and Y. Shinohara (Tokushima University, Japan), bongkrekic acid was also obtained from M. Klingenberg (University of Munich, F.R.G.). [3H]H2O and [3H]acetate were purchased from Amersham. 2′,7′-Bis(carboxyethyl)-5(6)-carboxyfluorescein (BCECF) was from Funakoshi (Tokyo). Other chemicals were from Wako Biochemicals (Osaka). Recombinant glutathione S-transferase (GST)–Bak fusion and GST proteins were expressed in Escherichia coli (strain XL/C) and purified by affinity chromatography on a glutathione-agarose column (Sigma).
Cell Line.
Human bcl-2 cDNA was inserted in the pUC-CAGGS vector (22) and transfected into AH130 cells (23) by electroporation. Expression of Bcl-2 protein was confirmed by Western blot analysis. Cell viability was measured by propidium iodide staining as described elsewhere (16).
Isolation of Mitochondria.
AH130 cells and AH130-Bcl-2 cells were injected into the abdominal cavity of a Donryu rat. Seven days after injection, ascites fluid was collected. Transgenic mice expressing the human bcl-2 gene in their livers have been described elsewhere (24).
After centrifugation of the ascites fluid, the cell pellet was treated with 7.8 mM sodium phosphate (pH 7.4) to disrupt red cells. After washing by centrifugation, the cells were homogenized with a glass–Teflon Potter homogenizer. Mouse livers were homogenized similarly. Mitochondria were isolated in 0.3 M mannitol/10 mM potassium Hepes, pH 7.4/0.2 mM EGTA, pH 7.4/0.1% fatty acid-free BSA by centrifugation at 2,500 × g for 10 min. The mitochondria were washed twice with this medium without EGTA to which 5 mM potassium phosphate was added and then suspended in it (25). Bcl-2 protein expression in the mitochondria was assessed by Western blot analysis.
Measurement of Biochemical Parameters.
All experiments using isolated mitochondria, except for those with the tert-butyl hydroperoxide (tBuOOH) and Ca2+ treatment and for ion measurement, were performed in buffer containing 0.3 M mannitol, 10 mM potassium Hepes (pH 7.4), 5 mM potassium phosphate (pH 7.4), 1 mM EDTA (pH 7.4), 0.1% fatty acid-free BSA, rotenone (1 μg/ml), and 10 mM succinate. For experiments with tBuOOH and Ca2+, EDTA was omitted, and for ion measurement, potassium Hepes was omitted to reduce the buffer action. In the experiments using Bak protein, mitochondria were preincubated with GST–Bak or GST protein for 30 min at 37°C in the buffer as described (26), and Δψ was measured. Mitochondrial respiration was measured with an O2 electrode. Respiration rates in state IV and state III were measured by the addition of 5 mM potassium succinate (pH 7.4), as substrate, or potassium succinate plus 0.3 mM ADP, respectively. Membrane potential was measured by a tetraphenylphosphonium chloride (TPP+) electrode and/or rhodamine 123 (Rh123) uptake (27). Mitochondrial swelling, the activity of aspartate aminotransferase, and the ATP concentration were measured as described elsewhere (25). External H+ and K+ concentrations were measured with a pH (Beckman) and K+ (Orion) electrode, respectively. Mitochondrial ΔpH and matrix pH were measured by using [3H]acetate (27) and BCECF (28), respectively.
RESULTS AND DISCUSSION
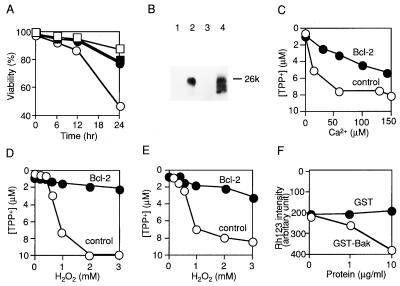
To explore the biochemical basis by which Bcl-2 acts to maintain Δψ during cell death, isolated mitochondria were used. Mitochondria were purified from two different sources: the rat ascites hepatoma cell line AH130 (23) and mouse livers. Mitochondria with overexpressed human Bcl-2 (Bcl-2 mitochondria) were obtained from human bcl-2 transfected AH130 and from the livers of bcl-2 transgenic mice in which human Bcl-2 expression is restricted to the liver (24). It has been shown that overexpression of Bcl-2 in the transgenic mice exerts a preventive effect on anti-Fas antibody-induced hepatic failure (24). Overexpression of Bcl-2 in AH130 efficiently prevented apoptosis induced by various reagents, including H2O2 (Fig. 1A). H2O2-induced apoptosis was also inhibited by two inhibitors of PT, cyclosporin A (CsA) and bongkrekic acid (Fig. 1A), strongly suggesting the direct involvement of mitochondrial dysfunction in apoptosis and confirming previous observations (17).
Figure 1.
Δψ loss induced by various reagents and its prevention by Bcl-2 in isolated mitochondria. (A) Effect of PT inhibitors on cell viability. AH130-Bcl-2 (□) and AH130 (○) cells were treated with H2O2 (0.25 mM). CsA (5 μM) (▪) and bongkrekic acid (50 μM) (•) were added 1 hr before treatment with H2O2. At the indicated times, cell viability was assessed by propidium iodide staining. Data are representative of three experiments. (B) Presence of human Bcl-2 in mitochondria isolated from AH130 cells (lane 1), AH130-Bcl-2 cells (lane 2), livers of nontransgenic mice (lane 3), and livers of Bcl-2-transgenic mice (lane 4). Mitochondria from AH130 and AH130-Bcl-2 cells were used at concentrations 10-fold lower than those from livers of nontransgenic and Bcl-2-transgenic mice. (C–E) Δψ of mitochondria (1 mg of protein per ml) isolated from AH130 cells (C and D) and mouse livers (E). Control (○) and Bcl-2 (•) mitochondria were treated with Ca2+ (C) or H2O2 (D and E) at the indicated concentrations for 5 min, and Δψ was assessed in state IV respiration by measuring the TPP+ concentration in the buffer with a TPP+ electrode. Data are representative of three experiments. (F) Δψ loss induced by Bak protein. Nontransgenic mitochondria (1 mg of protein per ml) were incubated for 30 min at 37°C with purified recombinant GST–Bak (○) and GST (•) protein in the reaction buffer, and Δψ was measured by Rh123 uptake.
The presence of human Bcl-2 in Bcl-2 mitochondria but not in control mitochondria was verified by Western blot analysis (Fig. 1B). Bcl-2 levels in AH130-Bcl-2 mitochondria were 10-fold higher than in transgenic-Bcl-2 mitochondria. Endogenous Bcl-2 was not detected in any mitochondria tested with an anti-mouse Bcl-2 polyclonal antibody that also cross-reacted with rat Bcl-2 (data not shown), consistent with extremely low levels or absence of bcl-2 mRNA in the liver (29, 30). The respiratory rate (RR) was measured by O2 consumption in state III and state IV, and the respiratory control ratio (RCR, defined as the ratio of RR in state III to state IV) showed no significant changes in the presence of Bcl-2. The RCR [RR (nmol of O2 per mg of protein per min) in state III/RR in state IV] was 76 ± 6/18 ± 3 for AH130 mitochondria, 72 ± 6/16 ± 6 for AH130-Bcl-2 mitochondria, 97 ± 5/19 ± 2 for nontransgenic mitochondria, and 105 ± 9/18 ± 3 for transgenic-Bcl-2 mitochondria. Similarly, the P/O ratio (amount of synthesized ATP divided by oxygen consumption in state III) showed no significant changes in the presence of Bcl-2 (1.64 ± 0.32 for AH130 mitochondria, 1.73 ± 0.26 for AH130-Bcl-2 mitochondria, 1.82 ± 0.21 for nontransgenic mitochondria, and 1.93 ± 0.33 for transgenic-Bcl-2 mitochondria). These data suggested that Bcl-2 had little, if any, effect on mitochondrial bioenergetics under normal conditions.
When AH130 mitochondria (1 mg of protein per ml) were treated with Ca2+ (Fig. 1C) or H2O2 (Fig. 1D), Δψ was reduced in a concentration-dependent manner as assessed by using a TPP+ electrode, whereas the decrease of Δψ was considerably smaller in AH130-Bcl-2 mitochondria. A similar effect of Bcl-2 on Δψ was observed in liver mitochondria treated with H2O2 (Fig. 1E), Ca2+, or antimycin A and was also observed by using low concentrations of mitochondria (0.1 mg of protein per ml; data not shown). These results indicated that Bcl-2 acts to maintain Δψ in isolated mitochondria exposed to Δψ-loss-inducing reagents. To examine whether the maintenance of Δψ by Bcl-2 in vitro was related to antiapoptotic activity, we tested the effect of the proapoptotic Bak protein in the Bcl-2 family (31–33) on mitochondrial Δψ. Incubation of nontransgenic mitochondria with recombinant GST–Bak fusion protein resulted in a decrease of Δψ in a concentration-dependent manner (Fig. 1F), whereas GST (as a control) induced no Δψ loss, strongly suggesting that the maintenance of Δψ by Bcl-2 reflects its antiapoptotic activity.
Several recent reports (16, 17) have suggested that Bcl-2 prevents the apoptosis-associated PT of the mitochondrial membrane. Because the decrease of Δψ leads to PT and, conversely, PT results in Δψ loss (19), we attempted to determine which of these phenomena was the primary target of Bcl-2. AH130 mitochondria treated with the reactive oxygen species tBuOOH showed both Δψ loss (Fig. 2A, trace 1) and the PT (Fig. 2B, trace 1, and C). Induction of the PT by tBuOOH was almost completely inhibited by CsA (Fig. 2B, trace 2), which has been shown to inhibit PT completely in some cases (18), whereas tBuOOH-induced Δψ loss was only slightly retarded by CsA (Fig. 2A, trace 2). In contrast, AH130-Bcl-2 mitochondria treated with tBuOOH showed inhibition of both Δψ loss and PT (Fig. 2 A and B, traces 3, and Fig. 2C), suggesting that Bcl-2 acts to inhibit Δψ loss rather than PT. Furthermore, in the absence of Ca2+ the protonophore SF6847 induced Δψ loss (Fig. 2D) but not PT (data not shown) in AH130 mitochondria, and Bcl-2 still maintained Δψ under these conditions (Fig. 2D). Similar results were obtained with hypoxia or treatment with antimycin A without Ca2+, both of which caused Δψ loss but not PT (data not shown), and the same findings were also observed in mouse liver mitochondria (data not shown). Thus, we concluded that Δψ but not PT was the target of Bcl-2 action.
Figure 2.
Bcl-2 prevents Δψ loss in the absence of the permeability transition. (A–C) Effect of Bcl-2 on Δψ and the permeability transition. AH130 mitochondria (A and B, traces 1 and 2; C, ○) and AH130-Bcl-2 mitochondria (A and B, traces 3; C, •) (both at 1 mg of protein per ml) were treated with 10 μM tBuOOH in the presence of 1 nmol of CsA per mg of protein (trace 2) or in its absence (traces 1 and 3). Δψ was measured by Rh123 uptake (A), and PT was assessed by swelling (B) and by release of aspartate aminotransferase (C) in state IV respiration. (D–F) Effect of Bcl-2 on Δψ loss induced by ionophores in the absence of Ca2+. Mitochondria (1 mg of protein per ml) isolated from cells were treated with SF6847 (D), carbonylcyanide m-chlorophenylhydrazone (CCCP) (E), or valinomycin (F) at the indicated concentrations for 5 min, and Δψ was measured with a TPP+ electrode in state IV respiration. Data are representative of three experiments.
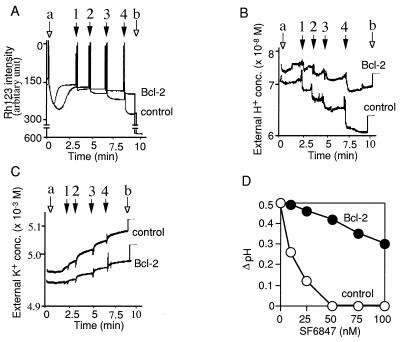
In mitochondria, the proton pump generates Δψ and the pH gradient, and addition of drugs such as ionophores alters the distribution of ions across the inner membrane, affecting Δψ and the pH gradient. Because Bcl-2 maintained Δψ even in the presence of protonophores such as SF6847 (Fig. 2D) or carbonylcyanide m-chlorophenylhydrazone (Fig. 2E) or ionophores such as valinomycin (Fig. 2F), which are known to directly facilitate the transport of protons and potassium ions, respectively, into the matrix space and to reduce Δψ, it is conceivable that Bcl-2 maintained Δψ by acting as an ion transporter or as a regulator of the ion transport generating Δψ. Therefore, we examined the effects of Bcl-2 on ion transport across the mitochondrial membrane. Our isolated mitochondrial system contained mainly protons and potassium ions as cations and phosphate and hydroxyl ions as anions. From technical reasons and also because of previous observations that the Bcl-XL ion channel in a synthetic lipid membrane showed more selectivity for cations than anions (12), we focused on two cations, H+ and K+. If a cation was involved in the maintenance of Δψ by Bcl-2, it should undergo efflux. As shown in Fig. 3A, successive addition of SF6847 (arrows 1–4) in the absence of Ca2+ induced Δψ loss in nontransgenic mitochondria but very little in transgenic-Bcl-2 mitochondria. In nontransgenic mitochondria, external H+ decreased as a function of successive SF6847 additions, finally dropping from 7.08 × 10⁻⁸ M to 6.03 × 10⁻⁸ M (Fig. 3B) as expected from the action of the protonophore. On the other hand, the matrix H+ concentration measured by BCECF increased from 2.09 × 10⁻⁸ M to 5.89 × 10⁻⁸ M. In the presence of Bcl-2, SF6847 also induced a transient decrease of the external H+ concentration (Fig. 3B). This transient decrease was followed by an increase to nearly the original level, which was not observed in nontransgenic mitochondria. Thus, the changes of the external and matrix H+ concentrations of transgenic-Bcl-2 mitochondria were from 7.59 × 10⁻⁸ M to 7.16 × 10⁻⁸ M and from 2.29 × 10⁻⁸ M to 2.85 × 10⁻⁸ M, respectively. These values would underestimate the total amount of H+ transported because of the buffer action, which was clearly shown in the elevation of the H+ concentration by only 50 nM after addition of 1 μM HCl to mitochondrial suspension (Fig. 3B, arrow b). Thus, the actual amount of H+ transported must be larger than that simply calculated from the difference in H+ concentrations. The ΔpH values calculated from these data during 40 nM SF6847 treatment (from 0.53 to 0.01 in nontransgenic mitochondria and from 0.52 to 0.4 in transgenic-Bcl-2 mitochondria) were very close to those obtained by the [3H]acetic acid assay (Fig. 3D). Given that K+ efflux also contributes to Δψ, the external K+ concentration increased less with transgenic-Bcl-2 mitochondria than nontransgenic mitochondria (Fig. 3C), indicating that the maintenance of Δψ by Bcl-2 does not depend on K+ efflux. ADP-induced Δψ loss, which is mainly caused by H+ influx through F0F1 ATPase, is reflected in a small decrease of the external H+ concentrations (Fig. 3 A and B, arrow a). In contrast, SF6847 induced a much larger decrease of the external H+ concentration (Fig. 3B, arrows 1–4), which was sufficient to reduce Δψ (Fig. 3A, arrows 1–4). These results strongly suggest that the maintenance of Δψ by Bcl-2 is achieved mainly by enhanced H+ efflux. The differences between nontransgenic and transgenic-Bcl-2 mitochondria in the initial levels of external H+ and K+ might have been caused by differences in mitochondrial volume (as assessed by using [3H]H2O and [14C]sucrose, the matrix volume of nontransgenic and transgenic-Bcl-2 mitochondria was 0.82 ± 0.13 and 1.02 ± 0.24 μl/mg of protein, respectively).
Figure 3.
Bcl-2 maintains Δψ and ΔpH in the presence of SF6847 by enhancing H+ efflux. (A–C) Mitochondria (3 mg of protein per ml) isolated from livers were treated with 0.1 mM ADP (arrow a), 10 nM SF6847 (arrows 1–4), 0.1% Triton X (A, arrow b), 1 μM HCl (B, arrow b), or 50 μM KCl (C, arrow b). Then Δψ was assessed by Rh123 uptake (A), the external H+ concentration was determined with a pH electrode (B), and the external K+ concentration was measured with a K+ electrode (C). (D) Effect of Bcl-2 on ΔpH after treatment with SF6847 in the absence of Ca2+. Mitochondria isolated from livers were treated with SF6847 for 10 min at the indicated concentrations and ΔpH was measured by using [3H]acetic acid. Results are representative of three experiments.
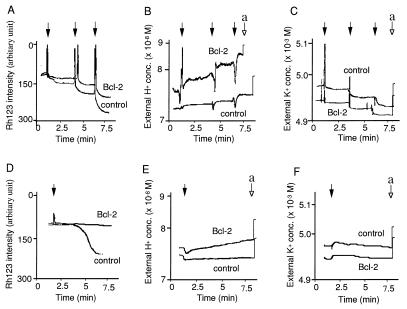
Addition of Ca2+ or tBuOOH induced Δψ loss in nontransgenic mitochondria but had little effect on transgenic-Bcl-2 mitochondria (Fig. 4 A and D). Although Bcl-2 had little effect on K+ influx (Fig. 4 C and F), transgenic-Bcl-2 mitochondria showed much larger H+ efflux after addition of Ca2+ or tBuOOH (Fig. 4 B and E) and ΔpH maintenance (data not shown) than nontransgenic mitochondria (Fig. 4 B and E). Thus, the data indicate that Bcl-2 maintains Δψ by directly or indirectly enhancing H+ efflux.
Figure 4.
Bcl-2 maintains Δψ in the presence of Ca2+ and tBuOOH by enhancing H+ efflux. Mitochondria (3 mg of protein per ml) isolated from livers were treated with 20 μM Ca2+ (A–C, solid arrows), 10 μM tBuOOH (D–F, solid arrow), 1 μM HCl (B and E, arrow a), or 50 μM KCl (C and F, arrow a). Then Δψ was assessed by Rh123 uptake (A and D), the external H+ concentration was determined with a pH electrode (B and E), and the external K+ concentration was measured with a K+ electrode (C and F). Data are representative of three experiments.
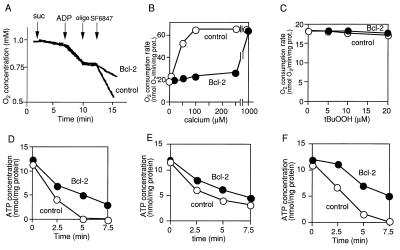
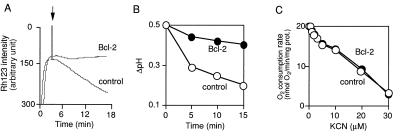
H+ is mainly pumped out from mitochondria by two different mechanisms, via electron transfer complexes or the reverse action of F0F1 ATPase (34). Therefore, we next examined which mechanism was involved in enhancement of H+ efflux by Bcl-2. To explore the possible involvement of electron transfer complexes, we measured the O2 consumption rate. As shown in Fig. 5A, addition of SF6847 enhanced the respiration of nontransgenic mitochondria, due to loss of the proton gradient by the direct action of the protonophore. In contrast, in transgenic-Bcl-2 mitochondria, SF6847-induced respiration was much slower than in nontransgenic mitochondria, suggesting that enhancement of H+ efflux by Bcl-2 did not occur via the electron transport system or at least not via complex IV where oxygen is consumed. Similar results were obtained in mitochondria treated with Ca2+ (Fig. 5B). In addition, Bcl-2 had little effect on the state IV respiration rate after treatment with tBuOOH (Fig. 5C). Similarly, reduction of Δψ and ΔpH was induced by the complex IV inhibitor KCN (Fig. 6 A and B) but was prevented by Bcl-2 without enhancing O2 consumption (Fig. 6C). These results suggested that electron transfer complexes were not directly involved in the enhancement of H+ efflux by Bcl-2, consistent with the observations that Bcl-2 has an anti-cell-death action in cells lacking mitochondrial DNA (35) and in cells under hypoxic conditions (36, 37), although the possibility was not excluded that part of the electron transfer complex was modified by Bcl-2. To examine the possible involvement of the reverse action of F0F1 ATPase, which consumes ATP to enhance H+ efflux in the presence of Bcl-2, mitochondrial ATP concentrations were measured. As shown in Fig. 5 D–F, the ATP concentration of transgenic-Bcl-2 mitochondria was higher than that of nontransgenic mitochondria after treatment with SF6847, Ca2+, and tBuOOH. Also, the addition of F1 ATPase inhibitors, oligomycin or aurovertin B, neither blocked the maintenance of Δψ nor the enhancement of H+ efflux by Bcl-2 (data not shown). These results suggested that enhancement of H+ efflux was not mediated through F0F1 ATPase.
Figure 5.
Bcl-2 maintains the O2 consumption rate and ATP concentration in the presence of SF6847, calcium, and tBuOOH. (A–C) Effect of Bcl-2 on the O2 consumption rate of mitochondria (1 mg of protein per ml). (A) Nontransgenic and transgenic-Bcl-2 mitochondria were treated with 5 mM succinate (suc), 10 μM ADP, 20 nM oligomycin (oligo), or 20 nM SF6847 at the times indicated by arrows, and the O2 consumption rate was continuously measured with an O2 electrode. (B and C) Nontransgenic (○) and transgenic-Bcl-2 (•) mitochondria (1 mg of protein per ml) were treated with Ca2+ (B) or tBuOOH (C) at the indicated concentrations and O2 consumption was measured under state IV conditions for 5 min with an O2 electrode. Data are representative of three experiments. (D–F) Effect of Bcl-2 on the ATP concentration in mitochondria (1 mg of protein per ml). Nontransgenic (○) and transgenic-Bcl-2 (•) mitochondria were treated with 40 nM SF6847, 50 μM Ca2+, or 10 μM tBuOOH, and the ATP concentration was measured at the indicated times. Data are representative of three experiments.
Figure 6.
Bcl-2 maintains Δψ and ΔpH in the presence of KCN without affecting O2 consumption. Mitochondria (1 mg of protein per ml) isolated from livers were treated with KCN at 10 μM (A and B) or at the indicated concentrations (C), Δψ was assessed by Rh123 uptake (A), ΔpH was determined with [3H]acetate (B), and the respiration rate was measured with an O2 electrode (C).
The H+ gradient is the most fundamental element in maintaining mitochondrial function. Mitochondrial homeostasis, including the distribution of ions, is mainly regulated by the H+ synport or antiport. Although the biochemical mechanisms underlying the regulation of Δψ by Bcl-2 through H+ efflux remain to be elucidated, one possibility is that Bcl-2 acts in concert with part of the electron transport system. In this context, it was shown in Caenorhabditis elegans that ced-9, a bcl-2 homologue, and cyt-1, which encodes a component of the respiratory chain, are cotranscribed from the same mRNA, suggesting that Ced-9 and Cyt-1 might function in the same system (38). Bcl-2 might be associated with as yet undefined proton pumps. Alternatively, Bcl-2 might itself induce H+ efflux. Structural and electrophysiological analysis has shown that Bcl-XL and Bcl-2 could form ionic channels in a synthetic lipid membrane (12, 13), consistent with the proposed three-dimensional structure of the protein (39). The activity of Bcl-2 as an ionic channel might underlie part of its effect on H+ transport.
In conclusion, our data indicate that Bcl-2 directly or indirectly enhances H+ efflux to maintain Δψ. Among the ions in our experimental system (H+, K+, phosphate, and hydroxy ions), H+ but not K+ contributed to the maintenance of Δψ by Bcl-2 in the presence of apoptotic stimuli. Although we cannot exclude the possibility that Bcl-2 regulates anions, it seems unlikely that it regulated the flux of phosphate ions to counteract proton efflux, considering the different behavior of H+ and K+.
Acknowledgments
We are grateful to Drs. K. Tagawa, H. Terada, and Y. Shinohara for helpful advice on this work and for providing SF6847 and bongkrekic acid; Dr. M. Klingenberg for also providing bongkrekic acid; Dr. T. Chittenden for providing the expression plasmid for GST–Bak fusion protein; and Ms. M. Hoffman for editorial assistance. This work was supported in part by grants for Scientific Research on Priority Area, and for Center of Excellence Research from the Ministry of Education, Science and Culture of Japan and by a grant from the Nissan Science Foundation.
ABBREVIATIONS
- Δψ
mitochondrial membrane potential
- PT
permeability transition
- TPP+
tetraphenylphosphonium chloride
- CCCP
carbonylcyanide m-chlorophenylhydrazone
- tBuOOH
tert-butyl hydroperoxide
- GST
glutathione S-transferase
- Rh123
rhodamine 123
- CsA
cyclosporin A
- BCECF
2′,7′-bis(carboxyethyl)-5(6)-carboxyfluorescein
References
- 1.Tsujimoto Y, Cossman J, Jaffe E, Croce C M. Science. 1985;228:1440–1443. doi: 10.1126/science.3874430. [DOI] [PubMed] [Google Scholar]
- 2.Bakhshi A, Jensen J P, Goldman P, Wright J J, McBride O W, Epstein A L, Korsmeyer S J. Cell. 1985;41:899–906. doi: 10.1016/s0092-8674(85)80070-2. [DOI] [PubMed] [Google Scholar]
- 3.Cleary M L, Sklar J. Proc Natl Acad Sci USA. 1985;82:7439–7443. doi: 10.1073/pnas.82.21.7439. [DOI] [PMC free article] [PubMed] [Google Scholar]
- 4.Vaux D L, Cory S, Adams J M. Nature (London) 1988;335:440–442. doi: 10.1038/335440a0. [DOI] [PubMed] [Google Scholar]
- 5.Tsujimoto Y. Oncogene. 1989;4:1331–1336. [PubMed] [Google Scholar]
- 6.Shimizu S, Eguchi Y, Kamiike W, Waguri S, Uchiyama Y, Matsuda H, Tsujimoto Y. Oncogene. 1996;12:2045–2050. [PubMed] [Google Scholar]
- 7.Monaghan P, Robertson D, Andrew T, Amos S, Dyer M J S, Mason D Y, Greaves M F. J Histochem Cytochem. 1992;40:1819–1825. doi: 10.1177/40.12.1453000. [DOI] [PubMed] [Google Scholar]
- 8.Gonzalez-Garcia M, Perez-Ballestero R, Ding L, Duan L, Boise L H, Thompson C B, Nunez G. Development. 1994;120:3033–3042. doi: 10.1242/dev.120.10.3033. [DOI] [PubMed] [Google Scholar]
- 9.Chinnaiyan A M, O’Rourke K, Lane B R, Dixit V M. Science. 1997;275:1122–1126. doi: 10.1126/science.275.5303.1122. [DOI] [PubMed] [Google Scholar]
- 10.Wu D, Wallen H D, Nunez G. Science. 1997;275:1126–1129. doi: 10.1126/science.275.5303.1126. [DOI] [PubMed] [Google Scholar]
- 11.Spector M S, Desnoyers S, Hoeppner D J, Hengartner M O. Nature (London) 1997;385:653–656. doi: 10.1038/385653a0. [DOI] [PubMed] [Google Scholar]
- 12.Minn A J, Velez P, Schendel S L, Liang H, Muchmore S W, Fesik S W, Fill M, Thompson C B. Nature (London) 1997;385:353–357. doi: 10.1038/385353a0. [DOI] [PubMed] [Google Scholar]
- 13.Schendel S L, Xie Z, Montal M O, Matsuyama S, Montal M, Reed J C. Proc Natl Acad Sci USA. 1997;94:5113–5118. doi: 10.1073/pnas.94.10.5113. [DOI] [PMC free article] [PubMed] [Google Scholar]
- 14.Yang J, Liu X, Bhalla K, Kim C N, Ibrado A M, Cai J, Peng T-I, Jones D P, Wang X. Science. 1997;275:1129–1132. doi: 10.1126/science.275.5303.1129. [DOI] [PubMed] [Google Scholar]
- 15.Kluck R M, Bossy-Wetzel E, Green D R, Newmeyer D D. Science. 1997;275:1132–1136. doi: 10.1126/science.275.5303.1132. [DOI] [PubMed] [Google Scholar]
- 16.Shimizu S, Eguchi Y, Kamiike W, Waguri S, Uchiyama Y, Matsuda H, Tsujimoto Y. Oncogene. 1996;13:21–29. [PubMed] [Google Scholar]
- 17.Zamzami N, Susin S A, Marchetti P, Hirsch T, Gomez-Monterrey I, Castedo M, Kroemer G. J Exp Med. 1996;183:1533–1544. doi: 10.1084/jem.183.4.1533. [DOI] [PMC free article] [PubMed] [Google Scholar]
- 18.Gunter T E, Pfeiffer D R. Am J Physiol. 1990;258:C755–C786. doi: 10.1152/ajpcell.1990.258.5.C755. [DOI] [PubMed] [Google Scholar]
- 19.Pfeiffer D R, Gudz T I, Novgorodov S A, Erdahl W L. J Biol Chem. 1995;270:4923–2932. doi: 10.1074/jbc.270.9.4923. [DOI] [PubMed] [Google Scholar]
- 20.Susin S A, Zamzami N, Castedo M, Hirsch T, Marchetti P, Macho A, Daugas E, Geuskens M, Kroemer G. J Exp Med. 1996;184:1–11. doi: 10.1084/jem.184.4.1331. [DOI] [PMC free article] [PubMed] [Google Scholar]
- 21.Susin S A, Zamzami N, Castedo M, Daugas E, Wang H-G, Geley S, Fassy F, Reed J C, Kroemer G. J Exp Med. 1997;186:25–37. doi: 10.1084/jem.186.1.25. [DOI] [PMC free article] [PubMed] [Google Scholar]
- 22.Shimizu S, Eguchi Y, Kamiike W, Matsuda H, Tsujimoto Y. Oncogene. 1996;12:2251–2257. [PubMed] [Google Scholar]
- 23.Kohga S, Kinjo M, Tanaka K, Ogawa H, Ishihara M, Tanaka N. Cancer Res. 1981;41:4710–4714. [PubMed] [Google Scholar]
- 24.Lacronique V, Mignon A, Fabre M, Viollet B, Rouquet N, Molina T, Porteu A, Herion A, Bouscary D, Varlet P, et al. Nat Med. 1996;2:80–86. doi: 10.1038/nm0196-80. [DOI] [PubMed] [Google Scholar]
- 25.Shimizu S, Kamiike W, Hatanaka N, Nishimura M, Miyata M, Inoue T, Yoshida Y, Tagawa K, Matsuda H. Transplantation. 1994;57:144–148. doi: 10.1097/00007890-199401000-00022. [DOI] [PubMed] [Google Scholar]
- 26.Nakai M, Takeda A, Cleary M L, Endo T. Biochem Biophys Res Commun. 1993;196:233–239. doi: 10.1006/bbrc.1993.2239. [DOI] [PubMed] [Google Scholar]
- 27.Dawson A, Klingenberg M, Krämer R. Mitochondria. A Practical Approach. Oxford: IRL; 1987. [Google Scholar]
- 28.Bernardi P, Vassanelli S, Veronese P, Colonna R, Szabo I, Zoratti M. J Biol Chem. 1992;267:2934–2939. [PubMed] [Google Scholar]
- 29.Negrini M, Silini E, Kozak C, Tsujimoto Y, Croce C M. Cell. 1987;49:455–463. doi: 10.1016/0092-8674(87)90448-x. [DOI] [PubMed] [Google Scholar]
- 30.Eguchi Y, Ewert D L, Tsujimoto Y. Nucleic Acids Res. 1992;20:4187–4192. doi: 10.1093/nar/20.16.4187. [DOI] [PMC free article] [PubMed] [Google Scholar]
- 31.Farrow S N, White J H M, Martinou I, Raven T, Pun K-T, Grinham C J, Martinou J-C, Brown R. Nature (London) 1995;374:731–733. doi: 10.1038/374731a0. [DOI] [PubMed] [Google Scholar]
- 32.Chittenden T, Harrington E A, O’Conner R, Flemington C, Lutz R J, Evan G I, Guild B C. Nature (London) 1995;374:733–736. doi: 10.1038/374733a0. [DOI] [PubMed] [Google Scholar]
- 33.Kiefer M C, Brauer M J, Powers V C, Wu J J, Umansky S R, Tomei L D, Barr P J. Nature (London) 1995;374:736–739. doi: 10.1038/374736a0. [DOI] [PubMed] [Google Scholar]
- 34.Walker J E. Curr Biol. 1994;4:912–918. doi: 10.1016/0959-440x(94)90274-7. [DOI] [PubMed] [Google Scholar]
- 35.Jacobson M D, Burne J F, King M P, Miyashita T, Reed J C, Raff M C. Nature (London) 1993;361:365–369. doi: 10.1038/361365a0. [DOI] [PubMed] [Google Scholar]
- 36.Shimizu S, Eguchi Y, Kosaka H, Kamiike W, Matsuda H, Tsujimoto Y. Nature (London) 1995;374:811–813. doi: 10.1038/374811a0. [DOI] [PubMed] [Google Scholar]
- 37.Jacobson M D, Raff M C. Nature (London) 1995;374:814–816. doi: 10.1038/374814a0. [DOI] [PubMed] [Google Scholar]
- 38.Hengartner M O, Horvitz H R. Cell. 1994;76:665–676. doi: 10.1016/0092-8674(94)90506-1. [DOI] [PubMed] [Google Scholar]
- 39.Muchmore S W, Sattler M, Liang H, Meadows R P, Harlan J E, Yoon H S, Nettesheim D, Chang B S, Thompson C B, Wong S-L, et al. Nature (London) 1996;381:335–341. doi: 10.1038/381335a0. [DOI] [PubMed] [Google Scholar]


