


Abstract
Microarray gene expression data becomes more valuable as our confidence in the results grows. Guaranteeing data quality becomes increasingly important as microarrays are being used to diagnose and treat patients (1–4). The MAQC Quality Control Consortium, the FDA's Critical Path Initiative, NCI's caBIG and others are implementing procedures that will broadly enhance data quality. As GEO continues to grow, its usefulness is constrained by the level of correlation across experiments and general applicability. Although RNA preparation and array platform play important roles in data accuracy, pre-processing is a user-selected factor that has an enormous effect. Normalization of expression data is necessary, but the methods have specific and pronounced effects on precision, accuracy and historical correlation. As a case study, we present a microarray calibration process using normalization as the adjustable parameter. We examine the impact of eight normalizations across both Agilent and Affymetrix expression platforms on three expression readouts: (1) sensitivity and power, (2) functional/biological interpretation and (3) feature selection and classification error. The reader is encouraged to measure their own discordant data, whether cross-laboratory, cross-platform or across any other variance source, and to use their results to tune the adjustable parameters of their laboratory to ensure increased correlation.
BACKGROUND
Expression arrays have progressed to a point where low technical variance, low background noise and a high degree of accuracy have encouraged the development of array-based medical devices that predict drug response, relapse potential or general prognosis (2–4). Normalization is a critical pre-processing step for most array technologies, due to the known biases. As normalization methods get more sophisticated and perhaps more specialized, the list of pros and cons for each grows. The array user should be aware of the bottom-line consequences of the normalization methods available today.
Affymetrix (Affymetrix Inc, Santa Clara, CA, USA) and Agilent (Agilent Technologies, Santa Clara, CA, USA) are leaders in expression array manufacturing. They use quite different approaches to the construction, layout, optimization, hybridization, image acquisition and data extraction methods. Much of the difference that we see is attributable to the difference between in situ probe synthesis—photolithography (light-directed) versus liquid-based (ink-jet) oligonucleotide synthesis. Reports have found both poor (5–10) and good (6,11–22) cross-platform correlation, but the MAQC consortium have generally found that proper sample preparation is sufficient to dramatically enhance multi-lab and multi-platform correlations (16,23,24). Quality control rules (25–27) tell us that one could fix a high-quality RNA source and identify all other variables that could cause discordant data. With that logic, we propose a system that fixes the RNA source and changes data normalization methods in order to estimate their effect on data precision, classifier error and biological interpretation. The system we developed is a simple analysis that both graphically and quantitatively shows how adjustable parameters (in this case normalization) affect discordance. Although many publications have proposed somewhat esoteric methods for measuring cross-platform reproducibility, we believe that a simple, easy-to-understand analysis will not only highlight most sources of variance, but will also enable the user to visualize how process-control techniques improve reproducibility.
Normalization methods and cross-platform comparisons
How two arrays from different manufacturers correlate with each other depends in large part on how they respond to factors that cause ectopic hybridization. Agilent arrays have mostly full-length 60-mer probes versus mostly <25-mers on Affymetrix arrays, the difference primarily being due to the stepwise yield between shadow-masking and liquid in situ synthesis. Long oligo probes tend to disallow mishybridization due to increased hybridization and wash stringency; 25-mers and shorter are less well adapted to discriminate short mishybridization products, often showing up in partially degraded samples. Normalization cannot fix data obtained from degraded samples, but the analyses we propose enable one to spot patterns that implicate degraded RNA, and to pick a normalization method that may mitigate the most egregious effects.
For Affymetrix arrays, dChip PM and dChip PM–MM (28) are very popular model-based approaches (MBEI) that rely on weighted average of PM–MM differences, or an adjusted PM value (Perfect Match/MisMatch). dChip can either include or exclude mismatch data and then normalize using an invariant set method or quantile:quantile; both accommodate deviations in intensity-dependent variance quite well. GC-RMA and RMA (Robust Multi-Array Averaging) (29–32) apply a type of variance stabilization that sums probes from all experiments in an analysis set and computes an average. GC-RMA weights the stronger G:::C bonds over A::T, yielding moderately higher precision in cases where the thermodynamics of the probe:target complex play a major role in hybridization. MAS5 (Microarray Suite 5) is a fairly conservative method that represents the manufacturer's suggested correction for mishybridization that occurs on the order of single mismatch destabilization energy, ΔG = −3.2 kCal. Signals from a mismatch probe are subtracted from a perfect match probe and total signal is calculated using a one step Tukey's biweight estimate after the highest and lowest probe values are discarded. RAW Affymetrix data, summarized by taking the median of all PM probes, make an excellent control for our comparisons since the biases that make normalization so important become abundantly clear. Many of these algorithms are included in the Affycomp library in Bioconductor (33).
Agilent arrays were originally optimized for two-color analysis but a one-color protocol is now available that includes a different panel of spike-in reagents for better optimization of single-color mode (34). Although this method would have been appropriate for a truly cross-platform comparison, we instead wanted to estimate error separately for each of the two Agilent channels, so we extracted each channel separately from a two-color experiment. Mean signal (MEAN) is most similar to RAW Affymetrix data, background subtracted (BSUB) is most similar to MAS5 and dChip PM–MM and processed (PROCESSED) is most similar to GC-RMA and dChip PM. These three normalization steps are all found in Agilent's feature extraction output file.
Practical aspects of expression profiling
We define an expression profiling system as the array, scanner, RNA preparation techniques and the general laboratory infrastructure. Thus, when we use the term ‘biosignature’, we are really referring to the entire system that was involved in the generation of the data. Agendia's 70-gene Agilent-based MammaPrint® (2–4), aka the ‘Amsterdam Signature’, Veridex's 76-gene signature, aka the ‘Rotterdam Signature’, Genomic Health's 21-gene RT-PCR-based Oncotype DX™ (1,35) and a 41-gene expression set by Ahr et al. (36,37) have no gene in common, although all classify breast cancer profiles. Given zero-error measurements, a perfect signature could be found, but in reality gene-specific imprecision exists depending on the platform. In the clinic, misclassification can be potentially life threatening when false negatives predominate, and costly and uncomfortable for the patient when false positives predominate. With proper calibration and selection of platform-neutral gene expression profiles, one can expect good classification performance on a given expression platform, if one can validate biosignatures on public expression data (38–40). Shyamsundar et al. (41) addressed the calibration problem by correlating fluorescence intensity to copy number using genomic DNA (present at two copies per gene) as a baseline. Although mid- and high-concentration endpoints would have been valuable, it remains a promising calibration method.
One of the most relevant tests of expression data quality is how well one can identify genes that participate in gene regulatory and metabolic networks that change between healthy and diseased samples. Cancer is often cited as the archetype of a process that redirects transcriptional signals, originally designed to maintain homeostasis, into new developmental pathways specializing in proliferation and survival (15). Classification of biological samples into distinct subtypes based only on the transcriptome is often able to predict disease progression, drug response and even survival (3,42–44). Gene Ontology analysis has been shown to correlate well with changes in cellular physiology due to disease (45). Similarly, whole regulatory pathway analysis is informative when filtered for false positives. Pathway software includes Stratagene's Pathway Architect, Ingenuity's IPA, GeneGo's Metacore and open source Cytoscape, GenMapp, Kegg and Biocarta.
Three analytical methods
We propose three tests that generally provide expression data performance values; in our case we used these tests to decide which normalization method is most appropriate for the task at hand. We created an experimental design that compares three functionally different normal tissues: human liver, lung and spleen. The design was kept intentionally simple in order to facilitate this example, but note that the selection of functionally divergent tissues places a burden on normalization methods that assume minor changes in expression across samples. However we believe this design is superior for the current task than more complex designs (11–17,46–52). The analysis is simple enough to do without specialized software, and high quality RNA samples are readily obtained (Stratagene, La Jolla, CA). The tissue samples are normal healthy human samples rather than diseased tissues (15,53–55), and provide a large range of differential expression values. These results should be comparable to the same analysis performed in any lab, which is our definition of standardized methodology. We describe each analysis in terms of the genei, tissuej and casek. The gene is the individual probe or averaged probeset targeting a single gene transcript. The tissue is one of three human commercial samples, in this case spleen, lung or liver. The case is one of three possible ratios, spleen:lung, lung:liver and spleen:liver. At least three replicates per tissue per platform were run, with three normalization methods for Agilent and five for Affymetrix. Twenty-four distinct data sets (Table 1) were analyzed.
Table 1.
Sample size, normalization methods, platform and tissues used
| Platform | Normalization methods | Probes (genei) | overlap | Tissues (samplej) | Nj |
|---|---|---|---|---|---|
| Agilent Human 1Av2 | BSUB (gBGSubSignal col62 and rBGSubSignal col63 Feature Extraction 8.1) | 18703 | 11504 | Liver, lung, spleen | 6 |
| Agilent Human 1Av2 | MEAN (gMeanSignal col33 and rProcessed col34 Feature Extraction 8.1) | 18703 | 11504 | Liver, lung, spleen | 6 |
| Agilent Human 1Av2 | PROC (gProcessed col23, 80 and rProcessed col 24, 81 Feature Extraction 8.1) | 18703 | 11504 | Liver, lung, spleen | 6 |
| Affymetrix U133Av2 | MAS5 (GCOS 1.2) | 22215 | 11504 | Liver, lung, spleen | 6 |
| Affymetrix U133Av2 | GC-RMA (GeneSpring 7.2) | 22215 | 11504 | Liver, lung, spleen | 6 |
| Affymetrix U133Av2 | RAW (Bioconductor Affy package, mean PM) | 22215 | 11504 | Liver, lung, spleen | 6 |
| Affymetrix U133Av2 | PM (dChip 2006 Perfect Match only model) | 22215 | 11504 | Liver, lung, spleen | 6 |
| Affymetrix U133Av2 | PM–MM(dChip 2006 Perfect Match – Mismatch difference model) | 22215 | 11504 | Liver, lung, spleen | 6 |
Agilent's MEAN value is the signal intensity per channel + local and global background. BSUB is MEAN — local background. Local background is calculated using negative controls, mean local background and a spatial detrending calculation based on scanner-induced low frequency multiplicative noise. PROC is background subtracted, spatially detrended, lowess normalized and error modeled data. The error model separates the lower additive components error for low intensity, the multiplicative components for high intensity, and adds the squared results of all error terms plus the error from the simple background subtracted signal. Affy MAS5 is the mismatch-subtracted data from GCOS. GC-RMA is the GC-modified robust multi-array variance stabilizing method. dChip PM and PM–MM methods are iterative, model-based methods that automatically exclude high error datapoints.
RESULTS
Power analysis and distributional tests (statistical)
Data was structured as follows: data sets were log10 (intensity) and log2 (ratio) transformed as needed. Figure 1 summarizes the reproducibility and dispersion for each platform and tissue combination across most of the twenty-four conditions. Agilent CY3 was left out for brevity, but plots were very similar to the CY5 data. The first three columns are the intensity replicates (e.g. liver sample 1 versus liver sample 2) and graphically illustrate technical variability as a function of fluorescence intensity. Background-subtracted methods in general tended to show the highest apparent dispersion (MAS5 and dChip PM–MM) while GC-RMA, dChip PM and most of the Agilent data showed much less scatter. The third, fourth and fifth columns show the MvA (Bland–Altman) plots, indicating the degree of correlation between variance and intensity. Only the Affymetrix MAS5 and GC-RMA data have substantial scatter, indicating a disjunction between intensity and variance. The ratio replicate plots in columns seven, eight and nine indicate how precisely each pair of tissue samples can be used in ratios for each of the three pairwise cases. MAS5 and dChip PM–MM show comparatively high scatter, indicating higher variability across replicate ratio calculations, especially at ratios near one. The dChip PM and RAW plots, and to a lesser extent MAS5, highlight the problem of using either under-normalized or imperfectly estimated mismatch data as a reliable estimate of background. The Agilent data shows a slight trend to higher dispersion with the BSUB and PROCESSED signals showing the impact of subtracting background. The boxplots shown in Figure 2 (top) indicate the relative data spread, another graphical estimate of precision. Agilent MEAN and Affymetrix GC-RMA and RAW show the lowest quartile ranges, suggesting high precision. The bottom plots show the relative compression of un-normalized signals, explaining the illusion of precision due to the low dynamic range of near-RAW data. Figure 3 shows the effect of normalization on hierarchical clustering (Euclidean distance, average linkage, 1000 ANOVA-selected genes, GeneSpring 7.2, Agilent Technologies, Palo Alto, CA). Affymetrix data tends to form clusters based on the (relatively greater) effect of normalization while Agilent data tends to cluster by tissue regardless of the channel or normalization. The Venn diagram shows the overlap of genes for each cluster experiment; there were 699 common genes out of 1000 based on RefSeq. Precision estimates such as these are always imperfect in some way, but when taken together they provide a good estimate of relative precision. Sensitivity was calculated in several ways. We first estimated the power using normal.sample.size() in S+ or power.t.test() in R. We computed Δ (the minimum detectable fold change) at an arbitrary threshold of one potential false positive per array, or α = 1/Nprobes. The p-value threshold used throughout this article often use 1/Nprobes, or p = 5.3 × 10⁻⁵ for Agilent and p = 4.5 × 10⁻⁵ for Affymetrix. Calculations of delta used N = 3 replicates, β = 0.80 for every pairwise gene expression value across each unique tissuej casek, per platform and per normalization. Figure 4 shows the sorted Δ (black curve) calculated for each probei casek with the actual ratios between the two tissues plotted as blue bars. If abs(log2 geneii/geneij) > Δ, then genei is significant by definition, as indicated by the red circles. Some circles lie below the curve Δ because the significance was calculated by a t-test using log10 intensities rather than the log2 ratios in the power calculation. This is formalized below in Equation (1.1):
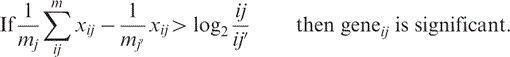 |
(1.1) |
Table 2 shows the results from three methods for calculating sensitivity. Column 1 shows the mean delta +/− the standard deviation computed by calculating power from every possible pairwise casek, column 2 shows the average minimum-detectable fold-change (MDFC) across replicate measures at the 95th percentile. Equation (1.2) is the method for averaging delta for each casek. Column 3 shows the median MDFC across replicate measures at the 95th percentile. Equation (1.3) clarifies the calculation for delta across the ith gene and the kth sample where m = 22 215 for Affymetrix and 18703 for Agilent.
| (1.2) |
 |
(1.3) |
Mean and median fold-change values across ratio replicates were averaged across all casek for all ratio calculations used in sensitivity calculations. Sensitivity estimates correlate well with the replicate scatterplots in Figure 1. Agilent methods BSUB and PROCESSED have the highest sensitivity followed by Agilent MEAN, Affymetrix GC-RMA and dChip PM, with the worst precision and sensitivity seen with MAS5 and dChip PM–MM normalizations. The fact that dChip PM produced better sensitivity results than dChip PM–MM is likely due to the scatter that the mismatch subtraction causes, similar to the problem that MAS5 has. Algorithms that use background subtraction methods cause low-intensity imprecision when MM > PM. This effect is manifested in MAS5 and dChip PM–MM data by a minimum detectable fold change near 2-fold, while GC-RMA and Agilent data show 1.3-fold or less MDFC.
Figure 1.

Graphical view of precision. Intensity replicates (left three columns) are log10 scatter plots of technical replicates for each normalization and tissue. Low scatter indicate higher precision. MvA plots (center three columns) are Bland–Altman charts showing variability (M = log2 (S1/S2)) as a function of the average intensity (A = log2 sqrt(S1/S2)) where S1 and S2 are the two replicate samples for each normalization and tissue. Linearity and low spread indicate high precision without intensity-sourced bias. Ratio replicates (right three columns) are log2 plots of tissue:tissue ratio replicates for each combination of tissue.
Figure 2.

Intensity plots using boxplots (top) and line-plots (bottom). Top: boxplots of each array are colored by normalization type. Top boxplots show Agilent data arranged from left to right from the CY3 and CY5 channels, respectively. Lower boxplots show Affymetrix data. Lower figures show the log10-transformed intensity values as line-plots. High intensity genes are colored red, low intensity genes are colored green. All data is log10-transformed and median normalized.
Figure 3.

Hierarchical grouping of 1000 genes selected using a Model I ANOVA for tissue differences ignoring the normalization class. Data was clustered using Euclidean distance to create the gene and experiment trees. Colored bars at the bottom of each dendrogram indicate the normalization method, tissue type or channel where appropriate. Vertical colored bars represent the Euclidean-based k-means gene clusters. Gene overlap was determined sequentially, using probename to RefSeq to HUGO Gene Symbol inside GeneSpring (translate genome function).
Figure 4.

Power calculations indicate limits of detection. The log2 ratio between the three tissues is plotted as blue bars along the X-axis. The X-axis is the probe number sorted by the calculated delta, the Y-axis is the log2 fold-change. Red circles indicate statistical significance at P < 0.00001. The black curve is each probe's delta (the minimum detectable difference expressed as a log2 ratio) calculated by computing the post-hoc power for each probe at α = 0.05, β = 0.20 and N = 3 per tissue. The lower the delta, the less difference must be seen between tissues for a ratio to be significant. Wider delta curves imply that a ratio must be large in order to reach significance. The delta curves roughly recapitulate the precision seen in Figure 1, but also provide a graphical view of the distribution and magnitude of ratios versus proportion of significant genes. GC-RMA tends to show ratios close to the calculated delta; MAS5 shows many high ratios but fewer actual significant genes, implying false positives are a concern. PM only shows good stability across the tissue replicates. The Agilent data shows a uniform distribution of high and low ratios and many significant genes, implying low false positives and due to the number of significant genes, likely low false negatives. Raw Affymetrix data has seemingly high precision but analysis shows high false negatives and ratios that often disagree in magnitude and direction with other highly correlative probes across both Affymetrix and Agilent data.
Table 2.
Sensitivity results
| Data set | Average Δik | Average MDFC (95th percentile ratio) | Median MDFC (95th percentile ratio) | Nj |
|---|---|---|---|---|
| Agilent BSUB | 1.13 ± 0.03 | 1.37 ± 0.08 | 1.34 | 3 |
| Agilent MEAN | 1.14 ± 0.08 | 1.30 ± 0.07 | 1.15 | 3 |
| Agilent PROCESSED | 1.28 ± 0.07 | 1.61 ± 0.13 | 1.37 | 3 |
| Affymetrix MAS5 | 1.99 ± 0.69 | 2.38 ± 0.52 | 2.16 | 3 |
| Affymetrix GC-RMA | 1.32 ± 0.21 | 1.31 ± 0.26 | 1.43 | 3 |
| Affymetrix RAW | 1.56 ± 0.21 | 1.58 ± 0.14 | 1.19 | 3 |
| Affymetrix PM | 1.85 ± 0.19 | 2.3 ± 0.14 | 2.16 | 3 |
| Affymetrix PM–MM | 1.65 ± 0.11 | 2.01 ± 0.25 | 1.99 | 3 |
Delta is the minimum detectable difference at α = 0.05, β = 0.20, N = 3, in fold-change units. Delta was averaged per probe, per case and per tissue with the standard deviation shown. The minimum detectable fold-change is the ratio of two technical replicates at the 95th percentile probe. The average was taken across all probes, all tissues and all possible technical replicates. The median MDFC was the middle value across all possible casesk.
Biological interpretation (Gene Ontology)
We tested Gene Ontology functions by computing lists of genes differentially expressed across each pair of tissues (Table 3). Each gene list was tested for unusual abundance using GO categories, as calculated in GeneSpring 7.2 with corroborative results obtained from OntoExpress (56). Nearly identical results were obtained across the Agilent normalizations (columns 3, 5 and 7), less so among the Affymetrix normalizations, with dChip PM identifying functions that are quite unique. MAS5 and GC-RMA showed the greatest similarity to the Agilent results, suggesting that differentially expressed genes identified using GC-RMA and the Agilent samples led to a common biological interpretation. Subsequently, we wanted to see the extent of overlap given a common set of genes across the two platforms. We converted probe name to RefSeq, then to Hugo Gene Symbol, then to HUGO gene name and selected the intersection between the two platforms. We also used GeneSpring's Translate Genome function, and obtained a similar overlap. Using this common genome of probes, we selected the 1000 most significant genes from a Model I ANOVA (Figure 5). The highest overlap across the two platforms exists between Affymetrix dChip PM–MM and Agilent PROCESSED (243 genes out of 1000, Figure 5G) which, given the precision results, was a little surprising. Overall the overlap among MAS5, PM–MM and RAW (127 genes, Figure 5K) is higher than across dChip PM and GC-RMA (39 genes, Figure 5I). The Agilent normalizations were very similar to each other, with MEAN having the highest unique set of genes (288, Figure 5B) among the three normalizations. An interesting finding is the relatively high overlap between the Affymetrix background subtraction methods (dChip PM–MM and MAS5) versus the Agilent data (Figure 5C). In contrast, the more precise measures of dChip PM and GC-RMA versus the Agilent data (Figure 5I) showed very little overlap, again suggesting that the most aggressive and platform-specific normalizations improved precision at the cost of accuracy. The highest overlap between GO functions was found between MAS5 or dChip PM–MM and Agilent PROCESSED, again suggesting that high Type I error may not affect a GO analysis as dramatically as Type II errors. Using more detailed GO nodes did not clarify the differences between our normalizations, nor did it change the rank of best–to–worst. We feel this functional analysis is suitable as a 10 000 foot view of biological consistency. However, we wished to examine another biological analysis, and GenMapp, Biocarta, Kegg and Cytoscape all yield sufficient discrimination to quantify biological differences based on gene lists. We performed pathway analysis of 100 significant genes from each list (Table 4) using http://. Interestingly, once again we see that MAS5 and to a lesser extent dChip PM–MM match the Agilent data well, with Affymetrix RAW consistently identifying pathways outside consensus. By comparing the pathways from Table 4, we find that the pathways tend to validate the GO analysis from a different biological and mathematical perspective.
Table 3.
Gene Ontology analysis of genes selected by t-test at p < 5.3 × 10⁻⁵ for Agilent and p < 4.5 × 10⁻⁵ for Affymetrix
| Data set | t-test | Liver:Spleen (case1) | t-test | Liver:Lung (case2) | t-test | Spleen:Lung (case3) |
|---|---|---|---|---|---|---|
| Agilent BSUB | 4975 (27%) | catalytic activity: 5.36 × 10⁻¹³ | 6867 (37%) | catalytic activity: 8.87 × 10⁻¹⁰ | 3356 (18%) | immunity protein: 3.9 × 10⁻¹⁵ |
| e− transport: 1.95 × 10⁻¹² | O2 binding: 1.21 × 10⁻⁹ | lipid binding: 5.67 × 10⁻⁵ | ||||
| immunity protein: 1.23 × 10⁻¹¹ | e− transport: 6.29 × 10⁻⁹ | signal transducer: 1.53 × 10⁻⁴ | ||||
| Agilent MEAN | 3682 (20%) | catalytic activity: 2.86 × 10⁻¹⁰ | 4681 (25%) | e− transport: 2.49 × 10⁻¹¹ | 2443 (13%) | immunity protein: 2.4 × 10⁻¹⁰ |
| e− transport: 2.65 × 10⁻⁸ | catalytic activity: 2.81 × 10⁻¹¹ | lipid binding: 3.25 × 10⁻⁷ | ||||
| immunity protein: 2.05 × 10⁻⁷ | structural activity: 8.86 × 10⁻¹¹ | cell adhesion: 8.56 × 10⁻⁶ | ||||
| Agilent PROCESSED | 4979 (26%) | immunity protein: 2.08 × 10⁻¹² | 6809 (36%) | catalytic activity: 8.68 × 10⁻¹¹ | 3440 (18%) | immunity protein: 2.1 × 10⁻¹³ |
| catalytic activity: 8.89 × 10⁻¹⁰ | O2 binding: 1.37 × 10⁻⁹ | lipid binding: 4.74 × 10⁻⁴ | ||||
| e− transport: 3.22 × 10⁻⁹ | e− transport: 2.63 × 10⁻⁸ | signal transducer: 9.58 × 10⁻⁴ | ||||
| Affymetrix MAS5 | 2644 (12%) | immunity protein: 4.7 × 10−38 | 1065 (5%) | transferase: 2.21 × 10⁻²⁸ | 450 (2%) | cell adhesion: 1.81 × 10⁻¹⁷ |
| transferasae: 3.26 × 10⁻³⁵ | e− transport: 4.26 × 10⁻²⁶ | immunity protein: 5.0 × 10⁻¹⁵ | ||||
| e− transport: 4.93 × 10⁻²³ | transporter: 1.02 × 10⁻²⁴ | receptor binding: 1.63 × 10⁻⁸ | ||||
| Affymetrix GC−RMA | 2192 (10%) | immunity protein: 3.87 × 10⁻²⁵ | 11916 (54%) | ion channel: 3.63 × 10⁻⁸ | 12793 (58%) | structural molecule: 2.2 × 10⁻⁶ |
| transferase: 2.31 × 10⁻²¹ | transporter: 5.72 × 10⁻⁸ | ion channel: 7.96 × 10⁻⁴ | ||||
| e− transport: 8.65 × 10⁻¹⁴ | e− transport: 1.13 × 10⁻⁷ | e− transport: 1.76 × 10⁻³ | ||||
| Affymetrix RAW | 1371 (6%) | immunity protein: 6.35 × 10⁻³¹ | 2215 (10%) | O2 binding: 1.19 × 10⁻¹⁴ | 2838 (13%) | immunity protein: 2.6 × 10⁻³ |
| O2 binding: 1.56 × 10⁻²⁴ | lipid binding: 2.63 × 10⁻⁹ | structural activity: 3.94 × 10⁻³ | ||||
| transferase: 4.47 × 10⁻¹⁸ | ion transport: 9.8 × 10⁻⁸ | cell adhesion: 9.55 × 10⁻³ | ||||
| Affymetrix PM–MM | 2448 (11%) | immunity protein: 5.87 × 10−50 | 1300 (6%) | lipid binding: 2.12 × 10⁻²¹ | 933 (4%) | immunity protein: 3.3 × 10⁻⁴ |
| O2 binding: 5.87 × 10⁻²⁰ | e− transport: 3.85 × 10⁻²⁰ | structural molecule: 3.9 × 10⁻⁴ | ||||
| MHC antigen: 4.39 × 10⁻¹⁹ | O2 binding: 8.5 × 10⁻¹⁸ | cell adhesion: 1.54 × 10⁻³ | ||||
| Affymetrix PM | 1730 (8%) | DNA binding: 3.99 × 10⁻⁹ | 479 (2%) | immunoglobulin: 3.05 × 10⁻¹⁵ | 1870 (8%) | nucleic acid binding: 3 × 10⁻¹⁵ |
| transcription factor: 8.84 × 10⁻⁶ | immunity protein: 2.87 × 10⁻¹² | structural activity: 9.78 × 10⁻¹³ | ||||
| transcription: 7.69 × 10⁻⁴ | NF-κB cascade: 2.34 × 10⁻⁶ | cell adhesion: 1.4 × 10⁻¹¹ |
The number of significant genes is listed in the t-test column, the top three biological categories from GO are identified along with the probability calculated by hypergeometric test for overabundance. Agilent data only used the CY5 channel, but the CY3 data is almost identical (data not shown). Bold terms are common across each casek.
Figure 5.

Overlap between Agilent and Affymetrix data. Using a Model I ANOVA we identified 1000 genes that are most differentially expressed across the three tissues tested. This analysis identifies the influence of normalization on the amount of overlap. (A) shows the most unmodified data (MEAN and RAW) versus a strong background subtraction method (MAS5). (B) is a comparison among the Agilent normalization methods. (C) and (D) compare highly processed Affymetrix data with Agilent methods. (E) and (F) compare four Affymetrix normalization methods to RAW data. (G) and (L) show the highest Affymetrix/Agilent overlaps occur between PROCESSED or BSUB and PM-MM normalizations. (H), (I), (J) and (K) illustrate the various overlaps between and among Agilent and Affymetrix normalizations.
Table 4.
GeneMapp, Biocarta and Kegg metabolic pathways
| Data set | Database | Liver:Spleen (case1) | Liver:Lung (case2) | Spleen:Lung (case3) |
|---|---|---|---|---|
| Agilent BSUB | BioCarta | Intrinsic prothrombin activation | Intrinsic prothrombin activation | NFAT and hypertrophy |
| GenMapp | Blood clotting cascade | Blood clotting cascade | Inflammatory response | |
| KeGG | Complement and coagulation | Complement and coagulation | Cytokine–cytokine receptor | |
| Agilent MEAN | BioCarta | Complement pathway | Intrinsic prothrombin activation | Nuclear receptors in lipid metabolism and toxicity |
| GenMapp | Ribosomal proteins | Blood clotting cascade | GPCRDB Rhodopsin-like | |
| KeGG | Complement and coagulation | Complement and coagulation | Cell communication | |
| Agilent PROCESSED | BioCarta | Fibrinolysis | Complement pathway | NFAT and hypertrophy |
| GenMapp | Blood clotting | Complement activation classical | Inflammatory response | |
| KeGG | Complement and coagulation cascade | Complement and coagulation cascade | Cytokine–cytokine receptor | |
| Affymetrix MAS5 | BioCarta | Intrinsic prothrombin pathway | Intrinsic prothrombin pathway | Oxidative stress-induced gene expression |
| GenMapp | Ironotecan pathway | Ironotecan pathway | Inflammation response | |
| KeGG | Complement and coagulation cascade | Complement and coagulation cascade | Cell communication | |
| Affymetrix GC-RMA | BioCarta | Intrinsic prothrombin activation | T Helper cell surface molecules | Role of Src kinases in GPCR signaling |
| GenMapp | Irinbotecan pathway | GPCRDB Rhodopsin-like | GPCRDB Class A Rhodopsin-like | |
| KeGG | Complement and coagulation cascade | Neuroactive ligand receptor interaction | Cytokine–cytokine receptor interaction | |
| Affymetrix RAW | BioCarta | TSP1 Induced apoptosis | Toll-like receptor pathway | Regulation of splicing |
| GenMapp | Smooth muscle contraction | Apoptosis | Smooth muscle contraction | |
| KeGG | MAPK signaling | MAPK signaling | MAPK signaling | |
| Affymetrix PM–MM | BioCarta | Intrinsic prothrombin activation pathway | Intrinsic prothrombin activation pathway | B lymphocyte surface molecules |
| GenMapp | Blood clotting cascade | Blood clotting cascade | GPCRDB Class A | |
| KeGG | Complement and coagulation cascade | Complement and coagulation cascade | Rhodopsin-like Cell communication | |
| Affymetrix PM | BioCarta | METS effect on macrophage differentiation | Fc epsilon receptor I signaling in Mast cells | T-cell receptor signaling pathway |
| GenMapp | Apoptosis | GPCRDB Class A Rhodopsin-like | GPCRDB Class A Rhodopsin-like | |
| KeGG | Cell cycle | Leukocyte transendothelial migration | Insulin signaling pathway |
Each case was used to select 100 significant genes which were tested for the most obvious gene regulatory pathway.
Feature selection and classification (Error based)
We demonstrate how feature selection and classification can be compromised by comparing classifier error rates across platforms and normalizations (57). We used a two-feature sequential forward floating search (58,59) with bolstering error estimation to score the feature sets, and linear discriminant analysis (LDA) as the classification rule (60). Overall error was estimated using cross validation with 500 replicates to reduce internal variability. Initially, we applied the selection routine to whole data sets containing the full complement of genes, obtaining in all cases zero misclassification error. In order to introduce some variability, we iteratively removed 500 of the most significant (by t-test) probes until less than 500 probes remained for both platforms; removal was done within the cross-validation step to reduce error. In Figure 6, we show the error rates per normalization and per case for lung:spleen, liver:spleen and liver:lung, and in Table 4 we compute the area under each curve as a relative rank of error. The Y-axis is the classifier error; the X-axis is the percentage of probes removed per iteration. In all cases the trends are generally consistent; Agilent data (dashed lines) are generally below the dChip PM–MM and RAW Affymetrix normalization methods, and are similar to GC-RMA. It is likely that a rapid increase in error indicates that the best predictive genes were removed fairly quickly, implying that good predictive features are not necessarily those with high statistical significance. Another characteristic of this group is the instability in error after ∼40% of the most significant probes were removed. The error rate for MAS5 shows a linear increase in error suggesting that this gene list contains features that contribute evenly to classification, whereas other groups rise and fall quite suddenly. This variability in error is likely not due to cross-validation since we performed 500 replicates, sufficient to converge to a stable error estimate. This instability likely results from the disconnect between a classifier error and the distributional tests we used in the removal step. A random removal method with more replication might have yielded a better estimate of error, but the computation time would be excessive. The areas under the curve (Table 5, columns 2, 4, 6) show Agilent MEAN data to be marginally better than PROCESSED and BSUB, but the confidence intervals overlap indicating that these three normalizations are equivalent. MAS5 and RAW tended to show the highest Affymetrix error while GC-RMA showed the lowest, again reflecting improvements caused by technical precision, but also on bias, since the RAW data was much more precise than the MAS5 data. The percent of total genes that are significant at p < 5.3 × 10⁻⁵ for Agilent and p < 4.5 × 10⁻⁵ for Affymetrix reflects the pool of genes tested in the classifier. The Affymetrix RAW data which is known to be biased also contains many significant genes, showing that our classifier is not compromised by inaccurate and biased signals. The RAW classification resulted in high error, seen in Figure 6. GC-RMA had lower misclassification than any group or platform, but we were less convinced that this was the best normalization scheme for these tissues since the GO and pathway GC-RMA results differed from consensus. We wanted to determine the probe position for the best and worst correlated probes for the best normalizations for classifier error: GC-RMA and PROCESSED (12,18). We sorted the probes for the best and worst correlation across Agilent's CY5 PROCESSED data and Affymetrix's GC-RMA data for liver and spleen. We determined the probe location by identifying the probe sequence (or exemplar) on Human Build 36 using BLAT. In nearly all of the best and worst correlated cases, discrepancy occurred when the probes were physically separated (Figure 7), but the degree to which this was the case varied. Within an Affymetrix probeset, physical distance often resulted in poor intra-probe correlation as well.
Figure 6.

Classifier error rates for tissue comparisons for Agilent and Affymetrix platforms and the associated normalizations. For each iteration, 500 of the most significantly differentially expressed genes were removed until less than 500 genes remained. A two-feature forward floating search with bolstering error estimation scored the features, linear discriminant analysis was the classifier rule. Overall error was estimated using cross validation with 500 replicates. (A) shows the lung versus spleen error rates. (B) shows the liver versus spleen and (C) the liver versus lung error. Dashed lines in all cases correspond to the Agilent normalization methods, solid lines correspond to the Affymetrix normalizations. Area under the curve was used to establish the rank order.
Table 5.
Area under the error curves (Figure 6) and the corresponding proportion of significant genes at p < 5.3 × 10⁻⁵ for Agilent and p < 4.5 × 10⁻⁵ for Affymetrix (called% <Pcrit), N = 3 samples
| Data set | Area liver:spleen | % > Pcrit liver:spleen | Area liver:lung | % > Pcrit liver:lung | Area spleen:lung | % >Pcrit spleen:lung |
|---|---|---|---|---|---|---|
| Agilent BSUB | 0.06 | 72% | 0.05 | 62% | 0.17 | 78% |
| Agilent MEAN | 0.04 | 80% | 0.02 | 75% | 0.16 | 87% |
| Agilent PROCESSED | 0.06 | 73% | 0.05 | 63% | 0.19 | 81% |
| Affymetrix MAS5 | 0.35 | 90% | 0.24 | 46% | 0.19 | 42% |
| Affymetrix GC-RMA | 0.21 | 88% | 0.03 | 95% | 0.02 | 98% |
| Affymetrix RAW | 0.37 | 94% | 0.23 | 90% | 0.15 | 87% |
| Affymetrix PM–MM | 0.25 | 88% | 0.29 | 67% | 0.10 | 78% |
| Affymetrix PM | 0.22 | 90% | 0.17 | 87% | 0.24 | 82% |
Figure 7.

Probe distance comparisons. Probe location for the 11 Affymetrix 25-mers and the single Agilent 60-mer are plotted along the target gene on the X-axis. Color in this case indicates the average log2 ratio between liver and spleen for two single normalizations, GC-RMA (Affymetrix) and PROCESSED CY5 (Agilent). Other normalizations and tissues produced similar results. Red indicates high relative signal in liver, green indicates high relative signal in spleen. Length of the probe is proportional to the amount of gene sequence shown in the diagram, which in turn is defined by the distance between the most distant probes. Blue triangles indicate introns; numbers along the bottom of each graph indicate the amount of gene up- and downstream of the current window. Y-axis (temp) is the Tm for each probe calculated in standard salt conditions. Left column contains genes that correlated well across Agilent CY5 PROCESSED and Affymetrix GC-RMA. Right column contains genes with poor correlation. Other normalization/tissue combinations produced lists of different genes that were either well or poorly correlated, but the pattern seen here was conserved.
MATERIALS AND METHODS
Commercial RNA from Stratagene (La Jolla, CA; liver #540017, lung #540019, spleen #540187) enabled us to minimize variability in RNA quality. We ran each set of replicates on the same day and in the same laboratory, and followed the manufacturer's hybridization and scanning protocols precisely. We used three pooled human tissuesj (liver, lung, spleen) and all three pairwise casesk using three normalization methods for Agilent and five for Affymetrix yielding the twenty-four separate measurements per genei (Table 1). Affymetrix data was processed using default values in Microarray Suite 5.0; Affy data had low noise (RawQ < 15), low background (<600) and low 3′ to 5′ ratio of actin and GAPDH (ratio <2). Agilent arrays were scanned on an Agilent scanner and processed using default values in Feature Extraction version 8.1. Raw Affy Images were processed using default settings, resulting in .CHP and .CEL files. CEL files were used to generate MAS5, dChip, GC-RMA and RAW data using AffyComp package in Bioconductor. dChip can use or ignore MM data when building its model; we selected both PM and PM–MM settings, and ‘invariant set normalization’ in dChip 2006 (February 16, 2006 build). GC-RMA requires that an entire data set (experiment) be defined in order to estimate a grand mean and variance estimate, so we included all tissues as a defined experiment. All Agilent normalizations were performed using default settings in Feature Extraction (61). Expression data was loaded into GeneSpring 7.2 to perform median normalization on 22215 probes for Affymetrix and 18703 probes for Agilent. Clustering, ANOVA, t-tests and Venn diagrams were all done in GeneSpring. t-tests always used a homoscedastic Welch correction with no familywise error rate (FWER) correction. Significance level was set at the critical values of p < 5.3 × 10⁻⁵ for Agilent and p < 4.5 × 10⁻⁵ for Affymetrix, which is that value where one false positive is expected. Ratio calculations, power analysis, regression and other statistical calculations were done in S + 7.0.4. Feature selection and classification were done on custom C and C++ programs run in parallel using MPI messaging on an IBM 1350 Linux cluster running RedHat EL3. Each of the 512 nodes contained 2 Intel Xeon 2.4 GHz CPUs with 4G RAM. Processing time ranged between 1 and 30 h depending on the number of genes used per analysis and cross-validation method.
DISCUSSION
Intra-lab and intra-platform correlation and calibration can optimize data quality and reduce lab- and platform-dependent biases. In industrial Six Sigma Quality Control, the most influential parameters affecting process quality are identified to reduce faults in order of importance. In the case of expression data, poorly correlated data is often caused by RNA quality. This is prevalent even given the differences in probe location (Figure 7) and platform idiosyncrasies. Array users may be unable to obtain the advertised performance figures for a commercial microarray due to difficult-to-extract tissues, such as plant cells. We propose that precision, power and pathway analysis can pinpoint samples that lie outside a consensus, especially in large experiments or with public data. Clustering has seen a backlash against graphical interpretation of data, but taken in context and with an understanding of the limitations, it presents array data in a richly informative way. Degraded RNA causes signal compression and high background which show clearly in clustering analysis. Power and sample size calculations also pinpoint degraded RNA or poor labeling by showing greatly reduced sensitivity and delta values.
Classification has become a much-used method in disease prognosis and diagnosis (62); it is therefore important to understand the causes of misclassification. Microarray normalization methods, especially loess (63) and model-based (28), often cause large non-linear changes that attempt to improve the reliability of measuring relative differences across samples (64). High precision methods like GC-RMA can affect the classifier, resulting in very low error, but classifiers are less affected by highly biased data than significance tests. As seen in Figure 3, highly aggressive normalizations combined with very differential tissues, can cause mis-clustering. However, genes identified as either up or down between tissues across normalization methods can be quite comparable if one quantizes to the level of ‘up’, ‘down’ and ‘unchanged’ by using the appropriate confidence interval. Agilent data is almost unaffected by channel and normalization effects, but the normalizations were much more subtle than Affymetrix methods. Normalized expression data often exaggerates the magnitude of ratios and inflates false positives over comparable qRT-PCR data (54,65). That effect alone will change the rank of genes, and will change the biological pathways identified (Table 4). It is increasingly difficult to identify biomarkers that work independently of the platform (44,55,66,67), but appropriate normalization choice may ameliorate this effect somewhat. Affymetrix MAS5 and Agilent MEAN share 256 genes, MAS5 and BSUB share 261 genes and PM–MM and PROCESSED share 243 genes, the highest overlap between platforms. These low-precision but high-accuracy methods, while often underpowered, can also provide genes that are more platform-neutral. Although the background subtraction methods generally provide the highest false positives, their conservative nature tends to avoid strong and potentially inaccurate biases (Tables 3 and 4). Based on these outcomes, we recommend MAS5 or dChip PM–MM and Agilent PROCESSED normalizations for feature selection and classification, and for biological pathway analysis, especially when identifying platform-neutral biosignatures. If comparisons across laboratories or expression platforms will be done, the most conservative estimate of Affymetrix data is best. We caution the user that the power of detection drops considerably with MAS5 and dChip PM–MM, and more technical replicates should be used to obtain the same detection limit as GC-RMA or dChip. Most public expression databases provide the MAS5-normalized data (e.g. the SOFT file format from GEO), but increasingly the .CEL files are being made available. We recommend GC-RMA normalization when large data sets are used, high sensitivity is needed, and samples are not terribly different from one another. GC-RMA provides a good signal that has been shown to have good sensitivity and accuracy in the context of distinguishing disease subtypes or other subtle phenotypes. When a moderate-to-small number of samples are used, dChip PM is an excellent choice since it strikes the best compromise between variance reduction methods and background subtraction methods. If single-color analysis is needed, extracting one of the two Agilent channels works well, but Agilent recognized the need for a single-color product and now offers one-channel protocols.
In Figure 7, we show the relationship between probe distance and the correlation between liver:spleen ratios between Agilent CY5 (PROCESSED) and Affymetrix (GC-RMA). In general, the best correlation occurred when the probes were relatively close to one another, the worst correlations occurred when the probes were distant, an effect previously reported (12,18,20). This effect actually occurs within a probeset on the Affymetrix platform, but the effect is not as pronounced. This effect is easy to measure since the probe sequences for these arrays are available from the manufacturer. When contrasting qRT-PCR and array data, one should carefully design RT primers that are uniformly spaced across the gene, rather than a single probe in the same location as the microarray. This principle reveals array limitations, but also gives the best RT results.
In summary, we provide three simple, qualitative methods of analysis to identify discrepancy in expression data sets. Precision and sensitivity measurements are useful in finding the minimal detectable fold-change and raw performance values for an array platform (or qRT-PCR). Biological comparisons such as the Gene Ontology and pathway analyses are a valuable way of examining and comparing the actual biological interpretation. Differences in pathways indicate consistency problems. This inconsistency can be quantified by counting the differentially expressed genes between platforms that move in different directions. Finally, classifier error provides a way of identifying misleading transcriptional signals. When sufficiently large numbers of informative genes exist, one can identify a platform-neutral set of genes that provide both low error across multiple platforms and low classifier error by utilizing the selection criteria mentioned above. Taken together, precision, biological interpretation and multiple platform data sets will allow better selection of genes that yield clinically useful biosignatures
ACKNOWLEDGEMENTS
This project has been funded in whole or in part with Federal funds from the National Institute of Allergies and Infectious Diseases, National Institutes of Health, Department of Health and Human Services, under Contract No. HHSN266200500040C.
Conflict of interest statement. None declared.
REFERENCES
- 1.Cobleigh MA, Tabesh B, Bitterman P, Baker J, Cronin M, Liu ML, Borchik R, Mosquera JM, Walker MG, et al. Tumor gene expression and prognosis in breast cancer patients with 10 or more positive lymph nodes. Clin. Cancer Res. 2005;11:8623–8631. doi: 10.1158/1078-0432.CCR-05-0735. [DOI] [PubMed] [Google Scholar]
- 2.Weigelt B, Hu Z, He X, Livasy C, Carey LA, Ewend MG, Glas AM, Perou CM, van 't Veer LJ. Molecular portraits and 70-gene prognosis signature are preserved throughout the metastatic process of breast cancer. Cancer Res. 2005;65:9155–9158. doi: 10.1158/0008-5472.CAN-05-2553. [DOI] [PubMed] [Google Scholar]
- 3.van't Veer LJ, Dai H, van de Vijver MJ, He YD, Hart AA, Mao M, Peterse HL, van der Kooy K, Marton MJ, et al. Gene expression profiling predicts clinical outcome of breast cancer. Nature. 2002;415:530–536. doi: 10.1038/415530a. [DOI] [PubMed] [Google Scholar]
- 4.van de Vijver MJ, He YD, van't Veer LJ, Dai H, Hart AA, Voskuil DW, Schreiber GJ, Peterse JL, Roberts C, et al. A gene-expression signature as a predictor of survival in breast cancer. N. Engl. J. Med. 2002;347:1999–2009. doi: 10.1056/NEJMoa021967. [DOI] [PubMed] [Google Scholar]
- 5.Kuo WP, Jennssen T-K, Butte AJ, Ohno-Machado L, Kohane IS. Analysis of matched mRNA measurements from two different microarray technologies. Bioinformatics. 2002;18:405–412. doi: 10.1093/bioinformatics/18.3.405. [DOI] [PubMed] [Google Scholar]
- 6.Shippy R, Sendera TJ, Lockner R, Palaniappan C, Kaysser-Kranich T, Watts G, Alsobrook J. Performance evaluation of commercial short-oligonucleotide microarrays and the impact of noise in making cross-platform correlations. BMC Genomics. 2004;5 doi: 10.1186/1471-2164-5-61. doi:10.1186/1471-2164-1185–1161. [DOI] [PMC free article] [PubMed] [Google Scholar]
- 7.Yauk CL, Berndt ML, Williams A, Douglas GR. Comprehensive comparison of six microarray technologies. Nucleic Acids Res. 2004;32 doi: 10.1093/nar/gnh123. doi:10.1093. [DOI] [PMC free article] [PubMed] [Google Scholar]
- 8.Park PJ, Cao YA, Lee SY, Kim J-W, Chang MS, Hart R, Choi S. Current issues for DNA microarrays: platform comparison, double linear amplification, and universal RNA reference. J. Biotechnol. 2004;112:225–245. doi: 10.1016/j.jbiotec.2004.05.006. [DOI] [PubMed] [Google Scholar]
- 9.Parmigiani G, Garrett E, Anbazhagan R, Gabrielson E. Molecular classification of lung cancer: a cross-platform comparison of gene expression data sets. Chest. 2004;125:103S. doi: 10.1378/chest.125.5_suppl.103s. [DOI] [PubMed] [Google Scholar]
- 10.Parmigiani G, Garrett-Mayer ES, Anbazhagan R, Gabrielson E. A cross-study comparison of gene expression studies for the molecular classification of lung cancer. Clin. Cancer Res. 2004;10:2922–2927. doi: 10.1158/1078-0432.ccr-03-0490. [DOI] [PubMed] [Google Scholar]
- 11.Pan F, Ma X, Zhou XJ. Integrative differential gene expression analysis for cross-platform microarray datasets. J. Biomed. Inform. 2006;22:1665–1667. doi: 10.1016/j.jbi.2006.08.001. [DOI] [PubMed] [Google Scholar]
- 12.Kuo WP, Liu F, Trimarchi J, Punzo C, Lombardi M, Sarang J, Whipple ME, Maysuria M, Serikawa K, et al. A sequence-oriented comparison of gene expression measurements across different hybridization-based technologies. Nat. Biotechnol. 2006;24:832–840. doi: 10.1038/nbt1217. [DOI] [PubMed] [Google Scholar]
- 13.Jong K, Marchiori E, van der Vaart A, Chin SF, Carvalho B, Tijssen M, Eijk PP, van den Ijssel P, Grabsch H, et al. Cross-platform array comparative genomic hybridization meta-analysis separates hematopoietic and mesenchymal from epithelial tumors. Oncogene. 2006 doi: 10.1038/sj.onc.1209919. doi: 10.1038/sj.onc.1209919. [DOI] [PubMed] [Google Scholar]
- 14.Guo L, Lobenhofer EK, Wang C, Shippy R, Harris SC, Zhang L, Mei N, Chen T, Herman D, et al. Rat toxicogenomic study reveals analytical consistency across microarray platforms. Nat. Biotechnol. 2006;24:1162–1169. doi: 10.1038/nbt1238. [DOI] [PubMed] [Google Scholar]
- 15.Warnat P, Eils R, Brors B. Cross-platform analysis of cancer microarray data improves gene expression based classification of phenotypes. BMC Bioinformatics. 2005;6:265. doi: 10.1186/1471-2105-6-265. [DOI] [PMC free article] [PubMed] [Google Scholar]
- 16.Shi L, Tong W, Fang H, Scherf U, Han J, Puri RK, Frueh FW, Goodsaid FM, Guo L, et al. Cross-platform comparability of microarray technology: intra-platform consistency and appropriate data analysis procedures are essential. BMC Bioinformatics. 2005;6(Suppl 2):S12. doi: 10.1186/1471-2105-6-S2-S12. [DOI] [PMC free article] [PubMed] [Google Scholar]
- 17.Schlingemann J, Habtemichael N, Ittrich C, Toedt G, Kramer H, Hambek M, Knecht R, Lichter P, Stauber R, et al. Patient-based cross-platform comparison of oligonucleotide microarray expression profiles. Lab. Invest. 2005;85:1024–1039. doi: 10.1038/labinvest.3700293. [DOI] [PubMed] [Google Scholar]
- 18.Mecham BH, Klus GT, Strovel J, Augustus M, Byrne D, Bozso P, Wetmore DZ, Mariani TJ, Kohane IS, et al. Sequence-matched probes produce increased cross-platform consistency and more reproducible biological results in microarray-based gene expression measurements. Nucleic Acids Res. 2004;32:e74. doi: 10.1093/nar/gnh071. [DOI] [PMC free article] [PubMed] [Google Scholar]
- 19.Hardiman G. Microarray platforms—comparisons and contrasts. Pharmacogenomics. 2004;5:487–502. doi: 10.1517/14622416.5.5.487. [DOI] [PubMed] [Google Scholar]
- 20.Carter SL, Eklund AC, Mecham BH, Kohane IS, Szallasi Z. Redefinition of Affymetrix probe sets by sequence overlap with cDNA microarray probes reduces cross-platform inconsistencies in cancer-associated gene expression measurements. BMC Bioinformatics. 2005;6:107. doi: 10.1186/1471-2105-6-107. [DOI] [PMC free article] [PubMed] [Google Scholar]
- 21.Canales RD, Luo Y, Willey JC, Austermiller B, Barbacioru CC, Boysen C, Hunkapiller K, Jensen RV, Knight CR, et al. Evaluation of DNA microarray results with quantitative gene expression platforms. Nat. Biotechnol. 2006;24:1115–1122. doi: 10.1038/nbt1236. [DOI] [PubMed] [Google Scholar]
- 22.Larkin JE, Frank BC, Gavras H, Sultana R, Quackenbush J. Independence and reproducibility across microarray platforms. Nat. Methods. 2005;2:337–343. doi: 10.1038/nmeth757. [DOI] [PubMed] [Google Scholar]
- 23.Shi L, Reid LH, Jones WD, Shippy R, Warrington JA, Baker SC, Collins PJ, de Longueville F, Kawasaki ES, et al. The MicroArray Quality Control (MAQC) project shows inter- and intraplatform reproducibility of gene expression measurements. Nat. Biotechnol. 2006;24:1151–1161. doi: 10.1038/nbt1239. [DOI] [PMC free article] [PubMed] [Google Scholar]
- 24.Tong W, Lucas AB, Shippy R, Fan X, Fang H, Hong H, Orr MS, Chu TM, Guo X, et al. Evaluation of external RNA controls for the assessment of microarray performance. Nat. Biotechnol. 2006;24:1132–1139. doi: 10.1038/nbt1237. [DOI] [PubMed] [Google Scholar]
- 25.Model F, Konig T, Piepenbrock C, Adorjan P. Statistical process control for large scale microarray experiments. Bioinformatics. 2002;18:155S–163S. doi: 10.1093/bioinformatics/18.suppl_1.s155. [DOI] [PubMed] [Google Scholar]
- 26.Adolphson A, Keighley T, Field J, Fisher N, Israel S, Phatak A, Saunders I, Sparks R, Veevers A. Australia: Mathematical and Information Sciences; 2002. Commonwealth Scientific and Industrial Research Organization. [Google Scholar]
- 27.Crosier RB. A new two-sided cumulative sum quality control scheme. Technometrics. 1986;28:187–194. [Google Scholar]
- 28.Li C, Wong WH. Model-based analysis of oligonucleotide arrays: expression index computation and outlier detection. Proc. Nat. Acad. Sci. U.S.A. 2001;98:31–36. doi: 10.1073/pnas.011404098. [DOI] [PMC free article] [PubMed] [Google Scholar]
- 29.Wu Z, Irizarry RA, Gentleman R, Murillo FM, Spencer F. Working Paper 1. Johns Hopkins University, Dept. of Biostatistics Working Papers; 2004. A model based background adjustment for oligonucleotide expression arrays. [Google Scholar]
- 30.Irizarry RA, Warren D, Spencer F, Kim IF, Biswal S, Frank BC, Gabrielson E, Garcia JG, Geoghegan J, et al. Multiple-laboratory comparison of microarray platforms. Nat. Methods. 2005;2:329–330. doi: 10.1038/nmeth756. [DOI] [PubMed] [Google Scholar]
- 31.Irizarry RA, Hobbs B, Collin F, Beazer-Barclay YD, Antonellis KJ, Scherf U, Speed TP. Exploration, normalization, and summaries of high density oligonucleotide array probe level data. Biostatistics. 2003;4:249–264. doi: 10.1093/biostatistics/4.2.249. [DOI] [PubMed] [Google Scholar]
- 32.Irizarry RA, Bolstad BM, Collin F, Cope LM, Hobbs B, Speed TP. Summaries of Affymetrix GeneChip probe level data. Nucleic Acids Res. 2003;31:e15. doi: 10.1093/nar/gng015. [DOI] [PMC free article] [PubMed] [Google Scholar]
- 33.Irizarry RA, Wu Z. 2006. Affycomp ver. 1.4.3. Bioconductor package for R. [Google Scholar]
- 34.Xiao J, Lucas AB, D'Andrade PN, Visitacion M, Tangvoranuntakul P, Fulmer-Smentek SB. Performance of the Agilent microarray platform for one-color analysis of gene expression. Agilent Technical Note. 2006 www.chem.agilent.com/temp/Rad607C5/00057115.pdf. [Google Scholar]
- 35.Hornberger J, Cosler LE, Lyman GH. An economic analysis of targeting chemotherapy using a 21-gene RT-PCR assay in lymph-node-negative, estrogen-receptor-positive, early-stage breast cancer. Am. J. Manag. Care. 2005;11:313–324. [PubMed] [Google Scholar]
- 36.Ahr A, Holtrich U, Solback C. Molecular classification of breast cancer patients by gene expression profiling. J. Pathol. 2001;195:312–320. doi: 10.1002/path.955. [DOI] [PubMed] [Google Scholar]
- 37.Ahr A, Kam T, Solback C. Identification of high risk breast-cancer patients by gene expression profiling. Lancet. 2002;359:131–132. doi: 10.1016/S0140-6736(02)07337-3. [DOI] [PubMed] [Google Scholar]
- 38.Detours V, Durmont JE, Bersini H, Maenhaur C. Integration and cross-validation of high-throughput gene expression data: comparing heterogenous data sets. FEBS Lett. 2003;546:98–102. doi: 10.1016/s0014-5793(03)00522-2. [DOI] [PubMed] [Google Scholar]
- 39.Griffith OL, Pleasance ED, Fulton DL, Oveisi H, Ester M, Siddiqui AS, Jones SJM. Assessment and integration of publicly available SAGE, cDNA microarray, and oligonucleotide microarray expression data for global coexpression analyses. Genomics. 2005;86:476–488. doi: 10.1016/j.ygeno.2005.06.009. [DOI] [PubMed] [Google Scholar]
- 40.Ghosh D, Barette TR, Rhodes DR, Chinnaiyan AM. Statistical issues and methods for meta-analysis of microarray data: a case study in prostate cancer. Funct. Integr. Genomics. 2004;3:180–188. doi: 10.1007/s10142-003-0087-5. [DOI] [PubMed] [Google Scholar]
- 41.Shyamsundar R, Kim YH, Higgins JP, Montgomery K, Jorden M, Sethuraman A, van de Rijn M, Botstein D, Brown PO, et al. A DNA microarray survey of gene expression in normal human tissues. Genome Biol. 2005;6:r22.21–r22.29. doi: 10.1186/gb-2005-6-3-r22. [DOI] [PMC free article] [PubMed] [Google Scholar]
- 42.Lee Y, Lee CK. Classification of multiple cancer types by multicategory support vector machines using gene expression data. Bioinformatics. 2003;19:1132–1139. doi: 10.1093/bioinformatics/btg102. [DOI] [PubMed] [Google Scholar]
- 43.Culhane AC, Perriere G, Considine EC, Cotter TG, Higgins DG. Between-group analysis of microarray data. Bioinformatics. 2002;18:1600–1608. doi: 10.1093/bioinformatics/18.12.1600. [DOI] [PubMed] [Google Scholar]
- 44.Cho J-H, Lee D, Park JH, Kim K, Lee I-B. Optimal approach for classification of acute leukemia subtypes based on gene expression data. Biotechnol. Prog. 2002;18:847–854. doi: 10.1021/bp025517o. [DOI] [PubMed] [Google Scholar]
- 45.Hvidsten TR, Laegreid A, Komorowski J. Learning rule-based models of biological process from gene expression time profiles using gene ontology. Bioinformatics. 2003;19:1116–1123. doi: 10.1093/bioinformatics/btg047. [DOI] [PubMed] [Google Scholar]
- 46.He YD, Dai H, Schadt EE, Cavet G, Edwards SW, Stepaniants SB, Duenwald S, Kleinhanz R, Jones AR, et al. Microarray standard data set and figures of merit for comparing data processing methods and experiment designs. Bioinformatics. 2003;19:956–965. doi: 10.1093/bioinformatics/btg126. [DOI] [PubMed] [Google Scholar]
- 47.Rise ML, Douglas SE, Sakhrani D, Williams J, Ewart KV, Rise M, Davidson WS, Koop BF, Devlin RH. Multiple microarray platforms utilized for hepatic gene expression profiling of GH transgenic coho salmon with and without ration restriction. J. Mol. Endocrinol. 2006;37:259–282. doi: 10.1677/jme.1.02031. [DOI] [PubMed] [Google Scholar]
- 48.Edelman E, Porrello A, Guinney J, Balakumaran B, Bild A, Febbo PG, Mukherjee S. Analysis of sample set enrichment scores: assaying the enrichment of sets of genes for individual samples in genome-wide expression profiles. Bioinformatics. 2006;22:e108–e116. doi: 10.1093/bioinformatics/btl231. [DOI] [PubMed] [Google Scholar]
- 49.Chudin E, Kruglyak S, Baker SC, Oeser S, Barker D, McDaniel TK. A model of technical variation of microarray signals. J. Comput. Biol. 2006;13:996–1003. doi: 10.1089/cmb.2006.13.996. [DOI] [PubMed] [Google Scholar]
- 50.Xu L, Tan AC, Naiman DQ, Geman D, Winslow RL. Robust prostate cancer marker genes emerge from direct integration of inter-study microarray data. Bioinformatics. 2005;21:3905–3911. doi: 10.1093/bioinformatics/bti647. [DOI] [PubMed] [Google Scholar]
- 51.Culhane AC, Perriere G, Higgins DG. Cross-platform comparison and visualisation of gene expression data using co-inertia analysis. BMC Bioinformatics. 2003;4:59. doi: 10.1186/1471-2105-4-59. [DOI] [PMC free article] [PubMed] [Google Scholar]
- 52.Bolstad BM, Irizarry RA, Astrand M, Speed TP. A comparison of normalization methods for high density oligonucleotide array data based on variance and bias. Bioinformatics. 2003;19:185–193. doi: 10.1093/bioinformatics/19.2.185. [DOI] [PubMed] [Google Scholar]
- 53.Rhodes DR, Yu J, Shanker K, Deshpande N, Varambally R, Ghosh D, Barrette T, Pandey A, Chinnaiyan AM. Large-scale meta-analysis of cancer microarray data identifies common transcriptional profiles of neoplastic transformation and progression. Proc. Nat. Acad. Sci. U.S.A. 2004;101:9309–9314. doi: 10.1073/pnas.0401994101. [DOI] [PMC free article] [PubMed] [Google Scholar]
- 54.Li J, Spletter ML, Johnson JA. Dissecting tBHQ induced ARE-driven gene expression through long and short oligonucleotide arrays. J. Physiol. Genom. 2005;21:43–58. doi: 10.1152/physiolgenomics.00214.2004. [DOI] [PubMed] [Google Scholar]
- 55.Bloom G, Yang IV, Boulware D, Kwong KY, Coppola D, Eschrich S, Quackenbush J, Yeatman TJ. Multi-platform, multi-site, microarray-based human tumor classification. Am. J. Pathol. 2004;164 doi: 10.1016/S0002-9440(10)63090-8. [DOI] [PMC free article] [PubMed] [Google Scholar]
- 56.Draghici S. 2006 vortex.cs.wayne.edu/Projects.htm#Onto-Express. [Google Scholar]
- 57.Parrish RS, Spencer HJ. Effect of normalization on significance testing for oligonucleotide microarrays. J. Biopharm. Stat. 2004;14:575–589. doi: 10.1081/BIP-200025650. [DOI] [PubMed] [Google Scholar]
- 58.Sima C, Dougherty ER. What should be expected from feature selection in small-sample settings. Bioinformatics. 2006;22:2430–2436. doi: 10.1093/bioinformatics/btl407. [DOI] [PubMed] [Google Scholar]
- 59.Xiong M, Fang X, Zhao J. Biomarker identification by feature wrappers. Genome Res. 2001;11:1878–1887. doi: 10.1101/gr.190001. [DOI] [PMC free article] [PubMed] [Google Scholar]
- 60.Hua J, Xiong Z, Lowey J, Suh E, Dougherty ER. Optimal number of features as a function of sample size for various classification rules. Bioinformatics. 2005;21:1509–1515. doi: 10.1093/bioinformatics/bti171. [DOI] [PubMed] [Google Scholar]
- 61.Dobbin K, Kawasaki E, Petersen D, Simon R. Characterizing dye bias in microarray experiments. Bioinformatics. 2005;21:2430–2437. doi: 10.1093/bioinformatics/bti378. [DOI] [PubMed] [Google Scholar]
- 62.Bittner ML, Meltzer MR, Chen Y, Jiang Y, Seftor E, Hendrix M, Radmacher M, Simon R, Yakhini Z, et al. Molecular classification of cutaneous malignant melanoma by gene expression profiling. Nature. 2000;406:536–540. doi: 10.1038/35020115. [DOI] [PubMed] [Google Scholar]
- 63.Wolber PK, Shannon KW, Fulmer-Smentek SB, Collins PJ, Lenkov K, Troup CD, Connell SD, Ghosh S, D'Andrade PN, et al. Robust local normalization of gene expression microarray data. Agilent Technical Note. 2002:1–4. [Google Scholar]
- 64.Fan W, Pritchard JI, Olsen JM, Khalid N, Zhao LP. A class of models for analyzing GeneChip gene expression analysis array data. BMC Genomics. 2005;6 doi: 10.1186/1471-2164-6-16. doi:10.1186/1471-2164-1186–1116. [DOI] [PMC free article] [PubMed] [Google Scholar]
- 65.de Reynies A, Geromin D, Cayuela J-M, Petel F, Dessen P, Sigaux F, Rickman DS. Comparison of the latest commercial short and long oligonucleotide microarray technologies. BMC Genomics. 2006;7 doi: 10.1186/1471-2164-7-51. doi:10.1186/1471-2164-1187–1151. [DOI] [PMC free article] [PubMed] [Google Scholar]
- 66.Ben-Dor A, Bruhn L, Friedman N, Nachman I, Schummer M, Yakhini Z. Tissue classification with gene expression profiles. J. Comput. Biol. 2000;7:559–583. doi: 10.1089/106652700750050943. [DOI] [PubMed] [Google Scholar]
- 67.Dobbin K, Simon R. Comparison of microarray designs for class comparison and class discovery. Bioinformatics. 2002;18:1438–1445. doi: 10.1093/bioinformatics/18.11.1438. [DOI] [PubMed] [Google Scholar]