Abstract
We explore here the possibility of determining theoretically the free energy change associated with large conformational transitions in DNA, like the solvent-induced B⇔A conformational change. We find that a combination of targeted molecular dynamics (tMD) and the weighted histogram analysis method (WHAM) can be used to trace this transition in both water and ethanol/water mixture. The pathway of the transition in the A→B direction mirrors the B→A pathway, and is dominated by two processes that occur somewhat independently: local changes in sugar puckering and global rearrangements (particularly twist and roll) in the structure. The B→A transition is found to be a quasi-harmonic process, which follows closely the first spontaneous deformation mode of B-DNA, showing that a physiologically-relevant deformation is in coded in the flexibility pattern of DNA.
INTRODUCTION
DNA is a flexible and polymorphic structure, whose conformation changes as a response to the presence of ligands, variations in the temperature or modifications in the solvent (1–3). Such flexibility is implicitly coded in the structure of the DNA (4–8) and is crucial to its biological functionality, since, for example, binding of DNA-regulatory proteins can require dramatic changes in the structure of nucleic acid. Understanding DNA's flexibility and conformational transition is thus a necessary step in transforming structural data into biologically important information.
In general, the determination of DNA structure is no longer the challenge for experimental techniques had it used to be, both NMR and X-ray techniques are now able to provide accurate structures for most sequences (more than 2500 (experimentally-solved) DNA structures are deposited in the Protein Data Bank in June 2006). Unfortunately, these experimental techniques are less effective at discovering flexibility or tracing conformational transitions, and so for this we currently make major use of simulation techniques like molecular dynamics (MD) to study these transitions at the atomic level. However, many conformational transitions in DNA occur on the micro or millisecond time scale, while timescales currently accessible by atomistic MD are in the 5–50 ns range. To overcome this problem, it is common to use biasing techniques to move simulations along a reaction coordinate at an ‘artificially’ high rate, but many of the transitions we wish to study involve large conformational changes, where many internal degrees of freedom move in a coordinated way. In this situation, it is difficult to apply standard biasing techniques based on the regular change of internal degrees of freedom along the reaction coordinate.
In summary, the analysis of large conformational changes is still a major challenge for both experimental and theoretical techniques. A clear example is the B⇔A transition of DNA duplexes (9–12). It has been known since 1953 that physiological DNA is mostly B-form, while physiological RNA is always in the A-conformation (1,2,9–12). However, the binding of some proteins to DNA can induce local B→A changes, which are needed to form some protein-DNA complexes crucial for the control of gene functionality (13–15). The B→A transition can also be brought about by other stress conditions, like crystal lattice restrictions (16 and references therein), or the addition of a large proportion of ethanol, which is believed to displace water molecules hydrating the helix, leading to a pseudo-anhydrous environment where the most compact A-form is more stable (1,12,17,18). The B⇔A conformational transition has been also the subject of numerous theoretical studies, aimed at understanding the mechanism of the transition and the atomic reasons for the A/B preference in water and other solvents. The latest generations of both CHARMM and AMBER force-fields (the ones most used in simulations of nucleic acids) recognize the A-form as the only stable conformation of duplex RNA, and the B-form as the most important conformation of DNA duplex in aqueous solution (18–28). In fact, MD trajectories of DNA duplexes started in the A-form convert very rapidly to the B-conformation (23), showing that MD simulations are able to drive the DNA from an incorrect conformation to a correct one. Unfortunately, MD simulations are unable to detect reversible transitions due to the limited length of current trajectories, which makes very unlikely to sample unstable regions of the conformational space. This lack of reversibility in the transition precludes the determination of the free energy associated with the conformational change and the determination of the atomic mechanism of the transition. For this reason, these simulations need to be biased to force them to sample reversibly the B⇔A transition.
In this article, we re-visit the B⇔A transition for a duplex DNA dodecamer using the techniques of essential dynamics, unbiased molecular dynamics simulations and a combination of targeted MD (tMD (29–31)) and the weighted histogram analysis method (WHAM (32)) in both water and a mixture of 85:15 ethanol/water. Using these techniques, we were able to trace the B⇔A transition in a smooth reversible way providing estimates of the associated free energy and of the molecular mechanism of this conformational change.
METHODS
Model selection
We felt that in order to obtain reliable conclusions on B/A preference, a DNA duplex containing at least one helix turn should be used as the model system (i.e. at least 10–12 base pairs); smaller duplexes might not provide a good model of interactions along the major and minor grooves and would maximize the effect of artifactual end-effects. Unfortunately, the increase in the size of the duplex leads to a parallel increase in the computational difficulty of the simulation. Thus, as a compromise, we decided to use Dickerson's dodecamer (dGCGCAATTGCGC)2 a B-type 12-mer oligo (33) for which several experimental structures are available (see http://ndbserver.rutgers.edu) and for which dozens of simulations have been published (4,34–37).
Systems setup for aqueous simulations
Input coordinates for trajectories started in the B-form were generated by taking Dickerson's crystal geometries (33). The experimental structure was neutralized by adding Na+ in the best regions according to classical molecular interaction potential (CMIP) calculations (38) and immersed in a rectangular box of water (aroubnd 4454 TIP3P molecules). As described elsewhere (38), MIP neutralization protocol allows the definition of a reasonable ionic atmosphere around DNA based on Poisson–Boltzman potentials, reducing then the time needed for counterion equilibration. The solvated systems were then optimized, thermalized and pre-equilibrated using our standard protocol (39–41). The final conformations were then re-equilibrated (constant pressure and temperature: 1 atm, 298 K) for 1 ns more to ensure the stability of the trajectories. Simulations starting in the A-conformation were generated by first building a standard A-type DNA duplex of the desired sequence, which was then neutralized and hydrated as below. Optimization, thermalization and pre-equilibration was carried out following the same procedure than for B-DNA but adding an harmonic restraint (K = 160 kcal/mol.rad2) that restrained all the δ angles to 80°. The same restraints were used in equilibration (4 ns) and in production runs; when they are removed the structure changes quickly to the B-form.
Ten different structures obtained during the equilibration of the A-form (with δ angles restrained to 80°) were used to perform 10 parallel un-restrained 3 ns MD simulations. Within this short simulation time the A→B transition was completed in all replicas, which allowed us to obtain reasonable statistics on the microscopic mechanism of the ‘unbiased’ transition.
Systems setup for ethanol/water simulations
Equilibrated boxes containing 85% ethanol: 15% water were generated from Monte Carlo simulations (300 million configurations) at constant pressure (1 atm) and temperature (300 K). These boxes were then used to solvate neutralized B and A-DNAs (starting conformations of B and A-DNAs were those obtained at the end the respective MD equilibrations in water (see above)). The solvated systems were thermalized (T = 298 K) and pre-equilibrated using 2 ns of MD where only the solvent was free to move. Finally, all the systems were equilibrated for 4 ns in both A and B-conformations. The δ angles were restrained to 80° in A-simulations and 120° in B-simulations. Fifteen structures obtained during the last 1 ns of the restrained B-type simulations were used to start 3 ns unbiased MD simulations intended to capture spontaneous B→A transitions in (85:15) ethanol/water. Mirror calculations with unbiased trajectories started in the A-form were used to confirm that the A-form is a stable minimum in the ethanol/water mixture considered here.
Targeted MD simulations
These simulations drive a transition by introducing a harmonic penalty that forces the sampled structure to be at a given RMSd from a reference(s) structure(s). By changing smoothly the target RMSd, we can then approach or separate the molecule from reference geometries. Several formalisms can be introduced to introduce the harmonic restraints (25), but in our hands smoother and more reliable A⇔B transitions were obtained by using eq. (1) (see results). As described below, a selected group, rather than all the atoms (25) were used to compute the RMSd.
| (1) |
where RMSd(λ) is the desired RMSd to final structure at point λ of the transition path.
After several preliminary tests, simulations were performing using windows of 0.25 Å with Krest = 0.1 kcal/mol Å2 × atom for all windows except the terminal ones, where we used spacing 0.1 Å and Krest = 8 (water) or 2 (ethanol/water) kcal/mol Å2 × atom. Unless otherwise noted, each window was simulated for 1.2 ns, the first 0.2 being considered as equilibration. To make transitions as smooth as possible, the end point of each window was used in general as starting point for the next. Using these conditions smooth transitions and good overlap between windows was obtained.
The biased samplings obtained were used to derive potentials of mean force (PMF) for the transition using the WHAM method (32). Free energies were recovered by integrating the PMF using suitable boundaries (see below).
Essential dynamics
Unbiased B-DNA and A-RNA 10 ns trajectories were used to derive the essential dynamics of relaxed B and A-forms (4,7,8,42,43). The first eigenvector (that describing the most important deformation mode) of the relaxed B-DNA (or A-RNA) trajectory was compared with the B→A transition vector (see eq. (2)) to obtain an estimate of the overlap between normal B-DNA fluctuations and B→A transitions.
| (2) |
where υrelax stands for the first eigenvector describing the essential dynamics in A or B-forms and υtrans represents the transition vector A→B or B→A.
As described in Results, the first eigenvector of the essential dynamics of B-DNA correlates well with the B→A transition vector. We then explored the harmonic energy needed to animate this eigenvector (from the B-form) to reach conformations close to the A-form. For this purpose, we add vibrational energy to the mode obtaining the associated displacement through eq. (3) from which perturbed geometries were determined. Pursuing this approach, we performed calculations of the dimension-less Mahalanobis distance (dM; see eq. (4)) between B and A forms. The Mahalanobis distance is a unit-less metric, directly related to the deformation energy (see eq. (5)) which defines the minimum pathway in essential space between two conformations. Thus, using dM calculations, we can trace the B→A transition by activating many different essential modes of the B-equilibrium trajectories computing then the energy needed to reach structures closer (to a certain threshold) to the A-form.
 |
(3) |
where E is the vibrational energy, kb is Boltzman's constant, T is absolute temperature, λ is the eigenvalue (in distance2 units).
 |
(4) |
where xi is the displacement along individual eigenvectors and λi stands for the corresponding eigenvalue (in distance2 units). The sum extends of n-important essential movements, in this article we consider the first 10th ones, which accounts for more than 85% of the DNA variance.
| (5) |
Technical details
All simulations were carried in the isothermal–isobaric ensemble (P = 1 atm, T = 300 K). Monte Carlo simulations (for preparing the hybrid solvent box) were performed using the BOSS3.4 computer program (44) allowing internal rotations in the solvent molecules, but no other internal changes. A non-bonded cutoff of 12 Å was used in conjunction with periodic boundary conditions to reduce the number of non-bonded interactions in these Monte Carlo simulations. Molecular dynamics (MD) calculations were carried out using the AMBER8 computer programs (45) and long-range electrostatic effects were taken into account by means of the Particle Mesh Ewald method (46). PARM99 was used to represent DNA interactions (47,48), while TIP3P (49) and all-atoms OPLS (50) parameters were used for the solvents. The use of SHAKE (51) to maintain all the bonds at equilibrium distance allowed us to use 2 fs as the integration step size.
Analysis of trajectories was carried out using PTRAJ module included with the AMBER8 release as well as software developed in house. All simulations were performed using the Mare Nostrum supercomputer at the Barcelona Supercomputer Center.
RESULTS AND DISCUSSION
Unbiased A→B trajectories
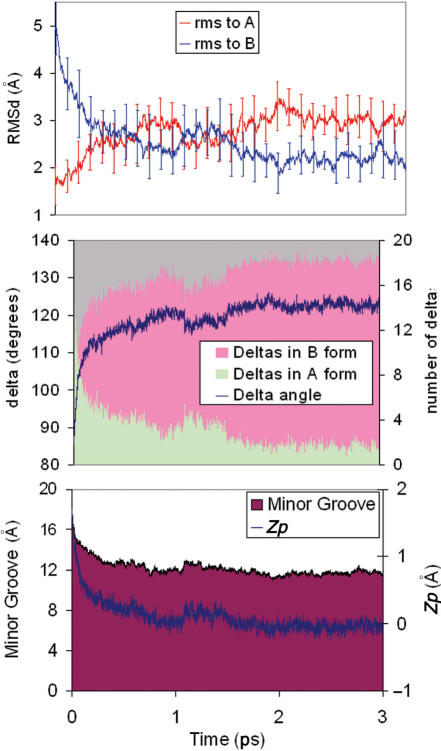
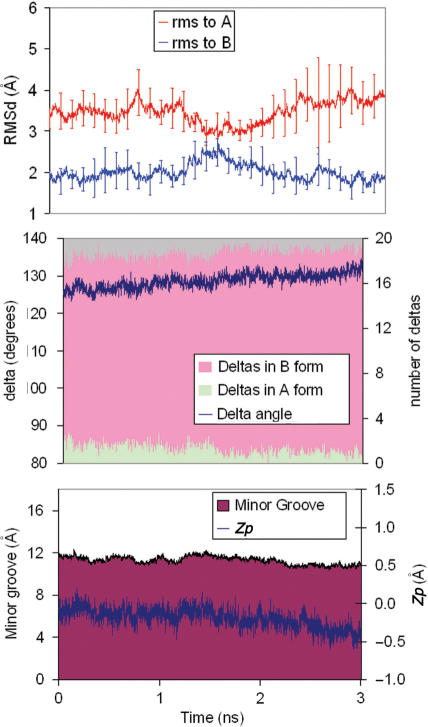
As reported by others (19–24), MD simulations of DNA using the PARM99 force-field produces a spontaneous A→B conformational change in water in short simulation times, which makes possible the study of the atomic mechanism of such an unforced transition. Ten different trajectories starting from well-equilibrated A-form conformations move to the B-conformation within the 3 ns simulation times. Extension of five of these trajectories to 10 ns did not shown any back-transition to the A-form (data not shown, but available upon request). The analysis of the RMSd plots from canonical A and B-forms show that the transition starts very quickly, and after around 500 ps, the lines of RMSd(versus A) and RMSd(versus B) cross for the first time (see Figure 1). After this period, the structures fluctuate around a conformation with B-like properties (see Figure 1; individual plots for trajectories are shown at http://mmb.pcb.ub.es/A-B), but still not far from the A-form in terms of RMSd. For all 10 trajectories, the transition in RMSd only happens after major changes in sugar puckering, supporting the idea that sugar re-puckering is the driving force for A→B transition (24). Once delta change, helical parameters like roll and twist are adjusted to the standard B values. Thus, in just 100 ps half of the sugars which were originally in the N-conformation (δ below 95° have moved into the E and S regions (δ greater than 95°) and after 500 ps only four sugars are (in average) in the N-region. Slow re-puckering of these residual North sugars occur along the 1–3 ns simulation period. Analysis of individual sugars shows that in general, sugars in purine nucleotides change faster than those in pyrimidines. Within purines G shows faster transitions than A and within pyrimidines C is that with the slower rate of N→S transitions.
Figure 1.
TOP: Average variation with time of the RMSd (from A and B canonical structures) of 10 unbiased trajectories starting from A-form in water. Standard deviations are shown. MIDDLE: average variations of δ and number of sugars in North conformation for the same trajectories. BOTTOM: Variations in the average minor groove width (mGw) and Zp.
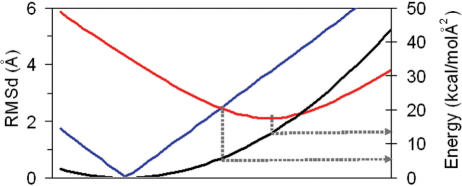
Very interestingly, the transition vector correlates very well (see Table 1) with the first deformation mode of both relaxed B and A-forms (taken from ref. (7)). This indicates that the deformation pattern needed to perform the biologically relevant B⇔A transition is implicitly coded in the polymeric structure of these nucleic acids and that in a rough approximation, the A-form can be interpreted as a vibrational-activated state of B-DNA. This hypothesis is supported by analyzing the structures obtained by moving the B-DNA along the first essential mode (see Figure 2). Thus, a simple deformation along the first mode yields structures with RMSd(A) = RMSd(B) for vibrational energies around 4 kcal/mol, and for deformation energy around 12 kcal/mol to structures that are at only 2 Å from the A-form (see Figure 2). The activation of additional deformation modes (up to 10) using the Mahalanobis metric allowed us to slightly reduce the RMSd from target A-form (to 1.7 Å), but at the expense of a very large vibrational energy (19 kcal/mol). Clearly, B→A transitions follows closely the first mode, and local rearrangement from a distorted to the real A-conformation requires some local, probably non-harmonic deformations.
Table 1.
Dot products between the unit vectors representing the first essential movement of different trajectories. A value of 1 (or −1) indicates a perfect match between essential deformation movements. Note that the first essential movement obtained in the unbiased A→B simulation or in the tMD B→A one should correspond to the B→A transition vector. The non-optimum overlap between them (around 90%) gives an indication of the uncertainties in the definition of this transition vector
| DNA | RNA | B→A (Unbiased) | B→A (tMD) | |
|---|---|---|---|---|
| DNA | 1.00 | −0.81 | 0.94 | 0.87 |
| RNA | 1.00 | −0.81 | −0.90 | |
| B→A (unbiased) | 1.00 | 0.86 |
Figure 2.
Representation of the energy (black), and RMSd with respect to A (in red) and B (in blue), when a relaxed DNA structure is perturbed along its first essential mode. RMSds were computed with reference to the MD-averaged A and B-conformations. Blue line is not smooth because perturbation along first essential mode is made using MD-averaged B-conformation.
Targeted MD transitions in water
Unbiased simulations provide an intuitive picture of the A→B transition in water, but they are not able to provide any estimate of the thermodynamics, or kinetics of the process. Essential dynamics allows us to obtain only a rough qualitative picture of the B→A transition, making necessary the use of more accurate non-harmonic techniques like the tMD/WHAM one.
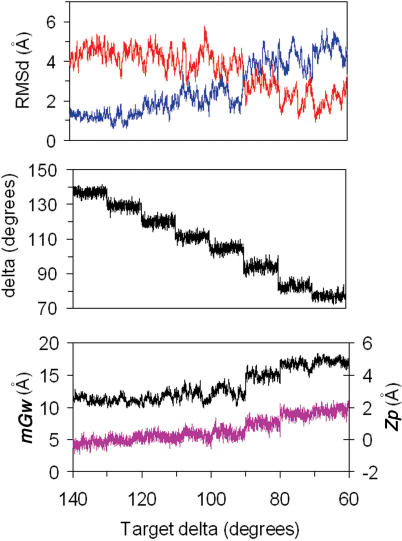
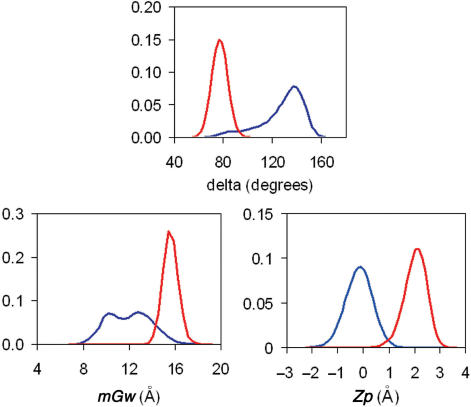
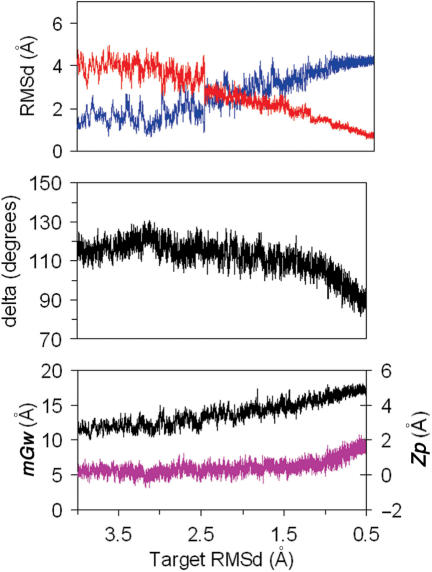
Our previous work (24) and the unbiased simulations discussed above suggested that sugar puckering could be a good variable to discriminate between B and A-form. Accordingly, we undertook a study of the B→A transition by means of restrained MD simulations, slowly changing the δ angles of all sugars from 140 to 70°. As shown in Figure 3, and in data from equilibrium simulations in Figure 4, the B→A transition happens for δ values around 90°. Note that such a transition is clear not only in the RMSd from A and B-conformations, but also in the width of the minor groove (mGw) and in Olson's (52) Zp parameter (see Figure 3). Thus, a structure can be assigned to the A-family if RMSd(A) < RMSd(B), «Zp» > 1.0; «δ» < 95° and ‘mGw’ > 14 Å. When only the RMSd criteria is fulfilled, the structure should be labeled as distorted B-form. These threshold need to be consider to validate when a tMD simulation is really driving the structure to the target conformation and not to a distorted geometry, which might have small RMSd to target conformation but very poor internal geometry.
Figure 3.
TOP: Profile of RMSds (from A in red and B in blue) obtained from MD trajectories where the target δ (δt) was varied from 140 to 70° (see text). Profiles corresponding the average δ are shown in the MIDDLE panel and those for the average mGw (black) and Zp (pink) are shown BOTTOM.
Figure 4.
Distribution of TOP: δ angle, BOTTOM-left: mGw and BOTTOM-right: Zp for equilibrium trajectories of B-DNA blue and A-RNA (red). Trajectories were taken from ref.(7).
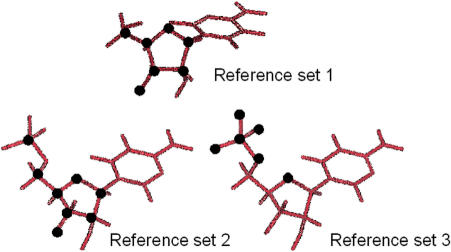
While the use of restraints on delta permitted the required transition, and was extremely useful to define clear threshold values to classify structures as A or B, it does not allow us to easily recover the free energy associated to the conformational change. Thus, we decided to follow the A⇔B transition by defining the RMSd function considering only heavy atoms in the sugar ring (Reference set 1, see Figure 5). Additional calculations were performed considering an extended set of restraint atoms which include all ring atoms plus O5’ (Reference set 2) and an alternative set of restraint atoms formed by the phosphate group and O4’ (Reference set 3). Using any of these three RMSd definitions and the restraint function shown in eq. (1), we were able to reproduce correct B→A transitions (see Figure 6 and Figure S1 in Supplementary material), where both starting and end structures fits the canonical B and A-forms. It is worth noting that such smooth transitions cannot be so easily obtained with other choices of the RMSd function. Caution is then necessary against a un-supervised pure-force use of the targeted MD technique to follow complex conformational transitions.
Figure 5.
Representation of different sets of atoms used to restrain the system in tMD simulations of the B⇔A transition in water and 85:15 ethanol/water mixture.
Figure 6.
Variation of TOP: RMSds (from A in red and B in blue), MIDDLE: δ angle; BOTTOM: Zp (pink) and mGW (black), obtained in targeted MD trajectories in pure water using Reference set 1.
It is worth to note that the transition pathway closely follows the direction of the first essential mode of relaxed DNAs and RNAs (see Table 1), confirming the results obtained for unbiased A→B transitions. This finding demonstrates that the ability to change between the B and A-conformers is implicitly coded in the structure of nucleic acid duplexes. Interestingly, irrespective of the set of atoms used to define the RMSd with respect to target structures the transition is similar: for RMSd(λ) ≈ 2.0 Å, the RMSd(A) and RMSd(B) lines cross, but until very late in the reaction coordinate (RMSd(λ) ≈ 1.0 Å) full transition is not achieved (see Figure 6 and Supplementary Figure S1).
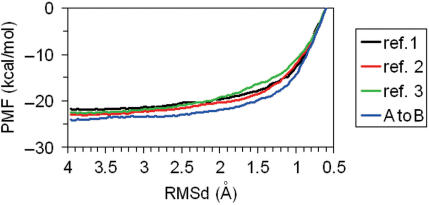
The PMF associated to the B→A transitions in water are well converged and seems robust to the selection of the set of restrained atoms and to changes in the ‘forward’ or ‘reverse’ direction of the transition (see Figure 7). As predicted, the A→B PMF takes the form of a downhill landscape, where the A-form is not defined as a minimum. Integration of the PMF profiles provides a direct estimate of the free energy associated with conformational transitions. Inspection of Figure 6 (see text) allowed us to classify the PMF into three regions: (i) pure A-form (RMSd(λ) ≤ 1.0 Å), pure B-form (RMSd(λ) ≥ 2.0 Å), and distorted B-forms (2.0 Å > RMSd(λ) > 1.0 Å) Using these values, the deformation of B-DNA to achieve structures with RMSd(A) ∼ RMSd(B) requires around 3 kcal/mol (see Table 2), while a full B→A transition is associated with a free energy penalty of 11.4 kcal/mol. After sending the first version of this manuscript for publication, a colleague addressed us to the work by Zhurkin's group (53) who reported empirical scales for the free energy of B→A transition in water. Applying Zhurkin's data in our duplex, we obtain an ‘empirical’ estimate of 11 kcal/mol for the B→A transition, a value that matches perfectly our estimate. It is also worth noting the very good agreement between rigorous tMD/WHAM estimates and rough values obtained by essential dynamics in Figure 2, something that confirms that the B→A transition is a pure ‘up-hill’ process which can be simplified as a vibrational activation of the first deformation mode of B-DNA. A small amount of energy is enough to distort the DNA to conformations that are not far in terms of RMSd from the A-form, however, a full transition is very unlikely and requires major changes in the environment, such as the introduction of proteins or co-solvents.
Figure 7.
Potential of mean force (PMF) obtained from tMD–WHAM calculations of the B→A transition in water. Profiles were obtained using different sets of atoms to define the target RMSd in each window (see insert and text) and using both forward and reverse directions.
Table 2.
Free energy (in kcal/mol) difference for B→A conformational transition in water and 85:15 ethanol/water obtained by integration of the PMF curves. For definition of the states, see text
| Solvent | B→B(dist) | B(dist)→A | B→A(all) | A→A(dist) |
|---|---|---|---|---|
| Water | 3.2 | 8.1 | 11.4 | – |
| (EtOH/water) | – | – | −0.8 | 0.4 |
In summary, all our simulations suggest that in water the A→B transition is a downhill process, and that the A-form is not a stable conformation of Dickerson's dodecamer in water. This result is in full agreement with all previous MD simulations irrespective of the force-field, sequence or simulation conditions used (18–22,24,25), which argues against force-field or simulation protocols. Special agreement is found with data by Banavali and Roux (25), who using other force-field a shorter oligo, and a different functional for the restrain energy obtained quite similar results, demonstrating that the method, when applied with common sense is robust. However, these theoretical results have been severely criticized by Jose and Porschke (54,55), who found that experimentally the transition time for the A⇔B change (around 70:30 ethanol/water) is in the range 100–101 μs, which should indicate the existence of a sizeable transition barrier and the presence of two well-characterized canonical forms. We will show below that the criticism is not justified since the shape of the free-energy curve in pure water or ethanol-rich solutions is completely different, and conclusions obtained in rich ethanol mixtures cannot be simply extrapolated to water solution (see next sections).
Study of B→A transitions in 85:15 ethanol/water by unbiased MD simulations
It is experimentally known that in the presence of large concentration of ethanol, the DNA changes from a B to an A-type conformation (1,12,17,18,54,55). Up to 15 MD simulations of Dickerson's dodecamer starting from the A-conformation remain in this region, as previously found by McConnell and Beveridge (21). Extension of one of this simulation to 10 ns does not show any dramatic change from the shorter ones (see Supplementary Figure S2), suggesting that the force-field recognize the A-form as a stable conformation of DNA in ethanol/water solution. However, 10 unbiased 3 ns trajectories starting in the B-conformation remains within this conformational family (see Figure 8), confirming again previous results by other authors (20,21,55). Overall, unbiased MD simulations suggest that in the presence of high concentration of ethanol, the free-energy landscape is different to that in pure water, since at least two minima (close to the B and A-forms) exist, separated by a sizeable energy barrier.
Figure 8.
TOP: Average variation along the time of the RMSds (from A and B canonical structures, in Å) of 10 unbiased trajectories starting from B-form in 85:15 ethanol/water mixture. Standard deviations are shown. MIDDLE: average variations in δ and number of sugars in North conformation for the same trajectories. BOTTOM: variations of the average minor groove width (mGw) and Zp.
Targeted MD transitions in ethanol/water (85:15)
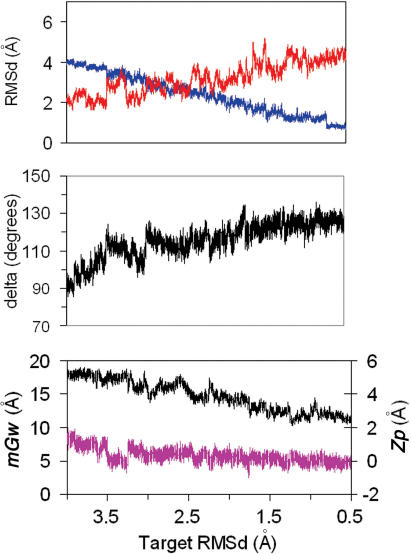
Targeted MD simulations (using restraint set 1) are able to drive a smooth and complete A→B transition (see Figure 9) in the presence of a high concentration of ethanol. Analysis of RMSd and internal geometry changes along the transition pathway demonstrate that the A→B transition in 85:15 ethanol/water starts with a fast change (RMSd(λ) ≈ 3.3 Å) of sugar puckering from N to S which leads to an immediate change in the Zp parameter, and later (RMSd(λ) ≈ 2.0 Å) to the crossing of the RMSd(A/B) lines and to the reduction of the minor groove width to canonical B-values. In summary, we see in ethanol/water a mirror copy of the transition found in pure water. Combining results in ethanol/water and pure water, we can obtain a quite complete picture of the nature of the A⇔B conformational change. Accordingly, when the DNA moves from the A to the B-form, the driving force is a change in the sugar puckering that is soon followed by a global arrangement of the structure. On the contrary, for the B→A transition a global change of shape and reduction of the width of the minor groove happens first, and only when the global structure is close to the A-form do the sugars adopt a North puckering, defining at that point a true A-type structure.
Figure 9.
Variation of TOP: RMSds (from A in red and B in blue); MIDDLE: δ angle; BOTTOM: Zp (pink) and mGW (black); obtained in targeted MD trajectories in 85:15 ethanol/water mixture using Reference set 1.
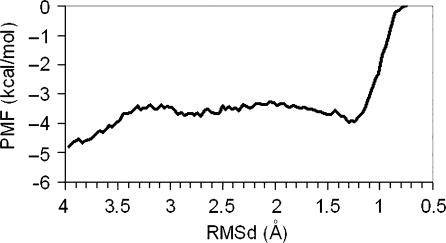
As suggested by unbiased simulations, PMF profile for the A→B transition in ethanol/water shows the existence of two minima regions separated by wide region of higher free energy (see Figure 10). Current tMD simulations cannot be used to determine precisely the free energy barrier, but a rough estimate of ∼2 kcal/mol (A→B) and ∼1 kcal/mol (B→A) can be derived from the PMF curve in Figure 10. Clearly, the shape of the free-energy profile associated with the A⇔B transition is strongly dependent on the solvent, the barrier-less A→B transition found in water is changed to a barrier-limited B→A transition in 85:15 ethanol/water. The apparent discrepancy between MD simulations (in water) and experimental studies (in high ethanol concentration) of the B⇔A transition can then be easily understood, and illustrates that caution is always necessary when MD simulation results are interpreted in the light of experimental measures performed under different conditions.
Figure 10.
Potential of mean force (PMF) obtained from tMD–WHAM calculations of the A→B transition in a mixture of ethanol (85%) and water (15%).
Analysis of geometrical variation along the tMD simulation pathway allows us to define boundaries for integration of the PMF curve. Thus, the pure A-form is obtained just in a narrow valley (4 Å ≥ RMSd(λ) ≥ 3.3 Å), an intermediate distorted A-conformation is obtained in the region: 3.3 Å ≥ RMSd(λ) ≥ 2.0 Å. Finally, a canonical B-form is defined in the region: 2.0 Å ≥ RMSd(λ). Note that these partitions agree well with the positioning of maxima and minima in the PMF curve (see Figure 10). Using these definitions, we conclude that in 85:15 ethanol/water the A-form (considering both canonical and distorted species) is 0.8 kcal/mol more stable than the B-one, while the distortion of the canonical A-form is disfavored by only 0.4 kcal/mol.
In summary, tMD simulations show that the presence of large amounts of ethanol produces a dramatic change in the A/B conformational equilibrium, in good agreement with experimental data (see Introduction). The A-form, which is negligibly populated (ratio B/A = 109) in water, is the favored conformer in 85% ethanol (ratio B/A = 0.2). Clearly, as discussed elsewhere, the differential screening of water and ethanol/water explains this dramatic solvent effect (19–21,56). However, the important point to emphasize here is that despite the different and numerous sources of errors, force-field simulations coupled to tMD and WHAM are able to reproduce a dramatic solvent-induced conformational transition.
Supplementary Material
ACKNOWLEDGEMENT
This work was supported by the Spanish Ministry of Education and Science (BIO2006-01602), Fundación La Caixa and the Barcelona Supercomputer Center (Computational Biology Program). AN and AP are fellows of the Spanish and Catalan Ministries of Science. Funding to pay the Open Access publication charge was provided by Institut de Recerca Biomèdica.
Conflict of interest statement. None declared.
REFERENCES
- 1.Saenger W. Principles of nucleic acid structure. 1984. Springer-Verlag, New York, p.556. [Google Scholar]
- 2.Bloomfield VA, Crothers DM, Tinoco I. Sausalito, Calif.: University Science Books; 2000. Nucleic acids: structures, properties, and functions; p. 794. [15] of plates. [Google Scholar]
- 3.Ghosh A, Bansal M. A glossary of DNA structures from A to Z. Acta Crystallogr. D Biol. Crystallogr. 2003;59:620–626. doi: 10.1107/s0907444903003251. [DOI] [PubMed] [Google Scholar]
- 4.Orozco M, Perez A, Noy A, Luque FJ. Theoretical methods for the simulation of nucleic acids. Chem. Soc. Rev. 2003;32:350–364. doi: 10.1039/b207226m. [DOI] [PubMed] [Google Scholar]
- 5.Ohyama T. DNA conformation and transcription. 2005. Landes Bioscience, Springer Science Business Media, Georgetown, Tex, New York, NY, p.211. [Google Scholar]
- 6.Olson WK, Gorin AA, Lu XJ, Hock LM, Zhurkin VB. DNA sequence-dependent deformability deduced from protein-DNA crystal complexes. Proc. Natl. Acad. Sci. U.S.A. 1998;95:11163–11168. doi: 10.1073/pnas.95.19.11163. [DOI] [PMC free article] [PubMed] [Google Scholar]
- 7.Noy A, Perez A, Lankas F, Luque FJ, Orozco M. Relative flexibility of DNA and RNA: a molecular dynamics study. J. Mol. Biol. 2004;343:627–638. doi: 10.1016/j.jmb.2004.07.048. [DOI] [PubMed] [Google Scholar]
- 8.Perez A, Noy A, Lankas F, Luque FJ, Orozco M. The relative flexibility of B-DNA and A-RNA duplexes: database analysis. Nucleic Acids Res. 2004;32:6144–6151. doi: 10.1093/nar/gkh954. [DOI] [PMC free article] [PubMed] [Google Scholar]
- 9.Watson JD, Crick FH. Molecular structure of nucleic acids; a structure for deoxyribose nucleic acid. Nature. 1953;171:737–738. doi: 10.1038/171737a0. [DOI] [PubMed] [Google Scholar]
- 10.Wilkins MH, Stokes AR, Wilson HR. Molecular structure of deoxypentose nucleic acids. Nature. 1953;171:738–740. doi: 10.1038/171738a0. [DOI] [PubMed] [Google Scholar]
- 11.Klug A. The discovery of the DNA double helix. J. Mol. Biol. 2004;335:3–26. doi: 10.1016/j.jmb.2003.11.015. [DOI] [PubMed] [Google Scholar]
- 12.Franklin RE, Gosling RG. Evidence for 2-chain helix in crystalline structure of sodium deoxyribonucleate. Nature. 1953;172:156–157. doi: 10.1038/172156a0. [DOI] [PubMed] [Google Scholar]
- 13.Jones S, van Heyningen P, Berman HM, Thornton JM. Protein-DNA interactions: a structural analysis. J. Mol. Biol. 1999;287:877–896. doi: 10.1006/jmbi.1999.2659. [DOI] [PubMed] [Google Scholar]
- 14.Lu XJ, Shakked Z, Olson WK. A-form conformational motifs in ligand-bound DNA structures. J. Mol. Biol. 2000;300:819–840. doi: 10.1006/jmbi.2000.3690. [DOI] [PubMed] [Google Scholar]
- 15.Cheetham GM, Steitz TA. Structure of a transcribing T7 RNA polymerase initiation complex. Science. 1999;286:2305–2309. doi: 10.1126/science.286.5448.2305. [DOI] [PubMed] [Google Scholar]
- 16.Ng HL, Kopka ML, Dickerson RE. The structure of a stable intermediate in the A <–>B DNA helix transition. Proc. Natl. Acad. Sci. U.S.A. 2000;97:2035–2039. doi: 10.1073/pnas.040571197. [DOI] [PMC free article] [PubMed] [Google Scholar]
- 17.Ivanov VI, Minchenkova LE, Minyat EE, Frank-Kamenetskii MD, Schyolkina AK. The B to A transition of DNA in solution. J. Mol. Biol. 1974;87:817–833. doi: 10.1016/0022-2836(74)90086-2. [DOI] [PubMed] [Google Scholar]
- 18.Basham B, Schroth GP, Ho PS. An A-DNA triplet code: thermodynamic rules for predicting A- and B-DNA. Proc. Natl. Acad. Sci. U.S.A. 1995;92:6464–6468. doi: 10.1073/pnas.92.14.6464. [DOI] [PMC free article] [PubMed] [Google Scholar]
- 19.Srinivasan J, Cheatham TE, Cieplak P, Kollman PA, Case DA. Continuum solvent studies of the stability of DNA, RNA, and phosphoramidate-DNA helices. J. Am. Chem. Soc. 1998;120:9401–9409. [Google Scholar]
- 20.Cheatham TE, Crowley MF, Fox T, Kollman PA. A molecular level picture of the stabilization of A-DNA in mixed ethanol-water solutions. Proc. Natl. Acad. Sci. U.S.A. 1997;94:9626–9630. doi: 10.1073/pnas.94.18.9626. [DOI] [PMC free article] [PubMed] [Google Scholar]
- 21.McConnell KJ, Beveridge DL. DNA structure: what's in charge? J. Mol. Biol. 2000;304:803–820. doi: 10.1006/jmbi.2000.4167. [DOI] [PubMed] [Google Scholar]
- 22.Sprous D, Young MA, Beveridge DL. Molecular dynamics studies of the conformational preferences of a DNA double helix in water and an ethanol/water mixture: theoretical considerations of the A double left right arrow B transition. J. Phy. Chem. B. 1998;102:4658–4667. [Google Scholar]
- 23.Cheatham TE, Kollman PA. Observation of the A-DNA to B-DNA transition during unrestrained molecular dynamics in aqueous solution. J. Mol. Biol. 1996;259:434–444. doi: 10.1006/jmbi.1996.0330. [DOI] [PubMed] [Google Scholar]
- 24.Soliva R, Luque FJ, Alhambra C, Orozco M. Role of sugar re-puckering in the transition of A and B forms of DNA in solution. A molecular dynamics study. J. Biomol. Struct. Dyn. 1999;17:89–99. doi: 10.1080/07391102.1999.10508343. [DOI] [PubMed] [Google Scholar]
- 25.Banavali NK, Roux B. Free energy landscape of A-DNA to B-DNA conversion in aqueous solution. J. Am. Chem. Soc. 2005;127:6866–6876. doi: 10.1021/ja050482k. [DOI] [PubMed] [Google Scholar]
- 26.Foloppe N, MacKerell AD. All-atom empirical force field for nucleic acids: I. Parameter optimization based on small molecule and condensed phase macromolecular target data. J. Com. Chem. 2000;21:86–104. [Google Scholar]
- 27.MacKerell AD, Banavali NK. All-atom empirical force field for nucleic acids: II. Application to molecular dynamics simulations of DNA and RNA in solution. J. Com. Chem. 2000;21:105–120. [Google Scholar]
- 28.Pastor N. The B- to A-DNA transition and the reorganization of solvent at the DNA surface. Biophys. J. 2005;88:3262–3275. doi: 10.1529/biophysj.104.058339. [DOI] [PMC free article] [PubMed] [Google Scholar]
- 29.Schlitter J, Engels M, Kruger P, Jacoby E, Wollmer A. Targeted molecular-dynamics simulation of conformational change—application to the T[–]R transition in insulin. Mol. Sim. 1993;10:291–297. [Google Scholar]
- 30.Schlitter J, Engels M, Kruger P. Targeted molecular dynamics: a new approach for searching pathways of conformational transitions. J. Mol. Graph. 1990;12:84–90. doi: 10.1016/0263-7855(94)80072-3. [DOI] [PubMed] [Google Scholar]
- 31.Ma J, Karplus M. Molecular switch in signal transduction: reaction paths of the conformational changes in ras p21. Proc. Natl. Acad. Sci. U.S.A. 1997;94:11905–11910. doi: 10.1073/pnas.94.22.11905. [DOI] [PMC free article] [PubMed] [Google Scholar]
- 32.Kumar S, Rosenberg JM, Bouzida D, Swendsen RH, Kollman PA. Multidimensional free-energy calculations using the weighted histogram analysis method. J. Com. Chem. 1995;16:1339–1350. [Google Scholar]
- 33.Dickerson RE, Ng HL. DNA structure from A to B. Proc. Natl. Acad. Sci. U.S.A. 2001;98:6986–6988. doi: 10.1073/pnas.141238898. [DOI] [PMC free article] [PubMed] [Google Scholar]
- 34.Beveridge DL, Ravishanker G. Molecular-dynamics studies of DNA. Curr. Opin. Struct. Biol. 1994;4:246–255. [Google Scholar]
- 35.Auffinger P, Westhof E. Simulations of the molecular dynamics of nucleic acids. Curr. Opin. Struct. Biol. 1998;8:227–236. doi: 10.1016/s0959-440x(98)80044-4. [DOI] [PubMed] [Google Scholar]
- 36.Cheatham TE, Kollman PA. Molecular dynamics simulation of nucleic acids. Annu. Rev. Phys. Chem. 2000;51:435–471. doi: 10.1146/annurev.physchem.51.1.435. [DOI] [PubMed] [Google Scholar]
- 37.Cheatham TE, Young MA. Molecular dynamics simulation of nucleic acids: successes, limitations, and promise. Biopolymers. 2000;56:232–256. doi: 10.1002/1097-0282(2000)56:4<232::AID-BIP10037>3.0.CO;2-H. [DOI] [PubMed] [Google Scholar]
- 38.Gelpi JL, Kalko SG, Barril X, Cirera J, de la Cruz X, Luque FJ, Orozco M. Classical molecular interaction potentials: improved setup procedure in molecular dynamics simulations of proteins. Proteins. 2001;45:428–437. doi: 10.1002/prot.1159. [DOI] [PubMed] [Google Scholar]
- 39.Shields GC, Laughton CA, Orozco M. Molecular dynamics simulations of the d(T center dot A center dot T) triple helix. J. Am. Chem. Soc. 1997;119:7463–7469. [Google Scholar]
- 40.Soliva R, Laughton CA, Luque FJ, Orozco M. Molecular dynamics simulations in aqueous solution of triple helices containing d(G center dot C center dot C) trios. J. Am. Chem. Soc. 1998;120:11226–11233. [Google Scholar]
- 41.Shields GC, Laughton CA, Orozco M. Molecular dynamics simulation of a PNA center dot DNA center dot PNA triple helix in aqueous solution. J. Am. Chem. Soc. 1998;120:5895–5904. [Google Scholar]
- 42.Perez A, Blas JR, Rueda M, Lopez-Bes JM, de la Cruz X, Orozco M. Exploring the essential dynamics of B-DNA. J. Chem. Theor. Comp. 2005;1:790–800. doi: 10.1021/ct050051s. [DOI] [PubMed] [Google Scholar]
- 43.Sherer EC, Harris SA, Soliva R, Orozco M, Laughton CA. Molecular dynamics studies of DNA A-tract structure and flexibility. J. Am. Chem. Soc. 1999;121:5981–5991. [Google Scholar]
- 44.Jorgensen WL. 2000. BOSS 3.4 computer program.
- 45.Case DA, Darden TE, Cheatham TE, Simmerling CL, Wang J, Duke RE, Luo R, Merz KM, Wang B, et al. AMBER8. San Francisco: University of California; 2004. [Google Scholar]
- 46.Darden T, York D, Pedersen L. Particle Mesh Ewald—an N.Log(N) method for Ewald sums in large systems. J. Chem. Phys. 1993;98:10089–10092. [Google Scholar]
- 47.Cornell WD, Cieplak P, Bayly CI, Gould IR, Merz KM, Ferguson DM, Spellmeyer DC, Fox T, Caldwell JW, Kollman PA. A 2nd generation force-field for the simulation of proteins, nucleic-acids, and organic-molecules. J. Am. Chem. Soc. 1995;117:5179–5197. [Google Scholar]
- 48.Cheatham TE, Cieplak P, Kollman PA. A modified version of the Cornell et al. force field with improved sugar pucker phases and helical repeat. J. Biomol. Struct. Dynam. 1999;16:845–862. doi: 10.1080/07391102.1999.10508297. [DOI] [PubMed] [Google Scholar]
- 49.Jorgensen WL, Chandrasekhar J, Madura JD, Impey RW, Klein ML. Comparison of simple potential functions for simulating liquid water. J. Chem. Phys. 1983;79:926–935. [Google Scholar]
- 50.Kaminski GA, Friesner RA, Tirado-Rives J, Jorgensen WL. Evaluation and reparametrization of the OPLS-AA force field for proteins via comparison with accurate quantum chemical calculations on peptides. J. Phys. Chem. B. 2001;105:6474–6487. [Google Scholar]
- 51.Ryckaert JP, Ciccotti G, Berendsen HJC. Numerical-integration of Cartesian equations of motion of a system with constraints—molecular-dynamics of N-alkanes. J. Comp. Phys. 1977;23:327–341. [Google Scholar]
- 52.Lu XJ, Olson WK. 3DNA: a software package for the analysis, rebuilding and visualization of three-dimensional nucleic acid structures. Nucleic Acids Res. 2003;31:5108–5121. doi: 10.1093/nar/gkg680. [DOI] [PMC free article] [PubMed] [Google Scholar]
- 53.Tolstorukov MY, Ivanov VI, Malenkov GG, Jernigan R, Zhurkin VB. Sequence dependent B⇔A transitions in DNA evaluated with dimeric and trimeric scales. Biophys. J. 2001;81:3409–3421. doi: 10.1016/S0006-3495(01)75973-5. [DOI] [PMC free article] [PubMed] [Google Scholar]
- 54.Jose D, Porschke D. Dynamics of the B-A transition of DNA double helices. Nucleic Acids Res. 2004;32:2251–2258. doi: 10.1093/nar/gkh551. [DOI] [PMC free article] [PubMed] [Google Scholar]
- 55.Jose D, Porschke D. The dynamics of the B-A transition of natural DNA double helices. J. Am. Chem. Soc. 2005;127:16120–16128. doi: 10.1021/ja053691d. [DOI] [PubMed] [Google Scholar]
- 56.Jayaram B, Sprous D, Young MA, Beveridge DL. Free energy analysis of the conformational preferences of A and B forms of DNA in solution. J. Am. Chem. Soc. 1998;120:10629–10633. [Google Scholar]
Associated Data
This section collects any data citations, data availability statements, or supplementary materials included in this article.


