


Abstract
In site-directed spin labeling (SDSL), a nitroxide moiety containing a stable, unpaired electron is covalently attached to a specific site within a macromolecule, and structural and dynamic information at the labeling site is obtained via electron paramagnetic resonance (EPR) spectroscopy. Successful SDSL requires efficient site-specific incorporation of nitroxides. Work reported here presents a new method for facile nitroxide labeling at the 5′ terminus of nucleic acids of arbitrary sizes. T4-polynucleotide kinase was used to enzymatically substitute a phosphorothioate group at the 5′ terminus of a nucleic acid, and the resulting phosphorothioate was then reacted with an iodomethyl derivative of a nitroxide. The method was successfully demonstrated on both chemically synthesized and naturally occurring nucleic acids. The attached nitroxides reported duplex formation as well as tertiary folding of nucleic acids, indicating that they serve as a valid probe in nucleic acid studies.
INTRODUCTION
In site-directed spin labeling (SDSL), a nitroxide containing a stable, unpaired electron is attached to a specific site within a macromolecule (1). This yields a simple electron spin system that allows for a range of problem-targeted studies. Information on the local environment at the labeled site is derived by analyzing the electron paramagnetic resonance (EPR) spectrum of the nitroxide. SDSL has matured as a structural tool in protein studies, and has been remarkably successful in tackling systems that are difficult to study using methods such as X-ray crystallography and NMR spectroscopy (1–7). In SDSL studies of nucleic acids, structural and dynamic information at the level of an individual nucleotide can be obtained via analyzing the EPR spectrum of a singly labeled nitroxide (see recent review (8)). Recent studies also reported distance measurements ranging from 5 to 70 Å between a pair of nitroxides attached to DNA (9,10) and RNA (11–14). The ability of SDSL to measure nanometer distances renders it an attractive tool for global structural mapping of nucleic acids.
The key step in SDSL is attaching the nitroxide probe to a specific site of the biomolecule under investigation. This is achieved by placing a reactive functional group, such as a thiol or an amino group, at the intended labeling site, followed by a reaction with a nitroxide derivative (1,8). In proteins, generally the amino acid at the intended labeling site is mutated to cysteine, which provides a reactive thiol for nitroxide attachment (1). Because normal nucleic acid functional groups are not reactive under physiological conditions, reactive thiol or amino groups have to be introduced exogenously in the form of modified nucleotides. Currently, solid phase chemical synthesis is the method of choice for placing the modified nucleotide at a specific internal location within a strand of DNA or RNA. Methods have been reported to attach nitroxides at specific backbone (15), sugar (14,16) and base (12,17–21) positions of modified nucleotides introduced via chemical synthesis. The limitation of these methods is the size restrictions posted by chemical synthesis (∼100 nucleotide (nt) long for DNA, and ∼50 nt for RNA).
Methods have also been reported for attaching nitroxides to RNA terminus (11,22). Shin and co-workers have reported a method for attaching nitroxides to the 5′ terminus of a RNA synthesized by the T7 RNA polymerase (11). In this method, a modified nucleotide, guanosine 5′-O-(3-thiomonophosphate) (GMPS), is added together with the unmodified nucleoside triphosphates (NTPs). T7 RNA polymerase will utilize GTP or GMPS at the 5′ terminus of the RNA transcript, but will incorporate GTP at the subsequent internal positions. With a large excess of GMPS to GTP (3:1), a majority of the RNA transcripts will possess a 5′ phosphorothioate instead of a 5′ triphosphate, and the phosphorothioate group can be subsequently reacted with a thiol-reactive nitroxide derivative. The modified transcription method is restricted to RNAs that can be transcribed in vitro. The labeling yield depends on the fraction of RNA transcripts containing the 5′-phosphorothioate, which cannot be 100% due to the limit imposed by GMPS to GTP ratio. For labeling at 3′ terminus, there was a report on tRNA (22), which utilizes periodate to oxidize the 3′-ribose, followed by subsequent nitroxide attachment. However, this method cannot be applied directly to DNA.
Work reported here presents a new approach to attach nitroxides at the 5′-terminus of DNA and RNA molecules. This method, which was named the 5ps labeling scheme (Scheme 1), utilizes T4 polynucleotide kinase (PNK) to transfer the γ-phosphorothioate group of adenosine-5′-O-(3-thiotriphosphate) (ATPγS) to the 5′ terminus of DNA or RNA. Following in situ reaction with an iodomethyl derivative of nitroxide, a stable nitroxide-nucleic acid adduct was formed. The labeling method is applicable to DNA and RNA molecules that are either chemically synthesized or obtained from cellular sources. The resulting covalently linked nitroxides were able to report the structural state of the parent molecule. These results demonstrate a novel, facile method for attaching nitroxides to the 5′-terminus of arbitrary nucleic acids. In principle, the 5ps method is applicable to other external probes such as fluorophores and photocrosslinkers. This will aid in a wide range of biophysical and biochemical studies of nucleic acids and protein/nucleic acid complexes.
Scheme 1.

MATERIALS AND METHODS
Preparation of nucleic acid samples
The model DNA, designated as DNA1, is 13-nt and has a sequence of 5′ CTCAAGGCAAGCT. The model RNA, designated as RNA1, is 16-nt and has a sequence of 5′ rCrGrGrUrArCrUrUrUrUrGrUrGrUrGrG. Both DNA1 and RNA1 contain a 5′-hydroxyl group and were obtained via solid-phase chemical synthesis (Integrated DNA Technology, Coralville, IA). DNA1 was used in subsequent reactions without further purification. RNA1 was purified using anion-exchange HPLC (10).
The phenylalanine-specific transfer RNA (tRNAphe) from Brewer's yeast (Sigma-Aldrich, St. Louis, MO) was used as a model of a large and naturally occurring RNA. Prior to the reactions, the 5′ phosphate group of tRNAphe was removed using calf intestinal alkaline phosphatase (CIAP) following a procedure previously described (23). For a large-scale reaction (∼200–400 picomoles), the reaction mixture (400 μl) contained 0.025 unit of CIAP per picomole of nucleic acid in a 1× CIAP buffer (50 mM Tris–HCl, pH 9.3, 1 mM MgCl2, 0.1 mM ZnCl2 and 1 mM spermidine). After incubation at 37°C for 30 min, another 0.025 unit of CIAP per picomole of nucleic acids was added, and incubation was continued for another 30 min. The mixture was then subjected to phenol extraction to remove the proteins, and the nucleic acids were recovered using ethanol precipitation.
Nucleic acid concentrations were determined according to absorbance at 260 nm. The extinction coefficients used for DNA1, RNA1 and tRNAphe were 123 600, 155 800 and 760 000 M−1 cm−1, respectively.
Kinasing with ATPγS
To covalently attach a 5′-phosphorothioate group, DNA or RNA containing a 5′-hydroxyl terminus was treated with T4 polynucleotide kinase (PNK, New England Biolabs, Ipswich, MA) in the presence of ATPγS (VWR, USA). A typical reaction mixture (50 μl) contained 1× PNK buffer (70 mM Tris–HCl pH 7.6, 10 mM MgCl2 and 5 mM dithiothreitol), 10–100 μM nucleic acid, a 5:1 molar ratio of ATPγS to nucleic acids, and 10 units of PNK per nanomole of nucleic acids. Reactions were carried out at 37°C overnight.
In situ attachment of nitroxides to nucleic acids containing a 5′- phosphorothioate
Immediately following ATPγS kinasing reaction, the solution was diluted 4-fold with a buffer containing 100 mM sodium phosphate (pH 8.0) and 20% acetonitrile (v/v). This mixture was reacted with a thiol-reactive nitroxide derivative, 3-iodomethyl-1-oxyl-2,2,5,5-tetramethyloyrroline (100–200 mM), which was freshly prepared as described (10,15). The reaction was allowed to proceed at room temperature in the dark, with reaction times ranging from 3 to 48 h.
To remove the excess nitroxide from the short DNA1 and RNA1 oligonucleotides, the reaction mixtures were first subjected to anion-exchange HPLC using a PA-100 column (4 × 250 mm2, Dionex Inc., Sunnyville, CA) (10,15). Nucleic acids were eluted using a low salt stationary phase (buffer A: 1 mM NaClO4, 20 mM Tris–HCl, pH 6.8 and 20% v/v acetonitrile) and a high salt mobile phase (buffer B: 400 mM NaClO4, 20 mM Tris–HCl, pH 6.8 and 20% v/v acetonitrile). Samples were detected via absorbance at 260 nm. The HPLC fractions were then desalted using a G-25 Sephadex column (22.5 × 1.2 cm) with water as the running media. The desalted samples were lyophilized and stored at −20°C.
For tRNAphe labeling, the reaction mixture containing the nitroxide labeled tRNAphe (R-tRNAphe) was purified using a 6% denaturing acrylamide gel. The appropriate R-tRNAphe band was cut and eluted in 10 mM MOPS, pH 6.5 and 5 mM EDTA for 2 h. A subsequent ethanol precipitation was carried out to remove the remaining trace of unattached nitroxides and to recover R-tRNAphe.
MALDI-TOF mass spectrometry
Desalted nucleic acid samples (∼2.0 μM in 5 mM sodium phosphate buffer, pH 8) were mixed with a matrix solution (8:1 ratio of 3-hydroxypicolinic acid/diammonium citrate) in a 1:2 ratio. Droplets of the sample mixture (∼1.50 μl) were spotted onto a sample plate and air-dried. Spectra were acquired on a Voyager-DE STR system (Applied Biosystems, Foster City, CA) in the range of 500–10 000 Dalton (Da).
Continuous-wave EPR spectroscopy
X-band EPR spectra were acquired on a Bruker EMX system following procedures previously described (24). Briefly, samples of 5 μl were loaded into 0.84 mm O.D. capillaries (VitroCom Inc., Mountain Lakes, NJ) that were sealed on one end. All spectra were acquired at room temperature using a 2 mW incident microwave power and a 100 Gauss scan width. The 100 kHz field modulation amplitude and time constant of the detector were optimized to provide maximum signal to noise ratio with no line broadening. For each sample, individual spectra from multiple scans were averaged, and the resulting spectrum was corrected for baseline and normalized with respect to the total number of spins.
RESULTS
Enzymatic conversion of a 5′-hydroxyl to a 5′-phosphorothioate in nucleic acids
The first key step in the 5ps labeling scheme is to attach a phosphorothioate group to the 5′ terminus of a DNA or RNA. This was achieved by ‘hijacking’ a commonly practiced kinasing reaction, where the γ-phosphate group of ATP is transferred to the 5′-terminus of DNA or RNA by the T4 polynucleotide kinase (PNK). If one substitutes ATPγS that contains a γ-phosphorothioate group for the ATP, the γ-phosphorothioate group will be transferred to the DNA or RNA, thus creating a reactive functional group for further derivatization.
To test whether T4 PNK accepts ATPγS as a substrate, the chemically synthesized DNA1 oligonucleotide, which contains a 5′-hydroxyl group, was kinased in the presence of either ATP or ATPγS. The reaction mixtures were analyzed by anion-exchange HPLC using a column that discriminates against charge as well as polarity. The product from ATP kinasing, p-DNA1, eluted later than the original DNA1 oligonucleotide (Figure 1A), which is consistent with the increased negative charge upon converting the 5′-hydroxyl to the 5′-phosphate. When the reaction mixture from the ATPγS kinasing was analyzed, the product eluted later than p-DNA1 (Figure 1A). This difference in the elution profiles can be accounted for by the fact that a 5′-phosphorothioate group has the same (–2) charge as that of a 5′-phosphate group but has a different polarity. This indicates successful production of the ps-DNA1 that contains a 5′-phosphorothioate.
Figure 1.

(A) Anion-exchange HPLC analysis of DNA1 kinasing reactions. The results were obtained on a PA-100 column with a flow rate of 2.0 ml/min. The elution gradient was 0–12% buffer B in 2 min, followed by 12–23% buffer B in 11 min. (B) Anion-exchange HPLC analysis of nitroxide labeling for DNA1. The HPLC traces were obtained under conditions described in (A). (C) A representative MALDI-TOF mass spectrum of R-DNA1. This example shows a measured mass of 4192.6 Da.
The identity of the ps-DNA1 was further confirmed by MALDI-TOF mass spectrometry. The measured average mass of ps-DNA1 was determined to be 4038.1 ± 1.1 Da based on multiple measurements (data not shown). This is consistent with the expected mass of 4037.6 Da for the corresponding sequence with a 5′ phosphorothioate. Based on the area under the curve corresponding to the respective species in the HPLC elution profile, close to 100% of DNA1 was converted to ps-DNA1 (Figure 1A). Experiments on synthetic RNA oligonucleotides also demonstrated efficient 5′-phosphorothioate attachment (vide infra).
Attaching a nitroxide group to ps-DNA1
To demonstrate nitroxide attachment at the 5′-phosphorothioate, ps-DNA1 was reacted with a nitroxide derivative, which is designated as R (Scheme 1). In initial experiments, attempts were made to purify ps-DNA1 from the excess ATPγS that is present in the kinasing reaction. However, during the purification process, the 5′-phosphorothioate group is hydrolyzed and converted to a 5′-phosphate (data not shown), resulting in a loss of reactive moiety and preventing subsequent reaction with the nitroxide derivatives.
To overcome the hydrolysis problem, nitroxide attachment was carried out in situ without removing the ATPγS. Excess nitroxide derivatives were added directly to the mixture containing the ps-DNA1, PNK and ATPγS, and the labeling reaction was allowed to proceed at room temperature overnight. When the products were analyzed by anion-exchange HPLC, the major fraction, designated as R-DNA1, was eluted earlier than the ps-DNA1 (Figure 1B). R-DNA1 migrated differently from p-DNA1, and thus, is not the result of hydrolysis. Instead, R-DNA1 is a nitroxide labeled product, which loses one negative charge upon derivatization of the 5′-phosphorothioate group, and therefore migrates faster on an anion-exchange column. Similar phenomena have been previously observed in reactions of R with internal phosphorothioate groups (10,15). Based on the HPLC result (Figure 1B), the nitroxide labeling efficiency is close to 100%. In addition, the average mass of R-DNA1 was determined to be 4192.0 ± 1.8 Da (Figure 1C). This is in excellent agreement with the theoretical value of 4190.8 Da for a nitroxide labeled DNA1.
Continous-wave EPR spectroscopy of R-DNA1
Further proof of successful nitroxide labeling of DNA1 came from X-band EPR spectroscopy (Figure 2). The aqueous spectrum of R-DNA1 showed three sharp peaks with asymmetric amplitude, and is clearly different from that of the free nitroxide, which shows three peaks with equal amplitudes (compare Figure 2A and B). As an independent estimation of the overall efficiency of nitroxide labeling, the total number of spins (nitroxides) was determined by double-integration of the observed R-DNA1 spectrum. The corresponding DNA concentration was determined by UV-Vis absorption measurements. In the measurement, the spin concentration was determined to be 8.7 μM, and the corresponding DNA concentration was 10.5 μM. This yielded an 83% overall nitroxide labeling efficiency. We note that spin counting requires double integration of the EPR spectrum that is very sensitive to the baseline, and the number of spins determined has a certain degree of uncertainty. The 83% labeling efficiency determined via spin counting is consistent with the HPLC data (Figure 1B).
Figure 2.

EPR analysis of DNA1 labeling. Single scan EPR spectra are shown for (A) the free nitroxide, R; (B) R-DNA1; and (C) R-DNA1 bound to its complementary strand. All spectra were obtained in 100 mM NaCl and 50 mM sodium phosphate buffer, pH 8. The DNA sample concentrations were 10.5 μM.
The R-DNA1 spectrum is characteristic of a nitroxide undergoing fast, isotropic rotation (Figure 2B). In this motional regime, the effective rotational correlation time, τ, of the nitroxide can be estimated as (15,25):
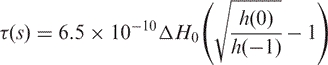 |
1 |
where ΔH0 is the peak-to-peak linewidth of the central line in Gauss, and h(0) and h(−1) are the peak-to-peak amplitudes of the central and high field lines, respectively. For the single-stranded R-DNA1 (Figure 2B), the calculation yielded a τss-DNA1 of 0.19 ns for the labeled nitroxide. This short τss-DNA1 is due to the fast tumbling of the relatively small DNA1 molecule (4.2 kDa), the conformational flexibility of the single stranded DNA, and the flexible nature of the bonds connecting the nitroxide to the DNA.
One would expect spectral changes upon formation of DNA duplex, which increases the size of the molecule and reduces the overall tumbling rate. This was indeed the case. Upon addition of a DNA that complements the DNA1 sequence, line broadening was observed in the resulting EPR spectrum (Figure 2C), and a τds-DNA1 (for double-stranded DNA) of 0.61 ns was measured. Both the line broadening and the increase in τ indicate reduction in nitroxide motion. The change in the observed nitroxide motion reports slower uniform tumbling of the DNA duplex, as well as possible reduction in the motions of individual DNA nucleotide upon base pairing. The data indicate that the nitroxide attached via the 5ps scheme is capable of reporting duplex formation in DNA.
Nitroxide labeling of a chemically synthesized RNA
The labeling scheme described above does not distinguish a deoxyribonucleotide vs. a ribonucleotide, and should be equally applicable to RNA molecules. To demonstrate this, the scheme was first applied to a chemically synthesized RNA, designated as RNA1. Following the procedures described for DNA modification and labeling, a phosphorothioate group was incorporated at the 5′ terminus of purified RNA1, and in situ nitroxide labeling was carried out. Anion-exchange HPLC showed that ps-RNA1, which is the product of ATPγS kinasing, eluted later than RNA1 (Figure 3A). The nitroxide labeled product, R-RNA1, eluted earlier than that of ps-RNA1 (Figure 3B). This indicates successful nitroxide labeling. The HPLC data again indicate ∼100% efficiency in the overall nitroxide labeling (Figure 3B). Mass spectrometry yielded an average mass of 5338.7 ± 0.3 Da for R-RNA1 (Supplemental Figure S1), which is very close to the expected value of 5339.2 Da. We also note that purifying the RNA before applying the 5ps scheme is not required, as the method is also demonstrated on a crude, chemically synthesized RNA (Supplemental Figure S2).
Figure 3.

Chemically synthesized RNA1 labeled using the 5ps method. (A) Anion-exchange HPLC analysis of RNA1 kinasing reactions. The HPLC conditions are the same as that of Figure 1A, except that the elution gradient was 0–13% buffer B in 2 min, followed by 13–22% buffer B in 40 min. The elution profile from 1 to 5 min is omitted as it contains large interference signal from small molecules such as ATPγS and excess unreacted nitroxide. (B) Anion-exchange HPLC analysis of nitroxide labeling for RNA1. The results were obtained under conditions described in Figure 3A. (C) EPR spectrum of R-RNA1 in H2O. The RNA1 concentration was 14.1 μM, and the spectrum shown was an average of 39 scans. (D) EPR spectrum of R-RNA1 bound to its complementary strand. The RNA1 concentration was 11.0 μM. The spectrum was obtained as described in Figure 3C, except that the sample was dissolved in 50 mM sodium phosphate, pH 7.0 and 100 mM NaCl.
The aqueous X-band EPR spectrum of R-RNA1 also shows three asymmetric peaks that indicate that the nitroxide is undergoing fast, isotropic rotation (Figure 3C). The τss-RNA1 was estimated to be 0.45 ns. Based on a measurement of the spin concentration vs. the RNA concentration (14.1 μM vs. 15.7 μM), the nitroxide labeling efficiency is 90%. Upon duplex formation of R-RNA1 with its complementary strand (Figure 3D), line broadening of the EPR spectrum was observed, and a τds-RNA1 of 0.65 ns was obtained. This indicates reduced nitroxide motion upon RNA duplex formation. We note that τss-RNA1 is different from τss-DNA1, while τds-RNA1 and τds-DNA1 are similar. This may reflect variations of nitroxide motion in single-stranded oligonucleotides that have little defined structures.
Minor peaks are observed in the HPLC traces of ps-RNA1 and R-RNA1 (Figure 3). These likely represent RNA degradation products. By integrating areas under the respective peaks, it is estimated that the minor peaks account for 36% of the total population in the R-RNA1 trace (Figure 3B). This represents degradations that occurred in both the kinasing and the nitroxide labeling steps. Most of the degradation occurred in the kinasing step (26% from the ps-RNA1 trace, Figure 3A), where the RNA is subjected to overnight incubation at 37 °C in the presence of MgCl2.
Nitroxide labeling on a naturally occurring tRNAphe
After the 5ps labeling method was successfully demonstrated on a chemically synthesized RNA, it was applied to a naturally occurring RNA, the tRNAphe (Figure 4A). As the tRNAphe is 76-nt long and contains a large number of modified nucleotides (26) (Figure 4A), it cannot be spin labeled at the 5′-terminus using any method reported previously, and serves as a good example to demonstrate the unique power of the 5ps labeling method.
Figure 4.

Naturally occurring tRNAphe labeled using the 5ps method. (A) Secondary structure of tRNAphe from brewer's yeast. Modified bases are denoted as following: m1A, 1-methyladenosine; m7G, N7-methylguanosine; m5C, 5-methylcytidine; Cm, 2′-o-methylcytidine; Gm, 2′-o-methylguanosine; T, ribothymidine; Y, unidentified nucleoside;  , N2-dimethylguanosine; m2G, N2-methylguanosine; and ψ, pseudouridine. (B) EPR spectrum of R-tRNAphe in H2O. The spectrum was an average of 200 scans, and the tRNAphe concentration was 21.7 μM. A highly mobile component, which accounts for 7.5% of the total population and likely represents unattached nitroxides, has been subtracted (Supplemental Figure S4). (C) EPR spectrum of R-tRNAphe in 50 mM sodium phosphate pH 7.0 and 5 mM MgCl2. The spectrum was an average of 200 scans, and the tRNAphe concentration was 17.4 μM. A highly mobile component, which accounts for 3.8% of the total population and represents unattached nitroxides, has been subtracted (Supplemental Figure S4).
In the experiment, the naturally present 5′ phosphate group on tRNAphe was first removed. The dephosphorylated tRNAphe was then subjected to ATPγS kinasing, followed by in situ coupling with the thiol reactive nitroxide derivative (see Methods). The labeled tRNAphe (R-tRNAphe) was purified via denaturing gel electrophoresis. Based on results from the gels, >75% of the tRNAphe remains intact after kinasing and nitroxide labeling (Supplemental Figure S3). The degree of tRNAphe degradation is 18–25%, which is similar to that of the small synthetic RNA1 (vide supra). Overall, the data indicate that the 5ps method preserves the integrity of the parent RNA molecule.
Figure 4B shows the aqueous EPR spectrum of the gel purified R-tRNAphe obtained in the absence of added salt, which represents the unfolded state of tRNAphe. Compared to the spectra of short synthetic oligonucleotides (Figures 2B and 3C), the tRNAphe spectrum has broader centerline and much smaller amplitude for the high-field peak (Figure 4B). This reflects reduced nitroxide mobility, and is consistent with a nitroxide attached to the high molecular weight tRNAphe (∼23 kDa). Control experiments showed no EPR signal if the ATPγS kinasing step is omitted. This negates the possibility of the nitroxide reacting with the modified nucleotides present in tRNAphe, or that the nitroxide simply binds non-covalently to the tRNAphe.
Upon addition of 5 mM MgCl2, tRNA tertiary folding occurs, and clear changes in the R-tRNAphe spectrum were observed (Figure 4B, ‘folded tRNAphe’): the centerline was further broadened, and extra features were observed at both the low-field and high-field regions (indicated by arrows in Figure 4B). These report a drastic decrease in nitroxide mobility. The presence of 5 mM Mg2+ favors the formation of the helical stem at the 5′/3′ terminus, as well as tertiary folding of tRNAphe. The nitroxide spectral changes reports the change in the local conformation at the 5′-terminus of tRNAphe upon its folding.
Unlike the small synthetic RNA oligonucleotides, it is difficult to estimate the tRNAphe labeling efficiency. R-tRNAphe and tRNAphe are difficult to distinguish using chromatography or gel electrophoresis methods. Spin counting is problematic, as double integration of the R-tRNAphe spectrum, which is in a different motional regime than that of the small molecule standard, suffers severe baseline interference. Nonetheless, data presented above indicate that a nitroxide is successfully attached to tRNAphe, and the label can report tRNAphe folding.
DISCUSSION
The data presented above demonstrated a facile 5ps labeling method that allows efficient attachment of a nitroxide probe at the 5′ terminus of nucleic acids. The 5ps method is applicable to both chemically synthesized and naturally occurring DNA and RNA, and is not limited by the size of the target molecule. The resulting nitroxide tag provides an informative probe for the growing field of nucleic acid SDSL, where information at the level of individual nucleotide can be derived via analysis of nitroxide dynamics as well as quantitative distance measurements.
A major advantage of the 5ps labeling method is its applicability to naturally occurring nucleic acid species, as demonstrated by the results on the tRNAphe (Figure 4). These naturally occurring species may include a large number of modifications that are essential for their function (Figure 4A). These modifications are introduced via complex cellular machineries, and are extremely difficult, if not impossible, to synthesize using solid phase chemical synthesis or via simplified enzymatic methods such as in vitro RNA transcriptions. For these reasons, the 5ps labeling method is the only available means to attach a nitroxide at the 5′ terminus of these naturally occurring nucleic acid molecules. Compared to a previously reported method that utilizes periodate oxidation to attach nitroxides to the 3′-terminus of tRNA (22), the 5ps method is application to both RNA and DNA, and thus is applicable to a wide array of important systems, such as methylated DNA (27), ribosomal RNA (28), spliceosomal RNA (29) and non-coding RNA (30).
Another advantage of the 5ps method is that it does not have a limitation regarding the size of the target molecule. In most of the other labeling schemes, the target molecule needs to be produced via solid phase chemical synthesis. For molecules as large as the tRNAphe, solid phase chemical synthesis remains to be challenging and costly. Even for smaller molecules that are easy to synthesize chemically, the 5ps method provides an attractive labeling approach, as it is carried out post-synthetically and provides a high degree of flexibility in the execution of the experiments.
A limitation in the 5ps method is that the label is restricted to only one position—the 5′ terminus. Methods have been reported, such as circular permutation (31), which allow one to engineer the system so that the terminus is positioned near the site of interests without diminishing function. This can be combined with the 5ps method to ‘walk’ the nitroxide label throughout the molecule. In addition, the 5ps method may not be appropriate for molecules that contain naturally occurring thiol groups (e.g. thiouridines). For such molecules, nitroxides can be directly attached to the naturally occurring thiol groups.
The key step in the 5ps labeling method is to introduce the reactive 5′-phosphorothioate group. This is achieved via the T4 polynucleotide kinase, which is a workhorse in modern molecular biology. A single atom change between ATPγS and ATP only marginally affected the function of T4 PNK, and γ-phosphorothioate group can be transferred with high efficiency. Along this line of reasoning, one might wonder whether a nitroxide derivatized ATPγS might also be taken up as a substrate by T4 PNK? This was indeed tested during the development of the 5ps method, but unfortunately the answer is no. While ATPγS was coupled successfully with the iodomethly derivative of nitroxide, the purified nitroxide/ATPγS showed no reactivity when used as the substrate in the kinase reaction (data not shown).
Studies reported here utilized an iodomethyl-derivative of the nitroxide to react with the 5′-phoshporothioate group. Other thiol-reactive nitroxide derivatives, such as methanethiosulfonate (11) and iodoacetamide (32), should also be compatible. Furthermore, in principle the 5ps labeling scheme is not limited to nitroxide probes, but is applicable to other probes, such as fluorophores and photocrosslinkers. It provides a general approach for site-specific attachment of external probes in nucleic acids.
SUPPLEMENTARY DATA
Supplementary Data are available at NAR Online.
ACKNOWLEDGEMENTS
The authors would like to thank Qi Cai, Anna Popova and Dr. Glenna Sowa for critical reading of the manuscript. The Open Access publication charges for this article were waived by Oxford University Press.
Conflict of interest statement. None declared.
REFERENCES
- 1.Hubbell WL, Altenbach C. Investigation of structure and dynamics in membrane proteins using site-directed spin labeling. Curr. Opin. Struct. Biol. 1994;4:566–573. [Google Scholar]
- 2.Feix JB, Klug CS. In: Biological Magnetic Resonance. Berliner LJ, editor. Vol. 14. New York, NY: Plenum Press; 1998. pp. 251–281. [Google Scholar]
- 3.Fajer PG. In: Encyclopedia of Analytical Chemistry. Meyers R, editor. Chichester: John Wiley & Sons; 2000. pp. 5725–5761. [Google Scholar]
- 4.Hubbell WL, Cafiso DS, Altenbach C. Identifying conformational changes with site-directed spin labeling. Nat. Struct. Biol. 2000;7:735–739. doi: 10.1038/78956. [DOI] [PubMed] [Google Scholar]
- 5.Borbat PP, Costa-Filho AJ, Earle KA, Moscicki JK, Freed JH. Electron spin resonance in studies of membranes and proteins. Science. 2001;291:266–269. doi: 10.1126/science.291.5502.266. [DOI] [PubMed] [Google Scholar]
- 6.Columbus L, Hubbell WL. A new spin on protein dynamics. Trends Biochem. Sci. 2002;27:288–295. doi: 10.1016/s0968-0004(02)02095-9. [DOI] [PubMed] [Google Scholar]
- 7.Fanucci GE, Cafiso DS. Recent Advances and applications of site-directed spin labeling. Curr. Opin. Struct. Biol. 2006;16:644–653. doi: 10.1016/j.sbi.2006.08.008. [DOI] [PubMed] [Google Scholar]
- 8.Qin PZ, Dieckmann T. Application of NMR and EPR methods to the study of RNA. Curr. Opin. Struct. Biol. 2004;14:350–359. doi: 10.1016/j.sbi.2004.04.002. [DOI] [PubMed] [Google Scholar]
- 9.Schiemann O, Piton N, Mu Y, Stock G, Engels JW, Prisner TF. A PELDOR based nanometer distance ruler for oligonucleotides. J. Am. Chem. Soc. 2004;126:5722–5729. doi: 10.1021/ja0393877. [DOI] [PubMed] [Google Scholar]
- 10.Cai Q, Kusnetzow AK, Hubbell WL, Haworth IS, Gacho GP, Van Eps N, Hideg K, Chambers EJ, Qin PZ. Site-directed spin labeling measurements of nanometer distances in nucleic acids using a sequence-independent nitroxide probe. Nucl. Acids Res. 2006;34:4722–4734. doi: 10.1093/nar/gkl546. [DOI] [PMC free article] [PubMed] [Google Scholar]
- 11.Macosko JC, Pio MS, Tinoco I, Jr, Shin Y-K. A novel 5′ displacement spin-labeling technique for electron paramagnetic resonance spectroscopy of RNA. RNA. 1999;5:1158–1166. doi: 10.1017/s1355838299990830. [DOI] [PMC free article] [PubMed] [Google Scholar]
- 12.Schiemann O, Weber A, Edwards TE, Prisner TF, Sigurdsson ST. Nanometer distance measurements on RNA using PELDOR. J. Am. Chem. Soc. 2003;125:3334–3335. doi: 10.1021/ja0274610. [DOI] [PubMed] [Google Scholar]
- 13.Borbat PP, Davis JH, Butcher SE, Freed JH. Measurement of large distances in biomolecules using double-quantum filtered refocused electron spin-echoes. J. Am. Chem. Soc. 2004;126:7746–7747. doi: 10.1021/ja049372o. [DOI] [PubMed] [Google Scholar]
- 14.Kim N, Murali A, DeRose VJ. A distance ruler for RNA using EPR and site-directed spin labeling. Chem. Biol. 2004;11:939–948. doi: 10.1016/j.chembiol.2004.04.013. [DOI] [PubMed] [Google Scholar]
- 15.Qin PZ, Butcher SE, Feigon J, Hubbell WL. Quantitative analysis of the GAAA tetraloop/receptor interaction in solution: a site-directed spin labeling study. Biochemistry. 2001;40:6929–6936. doi: 10.1021/bi010294g. [DOI] [PubMed] [Google Scholar]
- 16.Edwards TE, Okonogi TM, Robinson BH, Sigurdsson ST. Site-specific incorporation of nitroxide spin-labels into internal sites of the TAR RNA. Structure-dependent dynamics of RNA by EPR spectroscopy. J. Am. Chem. Soc. 2001;123:1527–1528. doi: 10.1021/ja005649i. [DOI] [PubMed] [Google Scholar]
- 17.Kao SC, Bobst AM. Local base dynamics and local structural features in RNA and DNA duplexes. Biochemistry. 1985;24:5465–5469. doi: 10.1021/bi00341a028. [DOI] [PubMed] [Google Scholar]
- 18.Spaltenstein A, Robinson BH, Hopkins PB. Sequence- and structure- dependent DNA base dynamics: synthesis, structure, and dynamics of site and sequence specifically spin-labeled DNA. Biochemistry. 1989;28:9484–9495. doi: 10.1021/bi00450a036. [DOI] [PubMed] [Google Scholar]
- 19.Gannett PM, Darian E, Powell J, Johnson EM, Mundoma C, Greenbaum NL, Ramsey CM, Dalal NS, Budil DE. Probing triplex formation by EPR spectroscopy using a newly synthesized spin label for oligonucleotides. Nucleic Acids Res. 2002;30:5328–5337. doi: 10.1093/nar/gkf634. [DOI] [PMC free article] [PubMed] [Google Scholar]
- 20.Qin PZ, Hideg K, Feigon J, Hubbell WL. Monitoring RNA base structure and dynamics using site-directed spin labeling. Biochemistry. 2003;42:6772–6783. doi: 10.1021/bi027222p. [DOI] [PubMed] [Google Scholar]
- 21.Qin PZ, Feigon J, Hubbell WL. Site-directed spin labeling studies reveal solution conformational changes in a GAAA tetraloop receptor upon Mg2+-dependent docking of a GAAA tetraloop. J. Mol. Biol. 2005;351:1–8. doi: 10.1016/j.jmb.2005.06.007. [DOI] [PubMed] [Google Scholar]
- 22.Dugas H, Caron M. Specific spin-labeling of transfer ribonucleic acid molecules. Nucleic Acids Res. 1976;3:19–34. doi: 10.1093/nar/3.1.19. [DOI] [PMC free article] [PubMed] [Google Scholar]
- 23.Fang Y, Cai Q, Qin PZ. The procapsid binding domain of phi29 packaging RNA has a modular architecture and requires 2′-hydroxyl groups in packaging RNA interaction. Biochemistry. 2005;44:9348–9358. doi: 10.1021/bi0475020. [DOI] [PubMed] [Google Scholar]
- 24.Qin PZ, Jennifer I, Oki A. A model system for investigating lineshape/structure correlations in RNA site-directed spin labeling. Biochem. Biophys. Res. Commun. 2006;343:117–124. doi: 10.1016/j.bbrc.2006.02.138. [DOI] [PMC free article] [PubMed] [Google Scholar]
- 25.Knowles PF, Marsh D, Rattle HWE. Magnetic Resonance of Biomolecules. John Wiley & Sons Ltd., New York. 1976. pp. 168–207. [Google Scholar]
- 26.RajBhandary UL, Chang SH, Stuart A, Faulkner RD, Hoskinson RM, Khorana HG. Studies on Polynucleotides, LXVIII. The Primary Structure of Yeast Phenylalanine Transfer RNA. Proc. Natl. Acad. Sci. 1967;57:751–758. doi: 10.1073/pnas.57.3.751. [DOI] [PMC free article] [PubMed] [Google Scholar]
- 27.Klose RJ, Bird AP. Genomic DNA methylation: the mark and its mediators. Trends Biochem. Sci. 2006;31:89–97. doi: 10.1016/j.tibs.2005.12.008. [DOI] [PubMed] [Google Scholar]
- 28.Moore PB, Steitz TA. The ribosome revealed. Trends Biochem. Sci. 2005;30:281–283. doi: 10.1016/j.tibs.2005.04.006. [DOI] [PubMed] [Google Scholar]
- 29.Sharp PA. The discovery of split genes and RNA splicing. Trends Biochem. Sci. 2005;30:279–281. doi: 10.1016/j.tibs.2005.04.002. [DOI] [PubMed] [Google Scholar]
- 30.Mattick JS, Makunin IV. Non-coding RNA. Hum. Mol. Genet. 2006;15:R17–R29. doi: 10.1093/hmg/ddl046. [DOI] [PubMed] [Google Scholar]
- 31.Pan T, Gutell RR, Uhlenbeck OC. Folding of circular permuted tRNAs as specific photoaffinity probes of ribonuclease P RNA structure. Science. 1991;254:1361–1364. [Google Scholar]
- 32.Ramos A, Varani G. A new method to detect long-range protein-RNA contacts: NMR detection of electron-proton relaxation induced by nitroxide spin-labeled RNA. J. Am. Chem. Soc. 1998;120:10992–10993. [Google Scholar]
Associated Data
This section collects any data citations, data availability statements, or supplementary materials included in this article.