

Abstract
MafA is a basic leucine zipper transcription factor that regulates gene expression in both the neuroretina and pancreas. Within the pancreas, MafA is exclusively expressed in the beta cells and is involved in insulin gene transcription, insulin secretion, and beta cell survival. The expression of the mafA gene within beta cells is known to increase in response to high glucose levels by an unknown mechanism. In this study, we demonstrate that pyruvate, which is produced by glycolysis from glucose, is not sufficient to induce mafA gene expression compared with high glucose. This suggests that the signal for MafA induction is independent of ATP levels and that a metabolic event occurring upstream of pyruvate production leads to the induction of MafA. Furthermore, insulin secretion mediated by high glucose is not important for MafA expression. However, the addition of glucosamine to beta cell lines stimulates MafA expression in the absence of high glucose, and inhibition of the hexosamine biosynthetic pathway in the presence of high glucose abolishes MafA induction. Moreover, we demonstrate that the expression of UDP-N-acetylglucosaminyl transferase, the enzyme mediating O-linked glycosylation of cytosolic and nuclear proteins, is essential for glucose-dependent MafA expression. Consistent with this observation, inhibition of N-acetylglucosaminidase, the enzyme involved in the removal of the O-GlcNAc modification from proteins, with O-(2-acetamido-2-deoxy-d-glucopyranosylidene)amino-N-phenylcarbamate stimulates MafA expression under low glucose conditions. The presented data suggest that MafA expression mediated by high glucose requires flux through the hexosamine biosynthetic pathway and the O-linked glycosylation of an unknown protein(s) by UDP-N-acetylglucosaminyl transferase.
Type II diabetes is a complex disease caused by defects in the synthesis of insulin, insulin secretion, and insulin action. These defects alter glucose homeostasis, leading to hyperglycemia, glucotoxicity, and the secondary complications associated with diabetes (1, 2). The maintenance of glucose homeostasis thus depends on the appropriate synthesis and secretion of the polypeptide hormone insulin, which is produced solely within the beta cells of the pancreas. High blood glucose levels induce beta cells to immediately secrete insulin and a more prolonged exposure to high glucose stimulates beta cells to increase insulin synthesis (1-3). Glucose-dependent insulin synthesis is regulated by increased transcription of the insulin gene, stabilization of insulin mRNA, and increased translation of insulin mRNA (4-6). The combination of glucose-dependent insulin secretion and enhanced insulin synthesis is essential for maintaining glucose homeostasis in non-diabetic individuals (1-3).
The glucose-dependent transcription of insulin is regulated by a number of cis-acting elements within 350 base pairs upstream of the insulin gene start site. The A3, E1, and C1 elements of the insulin promoter are critical for glucose-dependent insulin gene transcription (7-9) and are recognized by the transcription factors Pdx-1 (pancreatic duodenal homeobox factor 1), Beta2 (β-cell E-box transactivator 2), and MafA (mammalian homologue of avian MafA/L-Maf; formerly known as the RIPE-3b1 (rat insulin promoter element) activator)), respectively (10-15). MafA has been suggested to be a major activator of insulin gene transcription (16) and consistent with this idea, MafA knock-out mice have reduced insulin transcript levels (17). However, Pdx-1, Beta2, and MafA have been shown to synergize to form an active transcriptional complex at the insulin promoter leading to the glucose-dependent transcription of the insulin gene (7-9, 16).
The mechanisms by which high glucose levels modulate insulin gene transcription remain to be established. Insulin itself, via an autocrine feedback mechanism, has been suggested to stimulate signaling events leading to insulin synthesis (18). Glucose has also been shown to stimulate various signaling pathways leading to the translocation of Pdx-1 and Beta2 from the cytosol into the nucleus (19-21). Despite the increasing body of information for how Beta2 and Pdx-1 are regulated by glucose, the signaling events regulating MafA-mediated insulin gene transcription in beta cells are not well understood. However, MafA mRNA and protein levels are increased in response to high glucose levels (12, 14, 16).
The hexosamine biosynthetic pathway (HBP)2 is linked to glycolysis via fructose 6-phosphate, which is used by the glutamine:fructose-6-phosphate amidotransferase (GFAT), the rate-limiting enzyme of the HBP. The end-product of the HBP is UDP-GlcNAc, which is used as the substrate for N- and O-linked glycosylation of proteins. The HBP has been shown to be a sensor of nutrient status and is involved in regulating transcriptional and translational events (22-29).
UDP-N-acetylglucosaminyl transferase (OGT) is the enzyme that uses UDP-GlcNAc as its substrate, leading to the O-glycosylation (O-GlcNAcylation) of numerous cytsolic and nuclear proteins including transcription factors and proteins involved in signal transduction. As such, O-GlcNAcylation is known to regulate the expression of various genes (30-32). The modification of proteins by OGT occurs on both serine and threonine residues in a dynamic and reversible manner. In many cases, the same residues within a protein that are O-GlcNAc-modified can also be phosphorylated. Furthermore, the modification of the same residue in a protein by O-GlcNAcylation or phosphorylation may impose opposite effects on its function. O-GlcNAcylation is known to affect the stability, localization, interaction, and activity of a variety of proteins (31, 33).
The transcription factor MafA has been suggested to be an important regulator of pancreatic beta cell function (17, 34, 35). However, the mechanism(s) that regulates mafA gene expression remains largely unknown. In this report, we provide evidence that flux through the HBP and O-GlcNAcylation are involved in MafA expression induced by high glucose in beta cell lines. The presented data may be useful in the development of novel clinical interventions to treat diabetes.
EXPERIMENTAL PROCEDURES
Chemicals
d-glucose, l-glucose, fructose, mannose, pyruvate, 2-deoxy-d-glucose (2DG), 6-deoxy-d-glucose, 3-O-methyl-d-glucose, glucosamine, insulin from bovine pancreas, potassium chloride (KCl), 6-diazo-5-oxo-l-norleucine (DON), and azaserine were obtained from Sigma. O-(2-Acetamido-2-deoxy-d-glucopyranosylidene)amino-N-phenylcarbamate (PUGNAc) was obtained from Toronto Research Chemicals Inc. (Ontario, Canada). Cell culture media were obtained from Atlanta Biologicals (Lawrenceville, GA).
Cell Culture
Mouse insulinoma 6 (MIN6) cells of passage 19–30 were cultured in Dulbecco's modified Eagle's medium containing 25 mm glucose, 10% (v/v) fetal bovine serum, 1% (v/v) penicillin/streptomycin, 2 mm glutamine, and 100μm β-mercaptoethanol (36). For each experiment, MIN6 cells were grown overnight (16–18 h) in Dulbecco's modified Eagle's medium containing d-glucose, l-glucose, fructose, mannose, or pyruvate as indicated in the figure legends. Mouse betaTC3 insulinoma cells were cultured in RPMI 1640 medium supplemented with 10% (v/v) fetal bovine serum, 1% (v/v) penicillin/streptomycin, 10 mm Hepes buffer, 2 mm glutamine, 1 mm pyruvate, and 100 μm β-mercaptoethanol (37). For experiments utilizing betaTC3 cells, cells were grown overnight (16–18 h) in Dulbecco's modified Eagle's medium containing d-glucose, pyruvate, glucosamine, DON, or PUGNAc as indicated.
Western Blotting
For Western blotting, whole-cell extracts from MIN6 cells were prepared as described previously (38, 39). Proteins were separated by SDS-PAGE and subsequently electroblotted onto nitrocellulose membranes (Osmonics Inc.). Membranes were blocked for 1 h at room temperature in 1× TTBS (20 mm Tris, pH 7.4, 150 mm NaCl, 0.1% Triton X-100) supplemented with 5% Carnation nonfat dry milk. After blocking, membranes were incubated overnight at 4 °C with either Pdx-1 (gift from Dr. Chris Wright, Vanderbilt University), MafA (Calbiochem), Egr-1 (Santa Cruz Biotechnology, Inc., Santa Cruz, CA), β-actin (Sigma), OGT (40), or TATA-binding protein (TBP; Santa Cruz Biotechnology) antibody. Membranes were washed four times for 10 min in TTBS and subsequently incubated for1hat room temperature with a secondary horseradish peroxidase-conjugated antibody and proteins were visualized using the ECL chemiluminescent detection system (Amersham Biosciences).
Real Time PCR
Real time RT-PCR analysis was performed as described previously (39, 41). Briefly, RNA was isolated from MIN6 cells using the RNeasy® minikit (Qiagen) according to the manufacturer's instructions. First-strand cDNA synthesis was performed using the enhanced avian HS RT-PCR kit (Sigma) by following the manufacturer's protocol, after treatment with DNase I (Sigma) in order to remove any potentially contaminating genomic DNA. Real time amplification of the cDNA was performed using the Brilliant SYBR Green QPCR Master Mix according to the manufacturer's protocol (Stratagene). The oligonucleotide primers used in this study have previously been described (15, 42). The MafA primers are 5′-AGGCCTTCCGGGGTCAGAG-3′ and 5′-TGGAGCTGGCACTTCTCGCT-3′ (15), the β-actin primers are 5′-CGTGGGCCGCCCTAGGCAACC-3′ and 5′-TTGGCCTTAGGGTTCAGGGGGG-3′ (42), and the insulin I primers are 5′-CCTGTTGGTGCACTTCCTAC-3′ and 5′-TGCAGTAGTTCTCCAGCTGG-3′ (42). Real time PCRs were performed on an Mx4000 instrument (Stratagene) and the obtained data were analyzed as described previously (39, 41). Fold differences in MafA and insulin expression, normalized to β-actin levels, were calculated using the formula 2ΔΔCt (43). In this equation, Ct refers to the cycle threshold at the time in which the fluorescence intensity reaches a level above the background fluorescence, and ΔΔCt = (CtMafA or insulin − Ctactin)treatment x − (CtMafA or insulin − Ctactin)treatment y. Treatment x, for example, represents data obtained from cells incubated under 25 mm glucose conditions, whereas treatment y represents data obtained from 1 mm incubated cells (as in Fig. 1B). Therefore, the data are expressed as -fold increases in mRNA levels in cells cultured under the conditions described in each figure legend (such as 25 mm glucose) over the amount of mRNA levels in cells treated with pyruvate or 1 mm glucose.
FIGURE 1.
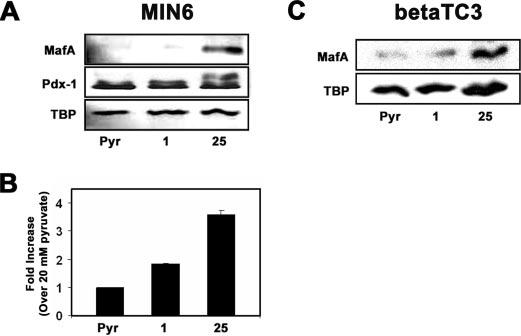
High glucose, but not pyruvate, induces MafA expression. MIN6 and betaTC3 cells were cultured in the presence of 20 mm pyruvate (Pyr),1mm glucose, or 25 mm glucose overnight. A, Western blot analysis of MafA and Pdx-1 protein levels. B, real time RT-PCR analysis of MafA mRNA levels. MafA mRNA levels were normalized to β-actin mRNA levels, and -fold increases were calculated based on the levels of MafA mRNA present in cells grown on 20 mm pyruvate. The data shown represent averages of two independent samples ± S.D. C, Western blot analysis of MafA protein levels in betaTC3 cells.
Cell Viability Assay
Cell viability was measured via the MTT (3-(4,5-dimethylthiazol-2-yl)-2,5-diphenyltetrazolium bromide) assay (44) using the Cell Proliferation Kit I from Roche Applied Science according to the manufacturer's instructions. Briefly, 60,000 MIN6 cells/well were cultured into U-bottom 96-well tissue culture plates (BD Biosciences). After ∼24 h, the medium was replaced with 1 mm glucose, 20 mm pyruvate, or 25 mm glucose without serum for 16–18 h. Subsequently, the medium was replaced with 100 μl/well fresh 1 mm glucose, 20 mm pyruvate, or 25 mm glucose along with 10 μl/well of the 3-(4,5-dimethylthiazol-2-yl)-2,5-diphenyltetrazolium bromide labeling reagent (final concentration 0.5 mg/ml) supplied within the kit. The cells were then incubated for 4 h at 37 °C and 5.2% CO2. The resulting formazan crystals were solubilized with 100 μl of the solubilization solution, and the optical density of the solubilized formazan product was measured at 562 nm with a μQuant™ microplate spectrophotometer (BioTek Instruments, Inc.) plate reader. The data are expressed as A562 for each treatment type.
Insulin Secretion Assay
Insulin secretion from MIN6 cells was determined as previously described with the noted exceptions (41). Briefly, MIN6 cells were equilibrated for 2 h in 1× KRBH buffer (119 mm NaCl, 4.74 mm KCl, 2.54 mm CaCl2, 1.19 mm MgSO4, 1.19 mm KH2 PO4,25mm NaHCO3, 10mm HEPES (pH 7.4), 0.1 g of bovine serum albumin). After equilibration, cells were washed twice with 1× KRBH buffer and incubated for 1 h in 1× KRBH buffer containing 1 mm glucose, 25 mm glucose, 20 mm pyruvate, or 20 mm pyruvate plus 50 mm KCl. After this incubation, the insulin concentration in the medium was determined using the mouse ultrasensitive insulin enzyme-linked immunosorbent assay kit (ALPCO) according to the manufacturer's protocol. The amount of insulin secreted (ng/ml), normalized to total protein levels (mg/ml), was calculated, and the data were expressed as -fold changes over the amount of insulin secreted (ng/ml insulin versus mg/ml total protein) from MIN6 cells incubated with 1 mm glucose.
ATP Measurement
ATP levels were measured in MIN6 cells cultured overnight on 20 mm pyruvate, 1 mm, 5 mm, 10 mm, 15 mm, 20 mm, or 25 mm glucose. Cells were washed twice with 1× PBS and subsequently lysed with a somatic cell ATP-releasing reagent (Sigma). The released intracellular ATP was then measured using the ATP bioluminescent somatic cell assay kit (Sigma) according to the manufacturer's instructions and as described for INS-1 beta cells (45). ATP measurements were carried out within 96-well, white Chromalux plates (DYNEX Technologies) using an Lmax luminometer (Molecular Devices). The instrument was preset to integrate the amount of light produced over a 5-s interval with a 2-s initial delay. The amount of intracellular ATP (pg/pl) was calculated based on an ATP standard curve that was generated from ATP standards provided within the kit. The calculated intracellular ATP value (pg/pl) was then normalized to total protein levels (pg/pl).
siRNA Assay
UDP-N-acetylglucosaminyl transferase (OGT) and negative control (Silencer® negative control 1) siRNAs were designed by and purchased from Ambion Inc. (Austin, TX). The siRNAs were transfected at a final concentration of 2 μg per 2 × 10⁶ MIN6 cells using the transfection reagent nucleofector kit (Amaxa Inc.) and the Nucleofector II Device (Amaxa Inc.) according to the manufacturer's instructions. Approximately 60 h after transfection, whole-cell extracts were prepared, and Western blotting was preformed to detect OGT, MafA, and β-actin protein levels.
Number of Independent Experiments
Unless otherwise noted in the figure legends, the data shown represent averages of three or four independent experiments ± S.D. values. TBP was used as a loading control for Western blots.
RESULTS
High Glucose, but Not Pyruvate, Induces MafA Expression
Previous data indicate that MafA mRNA and protein levels are induced by high glucose in both insulinoma cell lines and isolated rat islets (12, 14, 16). However, the mechanism controlling this glucose-regulated event is unknown. To investigate the detailed mechanisms of this regulation, we studied MafA expression by glucose in the mouse insulinoma cell line MIN6 and betaTC3. Consistent with previous work (12, 14, 16), we found that MafA protein levels increased in MIN6 cells cultured under high glucose concentrations (25 mm) compared with low (1 mm) glucose or 20 mm pyruvate-incubated cells (Fig. 1A). TBP and Pdx-1 protein levels remained unchanged under these conditions (Fig. 1A). Real time RT-PCR was utilized to confirm that the increase in MafA protein levels is due to an increase in MafA mRNA levels. MafA mRNA levels (normalized to β-actin mRNA) were about 2-fold increased on high glucose compared with low glucose-incubated MIN6 cells (Fig. 1B). These data are consistent with previous work suggesting that glucose induces MafA expression by enhancing its transcription (12).
The metabolism of glucose via glycolysis yields pyruvate; however, treatment of MIN6 cells with 20 mm pyruvate did not lead to induction of MafA mRNA or protein levels compared with high glucose (Fig. 1, A and B). The cell viability of MIN6 cells cultured on 1 mm glucose or 20 mm pyruvate was not substantially different from MIN6 cells cultured on 25 mm glucose (supplemental Fig. S1), suggesting that the observed differences in MafA levels are not due to differences in cell viability. Therefore, these data indicate that induction of MafA expression requires a signal/metabolite upstream of pyruvate. Induction of MafA expression by high levels of glucose was also observed using the mouse insulinoma cell line betaTC3 (Fig. 1C).
Hexose Metabolism, but Not Glucose Uptake, Glucose Phosphorylation, or Osmotic Stress, Is Required to Increase MafA Protein Levels
We tested the idea that the induction of MafA expression requires the general metabolism of hexose sugars by incubating MIN6 cells with 2 or 20 mm mannose or fructose (Fig. 2A). Like high glucose, the addition of high mannose (20 mm) also stimulated MafA expression, whereas the addition of 2 or 20 mm fructose had no effect (Fig. 2A). Mannose has been shown to be metabolized by beta cells, but fructose is not metabolized in the absence of glucose (46, 47). Like fructose, galactose is also not metabolized in pancreatic beta cells and failed to induce MafA expression (data not shown). These data indicate that the metabolism of hexose sugars is required for MafA expression.
FIGURE 2.
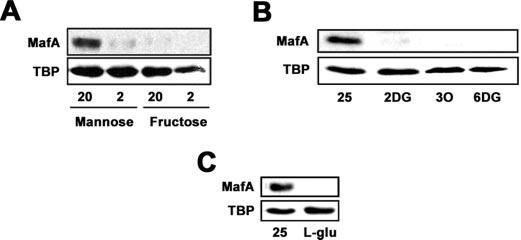
Hexose metabolism, but not glucose uptake, glucose phosphorylation, or osmotic stress, is required to increase MafA protein levels. A, Western blot analysis of MafA protein levels in MIN6 cells cultured with 20 or 2 mm mannose and fructose overnight. B, analysis of MafA protein levels in cells cultured overnight in the presence of 25 mm d-glucose, 30 mm 2DG, 30 mm 3-O-methyl-d-glucose (3O), or 30 mm 6-deoxy-d-glucose (6DG). C, MafA protein levels after incubation of MIN6 cells with 25 mm glucose or 30 mm l-glucose.
In order to determine whether glucose uptake and/or glucose phosphorylation are sufficient to generate the signal that induces MafA expression, we treated MIN6 cells overnight with 2DG, 6-deoxy-d-glucose, or 3-O-methyl-d-glucose. 2DG is taken-up by beta cells and is phosphorylated to form 2-deoxy-d-glucose-6-phosphate, which cannot be further metabolized. As shown in Fig. 2B, MafA expression is not induced by 2DG. Treatment of MIN6 cells with 6-deoxy-d-glucose or 3-O-methyl-d-glucose, which are taken up by beta cells but cannot be phosphorylated, also failed to induce MafA expression (Fig. 2B). These data suggest that the simple uptake or phosphorylation of glucose is not sufficient to induce MafA expression.
Cellular stress is known to increase insulin gene transcription (48). Since the addition of 25 mm d-glucose causes osmotic stress, we tested whether the addition of 30 mm l-glucose has an effect on the induction of MafA expression. l-Glucose, which cannot enter the cell but causes osmotic stress, did not stimulate MafA expression. Taken together, the presented data indicate that a glucose metabolite between glucose 6-phosphate and pyruvate contributes to the glucose-induced expression of MafA in MIN6 beta cells.
Induction of MafA Expression by High Glucose Is Independent of ATP Levels
Analysis of MafA protein levels after overnight incubation of MIN6 cells with various concentrations of glucose indicates that MafA expression is inducible by as low as 5 mm glucose (Fig. 3A). MafA protein levels increased with increasing concentrations of glucose and reached a maximum at 20 mm glucose (Fig. 3A). Interestingly, we also observed that ATP levels in MIN6 cells increased with increasing glucose levels up to 20 mm glucose and then began to decrease at 25 mm glucose (Fig. 3B). Given that increased ATP levels mediate glucose-dependent insulin secretion (49) and can stimulate gene expression via ATP-dependent chromatin remodeling complexes (50), we compared ATP levels in cells incubated with 20 mm pyruvate with that of glucose-grown cells. As shown in Fig. 3B, pyruvate-incubated cells produce as much ATP as 15 mm glucose-incubated cells. However, pyruvate is unable to induce MafA expression (Figs. 1, A and C, and 3, A and C), indicating that glucose stimulates MafA expression independent of ATP levels and the general energy status of the cell.
FIGURE 3.
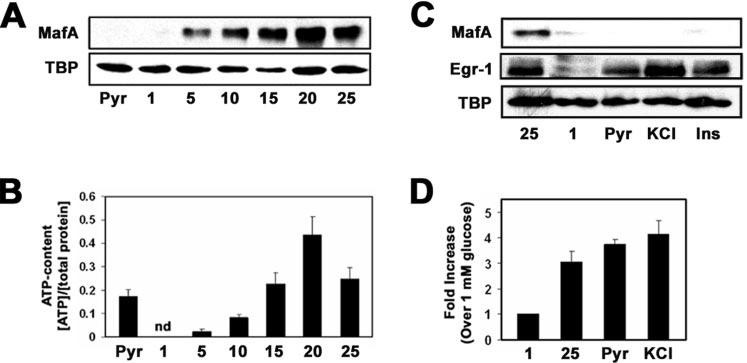
Induction of MafA expression by high glucose is independent of ATP levels and insulin secretion. A, Western blot analysis of MafA protein levels in MIN6 incubated with 20 mm pyruvate (Pyr) or 1, 5, 10, 15, 20, or 25 mm glucose. B, measurements of intracellular ATP levels, as described within the “Experimental Procedures,” from MIN6 cells cultured overnight in the presence of 20 mm pyruvate or 1, 5, 10, 15, 20, or 25 mm glucose. nd, not detectable. C, Western blot analysis of MafA protein levels in MIN6 cells incubated with 25 mm glucose, 1 mm glucose, 20 mm pyruvate, 50 mm KCl, or 1 μm exogenous insulin. Egr-1 was utilized as a positive control. D, analysis of glucose-, pyruvate-, and KCl-stimulated insulin secretion in MIN6 cells.
MafA Expression Is Not Induced by Exogenous or Secreted Insulin
Insulin secreted upon a rise in glucose levels leads to an autocrine feedback mechanism that appears to stimulate insulin gene transcription (18). Insulin signaling has also recently been suggested to be a potential regulator of MafA expression (51). To test this idea, we determined MafA protein levels in MIN6 cells treated with KCl, a known stimulator of insulin secretion, or exogenous insulin. Cells exposed to 50 mm KCl or 1 μm exogenous insulin lacked MafA protein like the cells incubated with 1 mm glucose or 20 mm pyruvate (Fig. 3C). As a positive control, we measured the protein levels of the early growth factor 1 (Egr-1) gene, which has been shown to be induced by exogenous insulin (52-54). Consistent with published data, high glucose, KCl, and exogenous insulin stimulated the expression of Egr-1 (Fig. 3C). Interestingly, we also found that pyruvate stimulated Egr-1 expression (Fig. 3C). The amount of insulin secreted from MIN6 cells treated with 20 mm pyruvate was comparable with that of cells treated with 25 mm glucose or 50 mm KCl (Fig. 3D). These data suggest that the glucose induction of MafA expression is independent of insulin secretion or insulin autocrine signaling.
Flux through the Hexosamine Bio-synthetic Pathway Is Important for Glucose Induction of MafA Expression
The HBP has been proposed to act as a nutrient sensor allowing cells to adjust to their current energy status (23, 25, 26). Since MafA expression is induced by high glucose, we tested the involvement of the HBP by treating MIN6 cells with DON, an inhibitor of glutamine amidotransferases, including GFAT. GFAT is the rate-limiting enzyme of the HBP that catalyzes the conversion of fructose-6-phosphate and glutamine into glucosamine-6-phosphate and glutamate. MIN6 cells treated with high glucose plus DON lacked MafA protein, whereas Pdx-1 and TBP protein levels remained unchanged (Fig. 4A).
FIGURE 4.
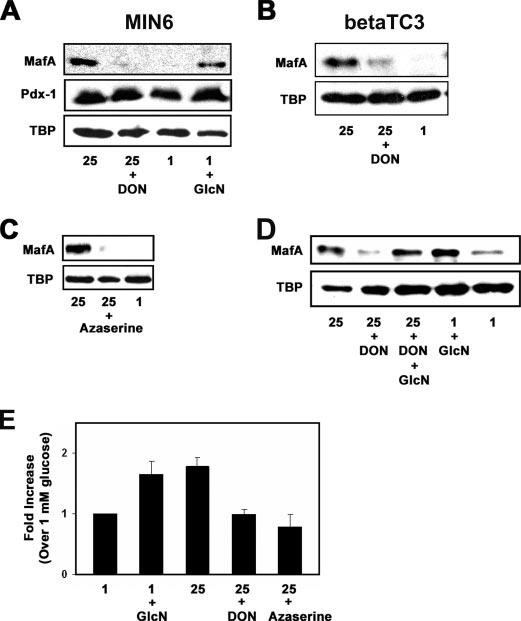
Flux through the hexosamine biosynthetic pathway is important for glucose induction of MafA expression. A, protein levels of MafA, TBP, and Pdx-1 were determined in MIN6 cells incubated with 25 mm glucose, 25 mm glucose plus 20μm DON, 1 mm glucose, or 1 mm glucose plus 2 mm GlcN. B, MafA and TBP protein levels within betaTC3 cells were analyzed by Western blotting after cells were cultured overnight in the presence of 25 mm glucose, 25 mm glucose plus 20 μm DON, or 1 mm glucose. C, Western blot analysis of MafA protein levels in MIN6 cells grown in the presence 25 mm glucose, 25 mm glucose plus 50 μm azaserine, or 1 mm glucose. D, analysis of MafA and TBP protein levels after overnight culture of MIN6 cells in the presence of 25 mm glucose, 25 mm glucose plus 20 μm DON, 25 mm glucose plus 20 μm DON plus 2 mm glucosamine, 1 mm glucose plus 2 mm glucosamine, or 1 mm glucose. E, real time RT-PCR analysis of MafA mRNA levels, normalized to β-actin mRNA levels, in MIN6 cells cultured overnight on 1 mm glucose, 1 mm glucose plus 2 mm glucosamine, 25 mm glucose, 25 mm glucose plus 20 μm DON, or 25 mm glucose plus 50 μm azaserine. -Fold increases in MafA mRNA levels are compared with mRNA levels measured in 1 mm glucose-incubated cells.
Inhibition of GFAT with DON in the presence of high glucose led to a decrease of MafA protein levels also in the pancreatic beta cell line betaTC3 (Fig. 4B). Azaserine, another inhibitor of glutamine amidotransferases, such as GFAT, also blocked the glucose-dependent expression of MafA in MIN6 cells (Fig. 4C). These data suggest that inhibition of GFAT blocks the glucose-dependent expression of MafA protein. To further demonstrate the involvement of the HBP in MafA expression, we treated MIN6 cells with glucosamine, which is directly phosphorylated to produce glucosamine 6-phosphate. Thus, glucosamine can then be utilized to form the end-product of the HBP, UDP-GlcNAc, by bypassing the GFAT reaction (28). Treatment of MIN6 cells with 2mm glucosamine led to the expression of MafA protein (Fig. 4A). Since DON and azaserine are not specific inhibitors of GFAT and can inhibit other amidotransferases, we tested whether the addition of glucosamine can restore MafA expression by bypassing the inhibition of GFAT by DON. As illustrated in Fig. 4D, the addition of glucosamine to high glucose- and DON-treated MIN6 cells bypasses the inhibition of MafA expression by DON. MafA protein levels also persist under 1 mm glucose conditions in the presence of 2 mm glucosamine and DON (supplemental Fig. S2). These data clearly demonstrate that MafA protein expression requires flux through the HBP.
Next, we tested the effects of the HBP on MafA mRNA levels utilizing real time RT-PCR. MafA mRNA levels in MIN6 cells treated with 2 mm glucosamine or 25 mm glucose were 1.6- and 1.7-fold higher, respectively, than MafA mRNA levels in cells exposed to 1 mm glucose alone (Fig. 4E). MafA mRNA levels in MIN6 cells exposed to high glucose (25 mm) in the presence of the inhibitors DON or azaserine were similar to that of 1 mm glucose-cultured cells (Fig. 4E). In summary, the data presented in Fig. 4 indicate that glucose induction of mafA expression, at both the mRNA and protein level, requires flux through the hexosamine biosynthetic pathway.
Glucose Increases MafA Protein Levels via O-GlcNAcylation by OGT
UDP-GlcNAc is the end-product of the HBP that is used as a substrate for the UDP-N-acetylglucosaminyl transferase OGT, leading to the O-linked GlcNAc modification (O-GlcNAcylation) of cytosolic and nuclear proteins. O-GlcNAcylation increases in response to high glucose and is proposed to function as a glucose sensor in beta cells (23-26, 28, 55, 56). Since O-GlcNAc modification requires UDP-GlcNAc produced in the HBP, we determined the role of O-GlcNAcylation in MafA expression. MIN6 and betaTC3 cells were treated with PUGNAc, an inhibitor of N-acetylglucosaminidase (O-Glc NAcase) in the presence of low glucose. O-GlcNAcase is the enzyme responsible for the removal of O-GlcNAc residues from proteins, and treatment with PUGNAc increases O-GlcNAc levels (31, 57). The treatment of MIN6 cells with PUGNAc lead to an increase in MafA protein levels on 1 mm glucose (Fig. 5A). We also observed an increase in mafA mRNA levels in low glucose-incubated MIN6 cells after treatment with PUGNAc (data not shown). Similar observations were also made in the betaTC3 cell line (supplemental Fig. S3).
FIGURE 5.
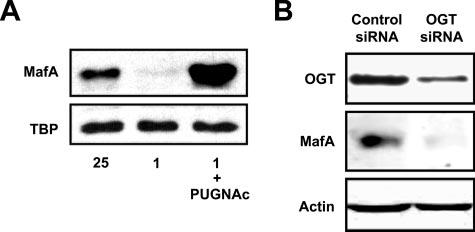
Glucose increases MafA protein levels via O-GlcNAcylation by OGT. A, Western blot analysis of MafA protein levels in MIN6 cells cultured overnight with 25 mm glucose, 1 mm glucose, or 1 mm glucose and 100 μm PUGNAc. B, OGT protein levels were knocked down within MIN6 cells using predesigned siRNA as described under “Experimental Procedures.” After OGT knockdown, MIN6 cells were cultured overnight on 25 mm glucose, after which time MafA and OGT protein levels were analyzed by Western blotting. β-Actin was used as a loading control. The blot shown is representative of two independent experiments.
To confirm the role of O-GlcNAcylation in glucose regulation of MafA expression, we utilized siRNA technology to knock down the expression of OGT. As illustrated in Fig. 5B, siRNA knockdown of OGT decreased OGT protein levels by ∼70%, and this led to the ablation of MafA protein expression. The percentage of OGT knockdown correlates with the decrease in MafA protein levels (supplemental Fig. S4). Together, these data suggest that the glucose-dependent expression of MafA requires an O-GlcNAcylation event.
Insulin mRNA Levels Increase in Response to Glucosamine
MafA is known to play a role in glucose-dependent insulin gene transcription (12-17, 34, 58-60). Since the flux through the HBP and O-GlcNAcylation is important for MafA expression, we tested whether increasing the flux through HBP by the addition of 2 mm glucosamine in the presence of low glucose also stimulates insulin gene transcription. As illustrated in Fig. 6, insulin mRNA levels in MIN6 cells treated with 1 mm glucose plus 2 mm glucosamine or 25 mm glucose were 3.8- and 3.3-fold higher, respectively, than insulin mRNA levels in cells exposed to 1 mm glucose alone. These data are consistent with the idea that increased flux through the HBP induces MafA expression and thereby stimulates insulin gene transcription.
FIGURE 6.
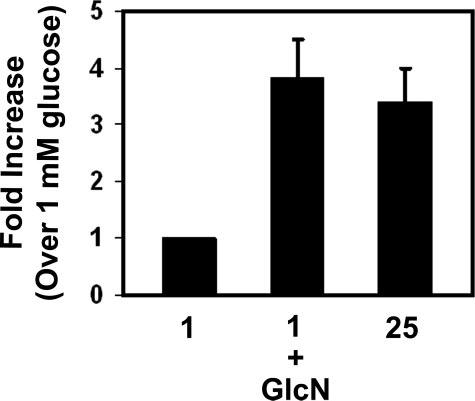
Insulin mRNA levels increase in response to glucosamine. MIN6 cells were cultured in 1 mm glucose or 1 mm glucose plus 2 mm GlcN overnight. Real time RT-PCR analysis of insulin mRNA levels were normalized to β-actin mRNA levels, and -fold increases refer to insulin mRNA present in cells grown on 1 mm glucose as described under “Experimental Procedures.”
DISCUSSION
MafA is a basic leucine zipper transcription factor belonging to the large Maf family of transcription factors (61). MafA (l-Maf) was originally described as a key regulator in chicken lens differentiation, but more recently MafA has been implicated as a major player in pancreatic beta cell function in vivo (17, 35). MafA is involved in insulin gene transcription, insulin secretion, and beta cell survival (12-17, 35, 60) and thereby is required for the maintenance of glucose homeostasis in vivo. MafA knock-out mice have altered insulin mRNA levels, display defects in insulin secretion, and develop diabetes (17). Furthermore, disruption of insulin gene transcription by glucotoxicity may be partly due to the MafA dysfunction (58, 62, 63). Therefore, MafA is potentially a useful target for the development of novel diabetic therapies.
In beta cells, MafA expression and binding to the C1 element of the insulin promoter is induced by high glucose (9, 12, 14, 16). In this study, we determined the metabolic events leading to glucose-dependent MafA expression. There are several possibilities by which glucose may induce MafA expression, including 1) flux through glycolysis or the tricarboxylic acid cycle, 2) the simple uptake or phosphorylation of glucose, 3) increased cellular stress as the result of high glucose conditions, 4) increased ATP levels as the result of glucose metabolism, 5) insulin autocrine signaling, or 6) the use of a metabolic intermediate(s) within a branch pathway of glycolysis or the tricarboxylic acid cycle. We demonstrate that flux through the HBP, a branch pathway of glycolysis, is involved in the regulation of MafA expression by high glucose. Furthermore, we show that O-GlcNAcylation mediated by OGT is required for MafA expression under high glucose conditions.
The lipogenic enzyme acetyl-CoA carboxylase displays a similar regulation as MafA in beta cells. d-Glucose and man-nose, but not pyruvate, fructose, or 6-deoxy-d-glucose, stimulate the expression of acetyl-CoA carboxylase (64). However, in contrast to MafA expression, the glucose-dependent transcriptional up-regulation of acetyl-CoA carboxylase is partially induced by 2DG, suggesting the requirement for glucose 6-phosphate (64). Interestingly, recent data indicate that the glucose-dependent expression of acetyl-CoA carboxylase in adipocytes and beta cells involves the hexosamine biosynthetic pathway (30).
Insulin has been shown to modulate the expression of beta cell-specific genes through an autocrine feedback mechanism (18). Moreover, mice lacking both the insulin and insulin growth factor-I receptor fail to produce MafA, indicating that insulin signaling may be involved in MafA expression (51). However, we found that secreted or exogenous insulin failed to induce MafA expression (Fig. 3C) in the MIN6 cell line. In agreement with this observation is that glucose induction of MafA expression is independent of ATP levels. Treatment of MIN6 cells with 20 mm pyruvate results in increased ATP levels and insulin secretion but failed to induce MafA expression (Fig. 3, B–D).
The HBP is known to regulate the expression of several genes (30, 56, 65). For example, the glucose-dependent expression of the transcriptional repressor Id2 occurs via flux through the hexosamine pathway within macrophages (66). Glucosamine treatment in the presence of low glucose induced Id2 expression whereas inhibition of GFAT by azaserine in the presence of high glucose abolished Id2 expression. Our data indicate that MafA expression is also regulated by the HBP. Glucosamine stimulates the expression of MafA at both the protein and mRNA level (Fig. 4, A, D, and E), whereas inhibition of GFAT under high glucose conditions by treatment with DON or azaserine inhibits the expression of MafA (Fig. 4, A–E). Moreover, consistent with the idea that the flux via the HBP induces MafA expression and that MafA is required for glucose-dependent transcription of the insulin gene (12-17, 34, 58-60), we found that increasing the flux through the HBP by treatment with glucosamine stimulated insulin gene transcription on low glucose (Fig. 6).
Increased flux through glycolysis and, thus, the HBP under high glucose conditions leads to the accumulation of UDP-GlcNAc, the end-product of the HBP. The enzyme OGT uses UDP-GlcNAc as its substrate, leading to the O-GlcNAcylation of cytosolic and nuclear proteins, whereas O-GlcNAcase is the enzyme that removes O-GlcNAc residues from proteins. O-GlcNAcylation is thought to act as a nutrient-sensing mechanism in beta cells, leading to altered beta cell function. Moreover, O-GlcNAcylation mediates the expression of genes such as the plasminogen activator inhibitor-1 (23-26, 28, 30-32, 55, 56). We demonstrate in this report that O-GlcNAcylation also plays a role in mediating the glucose-dependent expression MafA. As with plasminogen activator inhibitor-1 expression in glomerular mesangial cells (32), siRNA knockdown of OGT in MIN6 cells led to the ablation of MafA expression on high glucose (Fig. 5B and supplemental Fig. S4), whereas inhibition of O-GlcNAcase with PUGNAc in MIN6 or betaTC3 cells led to the induction of MafA expression on low glucose (Fig. 5A and supplemental Fig. S3).
The induction of plasminogen activator inhibitor-1 expression under high glucose conditions in glomerular mesangial cells is linked to the O-GlcNAcylation of the transcription factor Sp1 (32). Whether Sp1 functions in the glucose-dependent expression of MafA has yet to be determined. However, FoxO1, FoxA2, Nkx2.2, and Pdx-1 have recently been implicated as key transcriptional regulators of MafA expression within pancreatic beta cells (67, 68). Of these factors, Pdx-1 is known to be modified by O-GlcNAcylation (24). Thus, it is tempting to speculate that the O-GlcNAcylation of Pdx-1 may be involved in MafA expression under high glucose conditions. Experiments addressing these possibilities are under way.
Normally, only 3–5% of glucose is utilized by the HBP, but flux through this pathway has been postulated to act as a glucose-sensing mechanism in beta cells (23, 25, 26). Several lines of evidence indicate an important role for HBP in maintaining appropriate glucose homeostasis in vivo. Mice overexpressing GFAT display enhanced insulin secretion initially but later develop symptoms similar to those induced by glucotoxicity, including, insulin resistance, and defects in insulin secretion (69, 70). These data suggest that short term versus chronic flux through the HBP can have positive and deleterious effects on glucose homeostasis, respectively. Like the deleterious effects on insulin secretion, chronic flux through the HBP may contribute to ablated insulin gene transcription, considering that insulin expression is lost under glucotoxic conditions as the result of decreased binding of Pdx-1 and MafA to the insulin promoter (58, 62, 71, 72).
Interestingly, we found that high glucose induces MafA protein levels by 4–5-fold compared with low glucose or pyruvate; however, we observed only a 2-fold induction of MafA mRNA levels on high glucose (Fig. 1). We suggest that this discrepancy between MafA protein and mRNA levels induced by high glucose may be explained by the possibility that MafA expression is regulated by transcriptional as well as post-transcriptional mechanisms, such as increased mRNA stability, protein stability, and/or enhanced translation. Glucose has been shown to induce the transcription of the insulin gene, stabilization of insulin mRNA, and the translation of insulin mRNA (4-6). MafA expression may be regulated via similar mechanisms by glucose. Recent data support the idea that MafA protein levels may be regulated by a post-translational mechanism, since oxidative stress, induced by hyperglycemia, down-regulates MafA at the protein level (58). Whether glucose affects the stability of MafA mRNA or protein levels and whether glucose induces translational effects on MafA mRNA will be addressed in future studies.
In summary, in this study, we demonstrate for the first time that glucose-dependent MafA expression requires the HBP and O-GlcNAcylation. Further investigations are required to understand the exact mechanisms by which the HBP and O-GlcNAcylation induce MafA expression in response to high glucose, thus regulating insulin gene transcription and beta cell function (Fig. 7). A detailed understanding of the mechanisms regulating MafA expression and insulin gene transcription under normal and diabetic-like conditions may lead to the development of novel diabetes therapies, considering the importance of these events within the context of pancreatic beta cell function.
FIGURE 7.
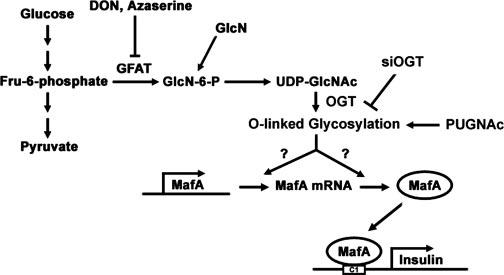
Glucose-dependent MafA expression involves the hexosamine biosynthetic pathway and O-GlcNAcylation. Flux through the HBP under high glucose conditions increases UDP-GlcNAc levels. UDP-GlcNAc is the substrate for OGT leading to the O-GlcNAcylation of an unknown protein(s) responsible for MafA up-regulation. DON and azaserine, inhibitors of GFAT, block the glucose-dependent expression of MafA, whereas GlcN treatment in the presence of low glucose stimulates MafA expression. PUGNAc, an inhibitor of O-GlcNAcase, increases MafA expression on low glucose concentrations, whereas siRNA knockdown of OGT decreases MafA expression under high glucose conditions. Flux through the HBP under high glucose or glucosamine conditions also leads to an increase in insulin mRNA levels, probably by a mechanism involving increased MafA expression and MafA binding to the C1 element of the insulin promoter.
Supplementary Material
Acknowledgments
We thank Dr. Chris Wright for the Pdx-1 antibody, Dr. J. Miyazaki for the MIN6 cell line, and Dr. Daniel J. Noonan and members of the Noonan laboratory for providing access to and technical assistance with their luminometer. We also thank current and former members of the Özcan laboratory and of the Department of Molecular and Cellular Biochemistry at the University of Kentucky for helpful discussions during the course of this work.
Footnotes
This work was supported by National Institutes of Health Grants 5R01DK067581-02 and 5R21DK065730-02 and National Center for Research Resources Grant P20 RR20171. The costs of publication of this article were defrayed in part by the payment of page charges. This article must therefore be hereby marked “advertisement” in accordance with 18 U.S.C. Section 1734 solely to indicate this fact.
The on-line version of this article (available at http://www.jbc.org) contains supplemental Figs. S1–S4.
The abbreviations used are: HBP, hexosamine biosynthetic pathway; MIN6, mouse insulinoma-6; TBP, TATA-binding protein; GFAT, glutamine:fructose-6-phosphate amidotransferase; DON, 6-diazo-5-oxo-l-norleucine; PUGNAc, O-(2-acetamido-2-deoxy-d-glucopyranosylidene)amino-N-phenylcarbamate; OGT, UDP-N-acetylglucosaminyl transferase; O-GlcNAcase, N-acetylglucosaminidase; O-GlcNAcylation, O-glycosylation; 2DG, 2-deoxy-d-glucose; RT, reverse transcription; siRNA, small interfering RNA.
REFERENCES
- 1.LeRoith D. Am. J. Med. 2002;113(Suppl 6A):3–11. doi: 10.1016/s0002-9343(02)01276-7. [DOI] [PubMed] [Google Scholar]
- 2.Poitout V, Robertson RP. Annu. Rev. Med. 1996;47:69–83. doi: 10.1146/annurev.med.47.1.69. [DOI] [PubMed] [Google Scholar]
- 3.LeRoith D, Taylor SI, Olefsky JM. Diabetes Mellitus: A Fundamental and Clinical Text. 2nd Ed. Lippincott Williams and Wilkins; Philadelphia: 2000. [Google Scholar]
- 4.Nielsen DA, Welsh M, Casadaban MJ, Steiner DF. J. Biol. Chem. 1985;260:13585–13589. [PubMed] [Google Scholar]
- 5.Welsh M, Nielsen DA, MacKrell AJ, Steiner DF. J. Biol. Chem. 1985;260:13590–13594. [PubMed] [Google Scholar]
- 6.Itoh N, Okamoto H. Nature. 1980;283:100–102. doi: 10.1038/283100a0. [DOI] [PubMed] [Google Scholar]
- 7.Melloul D, Marshak S, Cerasi E. Diabetologia. 2002;45:309–326. doi: 10.1007/s00125-001-0728-y. [DOI] [PubMed] [Google Scholar]
- 8.Ohneda K, Ee H, German M. Semin. Cell Dev. Biol. 2000;11:227–233. doi: 10.1006/scdb.2000.0171. [DOI] [PubMed] [Google Scholar]
- 9.Poitout V, Hagman D, Stein R, Artner I, Robertson RP, Harmon JS. J. Nutr. 2006;136:873–876. doi: 10.1093/jn/136.4.873. [DOI] [PMC free article] [PubMed] [Google Scholar]
- 10.Ohlsson H, Karlsson K, Edlund T. EMBO J. 1993;12:4251–4259. doi: 10.1002/j.1460-2075.1993.tb06109.x. [DOI] [PMC free article] [PubMed] [Google Scholar]
- 11.Naya FJ, Stellrecht CM, Tsai MJ. Genes Dev. 1995;9:1009–1019. doi: 10.1101/gad.9.8.1009. [DOI] [PubMed] [Google Scholar]
- 12.Kataoka K, Han SI, Shioda S, Hirai M, Nishizawa M, Handa H. J. Biol. Chem. 2002;277:49903–49910. doi: 10.1074/jbc.M206796200. [DOI] [PubMed] [Google Scholar]
- 13.Olbrot M, Rud J, Moss LG, Sharma A. Proc. Natl. Acad. Sci. U. S. A. 2002;99:6737–6742. doi: 10.1073/pnas.102168499. [DOI] [PMC free article] [PubMed] [Google Scholar]
- 14.Kajihara M, Sone H, Amemiya M, Katoh Y, Isogai M, Shimano H, Yamada N, Takahashi S. Biochem. Biophys. Res. Commun. 2003;312:831–842. doi: 10.1016/j.bbrc.2003.10.196. [DOI] [PubMed] [Google Scholar]
- 15.Matsuoka TA, Zhao L, Artner I, Jarrett HW, Friedman D, Means A, Stein R. Mol. Cell Biol. 2003;23:6049–6062. doi: 10.1128/MCB.23.17.6049-6062.2003. [DOI] [PMC free article] [PubMed] [Google Scholar]
- 16.Zhao L, Guo M, Matsuoka TA, Hagman DK, Parazzoli SD, Poitout V, Stein R. J. Biol. Chem. 2005;280:11887–11894. doi: 10.1074/jbc.M409475200. [DOI] [PubMed] [Google Scholar]
- 17.Zhang C, Moriguchi T, Kajihara M, Esaki R, Harada A, Shimohata H, Oishi H, Hamada M, Morito N, Hasegawa K, Kudo T, Engel JD, Yamamoto M, Takahashi S. Mol. Cell Biol. 2005;25:4969–4976. doi: 10.1128/MCB.25.12.4969-4976.2005. [DOI] [PMC free article] [PubMed] [Google Scholar]
- 18.Leibiger IB, Leibiger B, Berggren PO. FEBS Lett. 2002;532:1–6. doi: 10.1016/s0014-5793(02)03627-x. [DOI] [PubMed] [Google Scholar]
- 19.MacFarlane WM, Read ML, Gilligan M, Bujalska I, Docherty K. Biochem. J. 1994;303:625–631. doi: 10.1042/bj3030625. [DOI] [PMC free article] [PubMed] [Google Scholar]
- 20.Macfarlane WM, Smith SB, James RF, Clifton AD, Doza YN, Cohen P, Docherty K. J. Biol. Chem. 1997;272:20936–20944. doi: 10.1074/jbc.272.33.20936. [DOI] [PubMed] [Google Scholar]
- 21.Petersen HV, Jensen JN, Stein R, Serup P. FEBS Lett. 2002;528:241–245. doi: 10.1016/s0014-5793(02)03318-5. [DOI] [PubMed] [Google Scholar]
- 22.Akimoto Y, Kreppel LK, Hirano H, Hart GW. Diabetologia. 2000;43:1239–1247. doi: 10.1007/s001250051519. [DOI] [PubMed] [Google Scholar]
- 23.Buse MG. Am. J. Physiol. 2006;290:E1–E8. doi: 10.1152/ajpendo.00329.2005. [DOI] [PMC free article] [PubMed] [Google Scholar]
- 24.Gao Y, Miyazaki J, Hart GW. Arch. Biochem. Biophys. 2003;415:155–163. doi: 10.1016/s0003-9861(03)00234-0. [DOI] [PubMed] [Google Scholar]
- 25.Marshall S, Bacote V, Traxinger RR. J. Biol. Chem. 1991;266:4706–4712. [PubMed] [Google Scholar]
- 26.McClain DA. J. Diabetes Complications. 2002;16:72–80. doi: 10.1016/s1056-8727(01)00188-x. [DOI] [PubMed] [Google Scholar]
- 27.Vosseller K, Wells L, Hart GW. Biochimie (Paris) 2001;83:575–581. doi: 10.1016/s0300-9084(01)01295-0. [DOI] [PubMed] [Google Scholar]
- 28.Wells L, Hart GW. FEBS Lett. 2003;546:154–158. doi: 10.1016/s0014-5793(03)00641-0. [DOI] [PubMed] [Google Scholar]
- 29.Zraika S, Dunlop M, Proietto J, Andrikopoulos S. Arch. Biochem. Biophys. 2002;405:275–279. doi: 10.1016/s0003-9861(02)00397-1. [DOI] [PubMed] [Google Scholar]
- 30.Rumberger JM, Wu T, Hering MA, Marshall S. J. Biol. Chem. 2003;278:28547–28552. doi: 10.1074/jbc.M302793200. [DOI] [PubMed] [Google Scholar]
- 31.Zachara NE, Hart GW. Biochim. Biophys. Acta. 2006;1761:599–617. doi: 10.1016/j.bbalip.2006.04.007. [DOI] [PubMed] [Google Scholar]
- 32.Goldberg HJ, Whiteside CI, Hart GW, Fantus IG. Endocrinology. 2006;147:222–231. doi: 10.1210/en.2005-0523. [DOI] [PubMed] [Google Scholar]
- 33.Love DC, Hanover JA. Sci. STKE 2005. 2005:re13. doi: 10.1126/stke.3122005re13. [DOI] [PubMed] [Google Scholar]
- 34.Kaneto H, Matsuoka TA, Nakatani Y, Miyatsuka T, Matsuhisa M, Hori M, Yamasaki Y. J. Biol. Chem. 2005;280:15047–15052. doi: 10.1074/jbc.M412013200. [DOI] [PubMed] [Google Scholar]
- 35.Nishimura W, Kondo T, Salameh T, El Khattabi I, Dodge R, Bonner-Weir S, Sharma A. Dev. Biol. 2006;293:526–539. doi: 10.1016/j.ydbio.2006.02.028. [DOI] [PMC free article] [PubMed] [Google Scholar]
- 36.Miyazaki J, Araki K, Yamato E, Ikegami H, Asano T, Shibasaki Y, Oka Y, Yamamura K. Endocrinology. 1990;127:126–132. doi: 10.1210/endo-127-1-126. [DOI] [PubMed] [Google Scholar]
- 37.Efrat S, Linde S, Kofod H, Spector D, Delannoy M, Grant S, Hanahan D, Baekkeskov S. Proc. Natl. Acad. Sci. U. S. A. 1988;85:9037–9041. doi: 10.1073/pnas.85.23.9037. [DOI] [PMC free article] [PubMed] [Google Scholar]
- 38.Mosley AL, Corbett JA, Ozcan S. Mol. Endocrinol. 2004;18:2279–2290. doi: 10.1210/me.2003-0463. [DOI] [PubMed] [Google Scholar]
- 39.Mosley AL, Ozcan S. J. Biol. Chem. 2004;279:54241–54247. doi: 10.1074/jbc.M410379200. [DOI] [PubMed] [Google Scholar]
- 40.Andrali SS, Maärz P, Özcan S. Biochem. Biophys. Res. Commun. 2005;337:149–153. doi: 10.1016/j.bbrc.2005.09.026. [DOI] [PubMed] [Google Scholar]
- 41.Finlin BS, Mosley AL, Crump SM, Correll RN, Ozcan S, Satin J, Andres DA. J. Biol. Chem. 2005;280:41864–41871. doi: 10.1074/jbc.M414261200. [DOI] [PubMed] [Google Scholar]
- 42.Roderigo-Milne H, Hauge-Evans AC, Persaud SJ, Jones PM. Biochem. Biophys. Res. Commun. 2002;296:589–595. doi: 10.1016/s0006-291x(02)00913-0. [DOI] [PubMed] [Google Scholar]
- 43.Livak KJ, Schmittgen TD. Methods. 2001;25:402–408. doi: 10.1006/meth.2001.1262. [DOI] [PubMed] [Google Scholar]
- 44.Mosmann T. J. Immunol. Methods. 1983;65:55–63. doi: 10.1016/0022-1759(83)90303-4. [DOI] [PubMed] [Google Scholar]
- 45.Lam NT, Cheung AT, Riedel MJ, Light PE, Cheeseman CI, Kieffer TJ. J. Mol. Endocrinol. 2004;32:415–424. doi: 10.1677/jme.0.0320415. [DOI] [PubMed] [Google Scholar]
- 46.Sener A, Giroix MH, Malaisse WJ. Eur. J. Biochem. 1984;144:223–226. doi: 10.1111/j.1432-1033.1984.tb08453.x. [DOI] [PubMed] [Google Scholar]
- 47.Zawalich WS, Rognstad R, Pagliara AS, Matschinsky FM. J. Biol. Chem. 1977;252:8519–8523. [PubMed] [Google Scholar]
- 48.Macfarlane WM, McKinnon CM, Felton-Edkins ZA, Cragg H, James RF, Docherty K. J. Biol. Chem. 1999;274:1011–1016. doi: 10.1074/jbc.274.2.1011. [DOI] [PubMed] [Google Scholar]
- 49.Newgard CB, McGarry JD. Annu. Rev. Biochem. 1995;64:689–719. doi: 10.1146/annurev.bi.64.070195.003353. [DOI] [PubMed] [Google Scholar]
- 50.Vignali M, Hassan AH, Neely KE, Workman JL. Mol. Cell Biol. 2000;20:1899–1910. doi: 10.1128/mcb.20.6.1899-1910.2000. [DOI] [PMC free article] [PubMed] [Google Scholar]
- 51.Ueki K, Okada T, Hu J, Liew CW, Assmann A, Dahlgren GM, Peters JL, Shackman JG, Zhang M, Artner I, Satin LS, Stein R, Holzenberger M, Kennedy RT, Kahn CR, Kulkarni RN. Nat. Genet. 2006;38:583–588. doi: 10.1038/ng1787. [DOI] [PubMed] [Google Scholar]
- 52.Alexander-Bridges M, Buggs C, Giere L, Denaro M, Kahn B, White M, Sukhatme V, Nasrin N. Mol. Cell Biochem. 1992;109:99–105. doi: 10.1007/BF00229762. [DOI] [PubMed] [Google Scholar]
- 53.Josefsen K, Sorensen LR, Buschard K, Birkenbach M. Diabetologia. 1999;42:195–203. doi: 10.1007/s001250051139. [DOI] [PubMed] [Google Scholar]
- 54.Ohsugi M, Cras-Meneur C, Zhou Y, Warren W, Bernal-Mizrachi E, Permutt MA. Diabetes. 2004;53:1496–1508. doi: 10.2337/diabetes.53.6.1496. [DOI] [PubMed] [Google Scholar]
- 55.Wells L, Vosseller K, Hart GW. Cell Mol. Life Sci. 2003;60:222–228. doi: 10.1007/s000180300017. [DOI] [PMC free article] [PubMed] [Google Scholar]
- 56.Wells L, Whelan SA, Hart GW. Biochem. Biophys. Res. Commun. 2003;302:435–441. doi: 10.1016/s0006-291x(03)00175-x. [DOI] [PubMed] [Google Scholar]
- 57.Vosseller K, Wells L, Lane MD, Hart GW. Proc. Natl. Acad. Sci. U. S. A. 2002;99:5313–5318. doi: 10.1073/pnas.072072399. [DOI] [PMC free article] [PubMed] [Google Scholar]
- 58.Harmon JS, Stein R, Robertson RP. J. Biol. Chem. 2005;280:11107–11113. doi: 10.1074/jbc.M410345200. [DOI] [PubMed] [Google Scholar]
- 59.Kataoka K, Shioda S, Ando K, Sakagami K, Handa H, Yasuda K. J. Mol. Endocrinol. 2004;32:9–20. doi: 10.1677/jme.0.0320009. [DOI] [PubMed] [Google Scholar]
- 60.Matsuoka TA, Artner I, Henderson E, Means A, Sander M, Stein R. Proc. Natl. Acad. Sci. U. S. A. 2004;101:2930–2933. doi: 10.1073/pnas.0306233101. [DOI] [PMC free article] [PubMed] [Google Scholar]
- 61.Reza HM, Yasuda K. Dev. Dyn. 2004;229:440–448. doi: 10.1002/dvdy.10467. [DOI] [PubMed] [Google Scholar]
- 62.Poitout V, Olson LK, Robertson RP. J. Clin. Invest. 1996;97:1041–1046. doi: 10.1172/JCI118496. [DOI] [PMC free article] [PubMed] [Google Scholar]
- 63.Sharma A, Olson LK, Robertson RP, Stein R. Mol. Endocrinol. 1995;9:1127–1134. doi: 10.1210/mend.9.9.7491105. [DOI] [PubMed] [Google Scholar]
- 64.Foufelle F, Gouhot B, Pegorier JP, Perdereau D, Girard J, Ferre P. J. Biol. Chem. 1992;267:20543–20546. [PubMed] [Google Scholar]
- 65.Akimoto Y, Hart GW, Hirano H, Kawakami H. Med. Mol. Morphol. 2005;38:84–91. doi: 10.1007/s00795-004-0264-1. [DOI] [PubMed] [Google Scholar]
- 66.Gronning LM, Tingsabadh R, Hardy K, Dalen KT, Jat PS, Gnudi L, Shepherd PR. Am. J. Physiol. 2006;290:E599–E606. doi: 10.1152/ajpendo.00242.2005. [DOI] [PubMed] [Google Scholar]
- 67.Kitamura YI, Kitamura T, Kruse JP, Raum JC, Stein R, Gu W, Accili D. Cell Metab. 2005;2:153–163. doi: 10.1016/j.cmet.2005.08.004. [DOI] [PubMed] [Google Scholar]
- 68.Raum JC, Gerrish K, Artner I, Henderson E, Guo M, Sussel L, Schisler JC, Newgard CB, Stein R. Mol. Cell. Biol. 2006;26:5735–5743. doi: 10.1128/MCB.00249-06. [DOI] [PMC free article] [PubMed] [Google Scholar]
- 69.Cooksey RC, Pusuluri S, Hazel M, McClain DA. Am. J. Physiol. 2006;290:E334–E340. doi: 10.1152/ajpendo.00265.2005. [DOI] [PubMed] [Google Scholar]
- 70.Tang J, Neidigh JL, Cooksey RC, McClain DA. Diabetes. 2000;49:1492–1499. doi: 10.2337/diabetes.49.9.1492. [DOI] [PubMed] [Google Scholar]
- 71.Harmon JS, Tanaka Y, Olson LK, Robertson RP. Diabetes. 1998;47:900–904. doi: 10.2337/diabetes.47.6.900. [DOI] [PubMed] [Google Scholar]
- 72.Olson LK, Redmon JB, Towle HC, Robertson RP. J. Clin. Invest. 1993;92:514–519. doi: 10.1172/JCI116596. [DOI] [PMC free article] [PubMed] [Google Scholar]
Associated Data
This section collects any data citations, data availability statements, or supplementary materials included in this article.